
Abstract
BACKGROUND:
The development of any disturbance in the Circle of Willis (COW) can change the hemodynamics of blood flow and result in damage to the vascular system. Clinical methods such as TCD for diagnosing an aneurysm or growth factors and rupture can measure blood velocity. Several factors influence the accuracy of TCD that can lead to wrong evaluations and affect the treatment planning.
OBJECTIVE:
In this study, the conformity between CFD and TCD was accomplished for investigating the accuracy of the clinical method (TCD) in different vessels of the Circle of Willis.
METHODS:
The realistic three-dimensional models have been produced from angiography images. Considering fluid-structure interaction, a domain of the blood flow and vessel wall has been simulated by the ANSYS.CFX software. The velocity in the cerebral arteries has been calculated and compared with the velocity acquired from TCD.
RESULTS:
According to the findings, there were significant differences between the results obtained from computational fluid dynamics and Doppler test in different vessels of the Circle of Willis. In some areas, differences close to 80 cm/s were also reported.
CONCLUSION:
According to the results, there are possibilities of errors in carrying out a Doppler test in some arteries and can lead to wrong estimates and ultimately incorrect decisions.
Introduction
The Circle of Willis (COW) is the main center of blood distribution in the brain and is considered a critically important area. The COW consists of a network of cerebral arteries in the base of the brain (Fig. 1). Blood flow enters the skull by Common Carotid Arteries (CCA) from the anterior and Vertebral Arteries (VA) from the posterior of the skull and then directly enters the COW. It is important to understand the sensitivity of cerebral perfusion in COW in order to prevent stroke, which is the third most frequent cause of death [1]. Any disturbance in the COW may change the hemodynamics of the blood flow and damage the vascular system. One of the most common damages is known as a brain aneurysm which is prevalent among 3–6% of individuals [2–5]. Arterial rupture and intracranial hemorrhage occur in approximately 2% of cases, annually [2,4].
Intracranial aneurysms are difficult to treat and often do not reveal symptoms before the rupture. Nowadays, only morphological properties of an aneurysm are evaluated pretreatment, without reference to hemodynamic abnormalities. At the moment, in-vivo clinical methods used for measurement of hemodynamic parameters, especially blood velocity, are Transcranial Doppler (TCD) and Phase Contrast Magnetic Resonance Imaging (PC-MRI). TCD is a common, noninvasive and cost-effective method that provides information regarding velocity [6,7]. However, it has some faults. Its accuracy depends on the correct localization of vessels, the angle of the probe, operator and anatomical boundaries of insonation windows [8]. In some studies, a noninvasive method has been investigated to diagnose artery diseases. They used the Ultrasonic Doppler method and the frequency of pulsatile motion of blood vessel wall is measured to check whether these frequencies are related to blood vessel diseases such as arteriosclerosis and aneurysm [9–11].
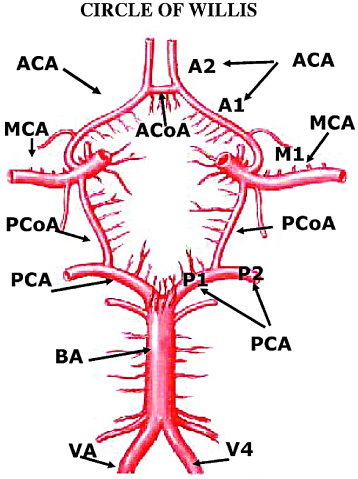
Schematic diagram of the Circle of Willis arteries. (ACA: Anterior Cerebral Artery, ACoA: Anterior Communication Artery, MCA: Middle Cerebral Artery, PCoA: Posterior Communication Artery, PCA: Posterior Cerebral Artery, BA; Basilar Artery, VA: Vertebra Artery).
The important point is that whether noninvasive and semi-invasive methods used for diagnosis of brain lesions can be reliable for determining the risk factors. Studies have been conducted to investigate the reliability of clinical methods and compared hemodynamic parameters with numerical methods or other clinical methods in the carotid artery [6,12] and the COW [2,8,13–16]. The conformity between computational fluid dynamics (CFD) and the clinical methods showed that it was qualitatively appropriate, but there were quantitative differences.
Up to now, limited research has been done on the entire COW or COW with an aneurysm, and their accuracy and reliability have been rarely investigated by clinical methods. Thus in this study, a realistic model of the entire COW with an aneurysm was simulated and patient-specific boundary conditions were imposed. Also, the velocity in all of the cerebral arteries of each case was measured by TCD. Then the correspondence between CFD and TCD was accomplished to investigate the accuracy of the clinical method (TCD) in different vessels of the COW.
The anatomy and morphology of the Circle of Willis (COW) and an aneurysm can be different in various people, and their geometry can affect the hemodynamics of the blood flow. So, one of the most important factors in determining flow parameters through the COW and intra-aneurysm is to exert realistic and patient-specific geometry. In the present study, patient-specific geometries of the COW with an aneurysm were studied for two cases. The study protocol was approved by the Ethical Committee of Emam Reza Hospital, Tabriz, Iran. The original Computer Tomography (CT) data in DICOM format was prepared from Iran Imaging Center, Tabriz, Iran. Two-dimensional images of head and neck were generated by a Siemens/Sensation 64 CT Scanner. Thick slices and resolution of images are 1 mm and 512 × 512 pixels. Geometries of COW and site of aneurysms in these circles are different. The first patient (case A) is a 10 year-old male with an aneurysm sized 29 × 30 mm located in the Basilar artery. This COW misses Posterior Communicating Arteries (PCoA) located on both sides. The second one (case B) is a 70 year-old male with a 7 × 6.9 mm size aneurysm located in the left Middle Cerebral Artery (MCA) as shown in Fig. 2.
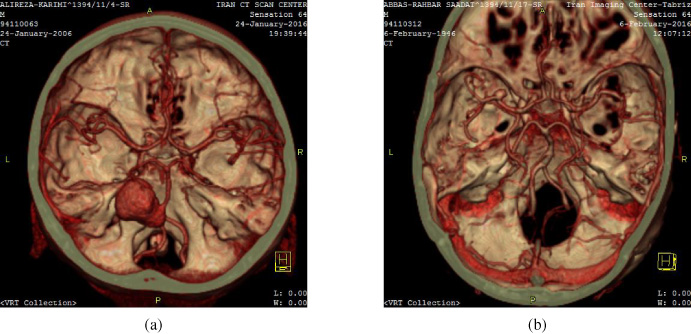
Angiography images of the Circle of Willis; (a) case A, (b) case B.
The CT images of each patient were imported to the Materialise Mimics software in order to extract a realistic and anatomical CAD model. In Mimics, the threshold of vascular tissue was identified, and cerebral arteries were separated from other tissues such as the skull, muscles, skin and other arteries. Finally, the 3D model of the geometry of COW as cloud points related to the fluid part (blood) was created for each case. Required wall thickness for generating the arterial wall part was obtained from Mimics. Data were compared with anatomical studies for validation of arterial wall thickness obtained from Mimics (Table 1).
Wall thickness of cerebral arteries
After preparation of the anatomical model, files with STL format were imported to the Materialise 3-Matic software. Because of the small difference between the thicknesses of various vessels, the thickness of the arterial wall was applied 0.4 mm for all the arteries and the aneurysm part. The process of converting cloud points to an exact surface for both fluid and wall region was performed by the GEOMAGIC-STUDIO software as shown in Fig. 3. Then for one-way FSI, models with IGES format were transferred to the ANSYS.CFX software (the reason for creating an FSI model is to study the blood flow hemodynamic and its effect on the wall, which result was reported in another paper).
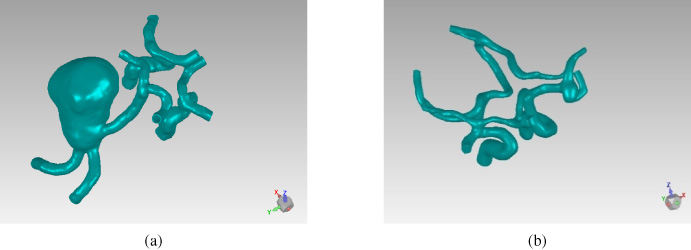
Construction of 3D geometry of COW in Geomagic-Studio; (a) case A, (b) case B.
The purpose of this research is to study the correspondence between CFD and TCD. Therefore, the Doppler ultrasound test was done to obtain a pulsatile velocity profile in the cerebral arteries of the COW. These velocities were measured in Emam Reza Hospital, Tabriz, Iran, for each patient.
The FSI models were solved by ANSYS.CFX. The Finite Volume Method (FVM) was used for the fluid governing equations, and the Finite Element Method (FEM) was used for the solid parts. Both of these methods alongside coupling conditions were solved by Arbitrary Lagrangian-Eulerian (ALE) which is widely used for blood flow simulation [19].
In cerebral arteries, the fluid was considered incompressible, and the flow was considered laminar as described as:
The structure of the arterial wall was considered isotropic, homogenous and elastic properties with passion’s ratio of 0.45. The elastic modulus is 1 MPa for case A and 5 MPa for case B [21,23]. Different elastic modulus was considered because of the patient’s age. The density of the wall was assumed to be 1050 kg/m3. The governing equation can be described as:
It is important to investigate hemodynamic parameters in conditions close to reality. Thus, patient-specific boundary conditions were used. Case A has four inlets and six outlets and case B has three inlets and seven outlets. For inlet boundaries, patient-specific pulsatile velocity was applied. As mentioned earlier, these blood velocities were measured by TCD (Fig. 4). Outlet boundaries were imposed by capillary pressure of about 17 mmHg [25]. Because of the limitation of blood pressure measurement, lack of access to hemodynamic information and with regard to the transfer of blood flow from the COW arteries to the capillary, this amount was considered for outlets. Initial condition for velocity and pressure was zero.
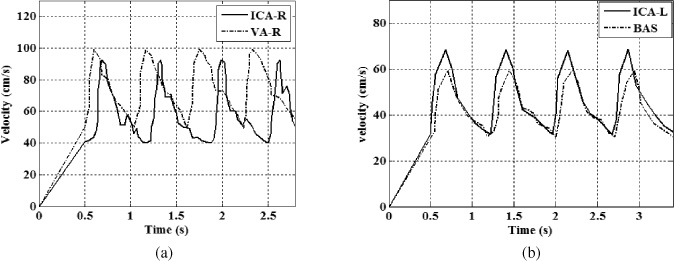
Velocity profile obtained from TCD through two of the inlets; (a) case A, (b) case B.
In the arterial wall, the inlet and outlet cross-section surface were fixed. FSI boundary conditions were imposed on the internal wall in connection with blood flow.
Unstructured grids with 3D tetrahedral elements and 10 nodes were imposed for both the fluid and solid domains. Also for the fluid domain, prismatic elements were used in the boundary layer with 0.2 mm a thickness and 5 layers. Computational quality of mesh and skewness were appropriate and approximately 0.81 and 0.27, respectively. For the integration of this time-depended problem, the implicit Euler method was used with a time step of 0.01 s. Four cycles of time were simulated, and the result was extracted from the third cycle.
In the CFD method, the cross-section of vessels used for gaining average velocity in one cycle was approximately near to the positions accomplished by the TCD test.
For case A, the Doppler test was done after treatment. This aneurysm was treated with the endovascular coiling method. In this COW, there was no communication between the anterior and posterior region. Therefore, the hemodynamics of the anterior segment did not change before and after the treatment (an aneurysm is located in the posterior of the circle). The computational fluid dynamics were solved for the COW with an aneurysm before the treatment.
As shown in Fig. 5, blood velocity of one cycle in case A was compared between CFD and TCD. This result is related to the vessels of the anterior region of the COW. As seen in Fig. 5, accordance varies per artery. The difference in the left Anterior Cerebral Artery (ACA-L) in the peak of the diagram (maximum velocity) is over 80 cm/s. Also, the difference of velocity observed on the opposite side artery (ACA-R) is 40 cm/s. Since ACA is located in the middle part of the skull and away from the surface of the skull, the possibility of errors increases.
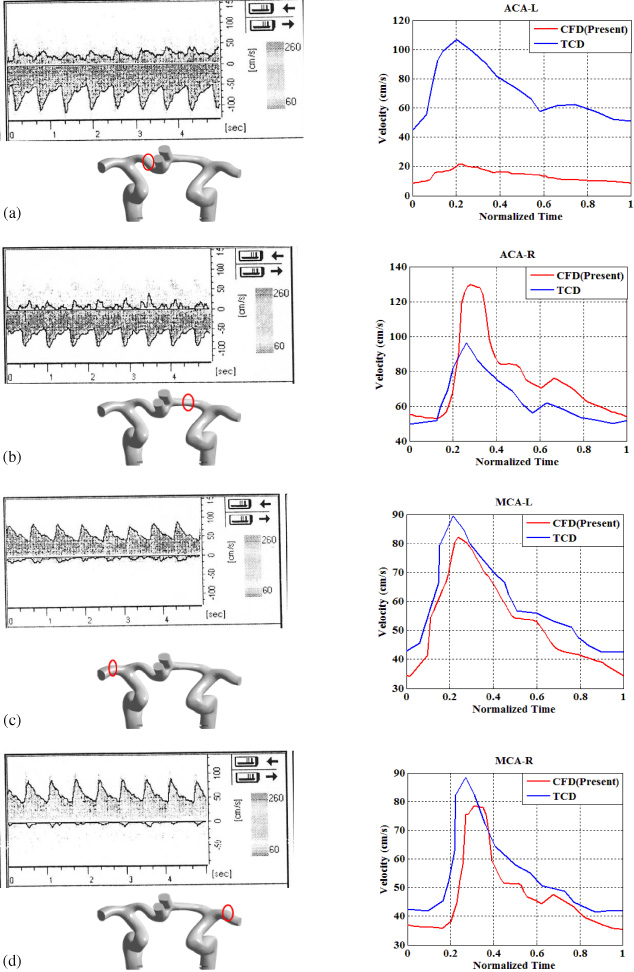
Comparison of velocity profile obtained from TCD and CFD at the (a) ACA-L, (b) ACA-R, (c) MCA-L, (d) MCA-R for case A.
In Fig. 6, accordance of blood velocity between the two methods are shown for case B. Different accordance is noticed for various vessels. The difference of velocity between CFD and TCD is 10 cm/s for the anterior and the middle region, and is 20 cm/s for the posterior region. The peak of the velocity of the TCD method is more than CFD for the right Middle Cerebral Artery (MCA). Its difference is about 40 cm/s.
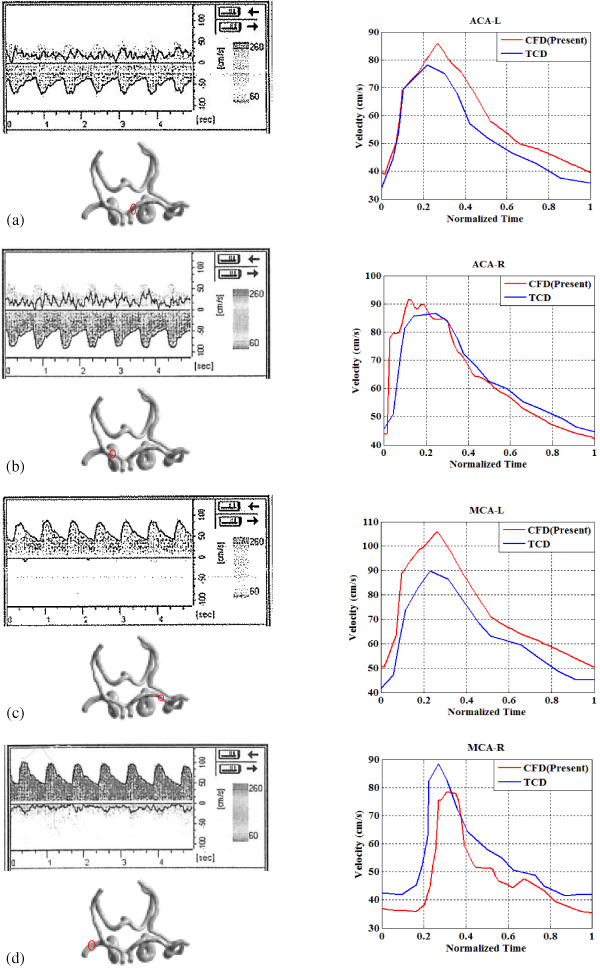
Comparison of velocity profile obtained from TCD and CFD at the (a) ACA-L, (b) ACA-R, (c) MCA-L, (d) MCA-R for case B.
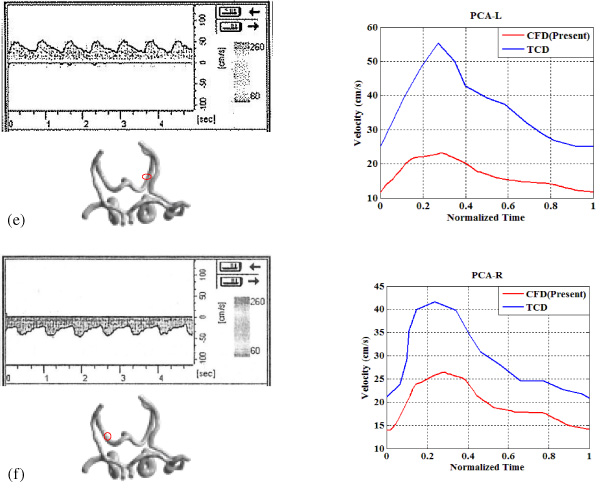
(e) PCA-L, and (f) PCA-R for case B.
As previously mentioned, for case A, the Doppler test was done after the treatment of the aneurysm. In the posterior region of this COW, comparison of the clinical method and numerical method was done to investigate the hemodynamic changes before and after the treatment in order to assess the effect of the aneurysm (Fig. 8). It should be noted that the comparison between results of the two methods was done in the basilar artery. This artery is located near the Trans-Foraminal Window and is almost a straight artery. Therefore, it is expected to have the least error of the Doppler test.

Comparison of velocity profile at Basilar artery of case A before and after treatment of aneurysm.
The differences between the velocity values based on two methods at a normalized time and at the maximum value are reported by error relative percentages. These errors were calculated using the following equation:
The relative errors between the computed and measured velocities in different arteries of Circle of Willis
The Doppler test is a common method for measuring hemodynamic parameters in vessels. Based on clinical observation, the result of this method is often contradicted with in-vivo results. On the other hand, it is not justified because of the critical situation, especially in the COW. Also, computational fluid dynamics do not give complete and accurate information from in-vivo conditions, but it is possible to obtain reliable information through correct and close to in-vivo conditions simulations.
In this study, with simulation close to reality, blood velocity in all the vessels of COW was compared with velocity acquired from TCD.
Comparison of the results of the two cases shows that in arteries which are near the surface of the skull with slight inflection, the measurement error of the TCD method is minimal. In fact, the accordance between the clinical method and the numerical method is appropriate. But in the vessels which place in the middle region of the skull, the difference is high. The errors of the TCD method that was noted, may be the cause of these differences. The existence of these errors can lead to wrong estimations and affect the treatment planning.
In Fig. 8 it is indicated that pretreatment blood velocity and thereby its flow rate is extremely low. This flow rate in the pathological conditions can affect the blood supply to the posterior region. On the other hand, In this case, because of the lack of communication between the posterior and anterior region, there is no possibility of compensation for lack of blood supply by the anterior part. In a similar situation in the complete COW, the risk of ischemia can be reduced by supplying blood from the anterior region by the Posterior Communication Arteries. Thus, the distribution of blood flow to the specific structure of the circle can influence the risk of stroke.
Three-dimensional simulation of two different anatomies of cerebral arteries with an aneurysm were performed to assess the compliance between CFD result and the experimental data of Doppler. Compliance of the measured velocities by CFD and TCD were different in various arteries. Especially, the difference was remarkable in arteries that place away from the skull surface. Thus, according to the results, there are possibilities of errors in carrying out a Doppler test in some arteries and can lead to wrong estimates and ultimately incorrect decisions. Assessment of hemodynamic changes in the aneurysm of case A before and after the treatment indicated that blood flow hemodynamic due to aneurysm size can be greatly affected. Reducing the flow rate and lack of flow in major vessels increases the risk of stroke. Remarkably, all the conditions are dependent on the geometry of the COW and the aneurysm and might vary from person to person.
It should be considered that in this study, elastic wall of vessels has been assumed, and one-way FSI has been solved. Whenever the movement of the wall could be one of the effective factors on blood flow. So, for the modeling to be realistic, two-way FSI modeling with appropriate mechanical properties of the arterial wall should be employed.
Future investigations and comparisons of hemodynamic parameters between the two methods should involve a study for more patient-specific cases to obtain more data for reliable and comprehensive processing.
Footnotes
Acknowledgements
We thank Dr. Nader Ghalichi and Ms. Amini, Iran Imaging Center, Tabriz, Iran, for providing CT images of the Circle of Willis. This work has been supported by the High-performance Computing Research Center (HPCRC), Amir Kabir University of Technology under Contract No ISI-DCE-DOD-Cloud-900808-1700.