
Abstract
BACKGROUND:
The left coronary artery commonly known as LCA gets divided into two branches, such as the left circumflex (LCX) and left anterior descending (LAD) at a particular angle. This angle is varies from person to person. The present computational study contributes remarkable expertise about the influence of this angle variation on the hemodynamic parameters in the presence of 80% area stenosis at the LAD branch.
OBJECTIVE:
This study aimed to compare the effect of the bifurcation angle on hemodynamic parameters in the left coronary artery with 80% stenosis.
METHOD:
Computational models of left coronary bifurcation angles of 30°, 60°, 90°, 120° were developed to understand the flow behavior of left coronary artery branches. The 80% area stenosis (AS) is considered at the LAD branch immediate to bifurcation.
RESULTS:
Measurements of pressure, velocity and wall shear stress were carried out corresponding to various bifurcation angles. It was found that the drop-in pressure increases as the angle increases from narrow to wider. A slight elevation in the velocity at the stenosis was observed. In addition, the obtained results further reveal a recirculation region immediately after the plaque, which leads to more deposition of plaque in the flow obstructed area. It is known that the shear stress at the arterial wall across the stenosis increases as the angle of bifurcation increases from narrow to wider.
CONCLUSIONS:
The bifurcation of the left coronary artery and size of the stenosis have a notable impact on the pressure and wall shear stress. These two factors should be given due consideration by cardiologists to assess the complexity of stenosis in the LCA branches.
Introduction
As is known among researchers, the most life-threatening coronary artery disease (CAD) across the globe is atherosclerosis. Atherosclerotic stenosis caused by the deposition of low-density lipoprotein and other lipid-bearing materials on the inner wall of coronary arteries. The stenosis frequently occurs at the bifurcation zone and inner curvature of the arteries [1–3]. The direct correlation between the growth of the plaque and blood flow parameters such as wall shear stress, pressure and flow patterns were reported by many studies [4,5]. Much work has been done across the globe in the past few years by using computational fluid dynamics and numerous clinical experiments on hemodynamic behaviour in the arteries to find the reason of development of stenosis. Previous studies have also reported that area stenosis (AS) >50% reasons a significantly reduction in the rate of volumetric blood flow [6]. In patients with coronary diseases, direct visualization of parameters such as reduced wall pressure, low wall shear stress (WSS), and flow recirculation zones are challenging, hence, as an indirect method CFD takes up a significant role to analyze the progression of stenosis in the arteries [7]. It is common medical practice to have coronary angiography or a coronary computed tomography (CCTA) modality, which are non-invasive medical imaging techniques. These techniques are mainly used in diagnosing the coronary artery wall’s anatomical reforms due to the existence of stenosis. Coronary angiography can only evaluate variations in lumen cross-sectional areas [8,9]. However, the disadvantage of these non-invasive medical imaging techniques is that it does not provide full information about the functional significance of stenosis. This is the area where CFD can prove to be handy in predicting the early detection and development of the coronary artery’s stenosis and thus help to understand the progress of plaques in a better way, which is very important in the field of clinical treatment.
To the best of our knowledge, the bifurcation angle in the LCA with 80% AS (area stenosis) at LAD and its associated hemodynamics have not been studied and reported in the literature so far. Geometry of the LCA is highly more complex than the right coronary artery (RCA). Figure 1 shows the origin of a short main stem from the aorta which immediately branched into LAD and LCX [10]. Wide deviations are observed from patient to patient in the size and angle between them. In addition, the relation between coronary angulations and consequent changes in hemodynamics leads to a well-established correlation. In fact, the angle variations between LAD and LCX not only disturb the flow regime but are also susceptible to alter the wall pressure and shear stress. Here, an attempt is made to explore the effect of angulation between the coronary branches on the hemodynamics based on simulated models.
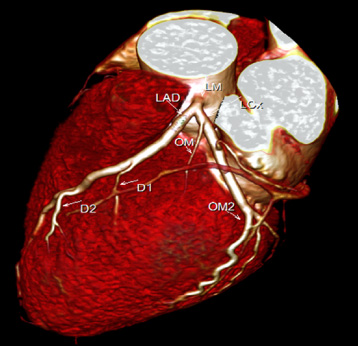
Computed tomography image of the left coronary artery.
The current research is based on four solid models representing 30°, 60°, 90° and 120° bifurcation angles between the divisions of the left coronary artery: LCX and LAD (Fig. 2) [11]. In all four models we considered 80% area stenosis (AS) [12], which is located at the LAD branch immediate to bifurcation. In addition, in order to eliminate the influence of a single geometric factor in all these models, the angle between LMS (left main stem) and LAD is kept at 159°. The unhindered LCX, LAD, and LMS are assumed to have internal diameters of 1.5 mm, 2 mm and 3 mm respectively, as presented in Fig. 3. The geometry proposed by Dash et al. [13] is adopted for the current study and is expressed as follows:
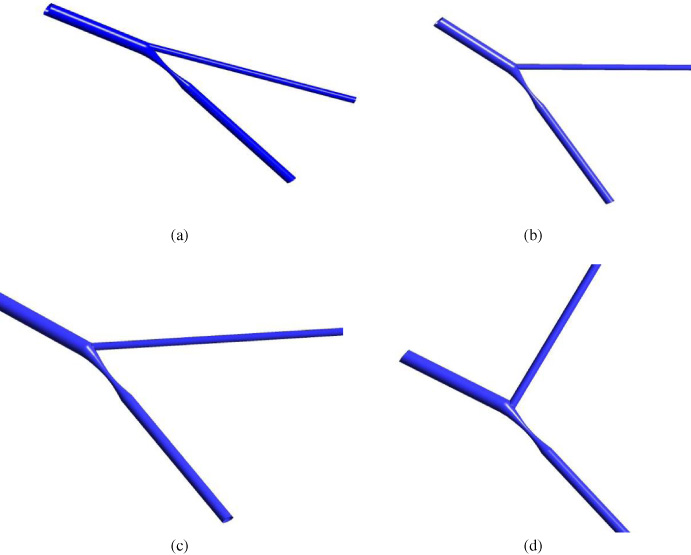
Computational models of various bifurcated arteries with stenosis: (a) 30°, (b) 60°, (c) 90° and (d) 120°.
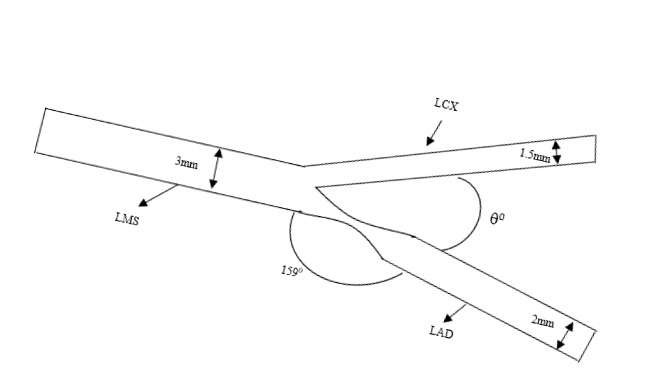
Schematic representation of the bifurcated artery with stenosis.
Blood is assumed as non-Newtonian and incompressible fluid. The governing Navier–Stokes and continuity equations are respectively presented as:
The computational fluid domain is meshed with unstructured hexahedral elements by using ICEM CFD 2020R1 (Ansys, USA). Figure 4 shows the discretized domain with inflation to capture the boundary effect for the 120° bifurcated coronary artery model with 80% AS. The quality and quantity are the most important factors for the accuracy of any numerical simulation. The mesh elements are developed in the range of 250,000 and 500,000 for all four bifurcated models. The grid structure was further refined to carry out the mesh independent study to guarantee that the difference between the calculated velocity values in consecutive stages is much less than 0.3% [20]. Flow simulation is carried out in 640-time steps with 0.005 second per time step. Hence, it represents a pulsatile flow with 4 cycles of 0.8 s each so that each computational time step converges to a residual target value of 1 × 10⁻⁵.

The mesh used in the present numerical study. A bifurcated stenosis artery model with a 120° angle is shown.
It is crucial to make sure that the 3D numerical simulation represents the realistic physiological conditions. Hence, an unsteady parabolic velocity u (t) profile is considered at the entry, as shown in Fig. 5(a) [21–23]. Similarly, to ensure the realistic physiological conditions, an unsteady pulsatile pressure p (t) profile is presumed at the outlet, as shown in Fig. 5(b) [16,24]. The wall surface was enforced so that it did not have the slip boundary condition of the artery by considering it as rigid. This assumption is valid, as cited in [25]. The bifurcated models were solved by considering the similar boundary conditions at the entrance and exit. As the current flow fields are in high Reynolds number regimes, the modelling is convened by using the shear stress transport (SST) turbulence model that belongs to k–𝜔 model to generate the most accurate and robust results [26,27]. The present analysis is carried out in two stages: steady state analysis and unsteady state analysis. The results obtained from the steady state analysis of the flow are the basis for forthcoming CFD simulation. The flow analysis carried out in this study with the CFX software is shown in Fig. 6.

(a) Coronary flow wave form applied at the inlet. (b) Physiological pressures applied at the outlet.

Flow analysis carried out in the current study.
The simulated results obtained for velocity variations, pressure drop, and wall shear stress across stenosis are presented at selected time instances. Figure 7 depicts the variation of the pressure drop along the axial length of LAD at various pulse times for all four bifurcated artery models. It may be clearly perceived that the sudden fall in pressure across the stenosis is at the LAD branch and is maximum at 1.2 s (systole), whereas its minimum is reported at 1.51 s (later diastole). It is also noted that the pressure drops increase as the angle of bifurcation between the LAD and LCX increases from 30° to 120°. The drop-in pressure for 30° and 60° shows no significant difference, whereas for 30° it shows −62.48 mmHg and increases to −70.98 mmHg for 120° for peak systole (1.2 s) of the cardiac cycle. Similarly, for all time periods, the pressure drop is found to increase as the angle of bifurcation increases.

Pressure drop along the axial length LAD for different bifurcation angles in various time steps: (a) 1.05 s, (b) 1.2 s, (c) 1.38 s and (d) 1.51 s.
The variation of axial velocity along the length of LAD is shown in Fig. 8. It was found that the velocity is increased across the stenosis during the cardiac cycle and the pace of increase is gradual as the angle of bifurcation increases from 30° to 120°. As expected, the velocity profile for the peak systole (1.2 s) was higher as compared to the later distal (1.51 s) throughout the whole cardiac cycle in all the four bifurcated artery models. The highest velocity of 4.2 m/s was reported for the 120° angle bifurcated model at the peak systole (1.2 s), whereas the velocity 3.9 m/s was found for the 30° bifurcated artery model. Figure 9 shows the recirculation zone formed near the stenosis. This disturbed flow leads to highly heterogeneous, and often contradictory, behavior of endothelial cells at atheroprone sites. The activation of c-Jun N-terminal kinase 1 is caused by disturbed flow that induces endothelial cell apoptosis.

Velocity variation along the axial length LAD for different bifurcation angles in various time steps: (a) 1.05 s, (b) 1.2 s, (c) 1.38 s and (d) 1.51 s.

Streamline highlighting the recirculation zones for the 60° bifurcation model.
Figure 10 represents the wall shear stress variation along the length of LAD for different bifurcated angular models. A higher wall shear stress value is observed near the stenosis in all models. During the peak systole, the wall shear stress for the 30° bifurcation model is found to be 152 Pa whereas it increases to 166 Pa for the 120° bifurcation model. Similar trends in wall shear stress variation are observed at the stenosis for all other pulse times during the cardiac cycle. It is clearly observed at the stenosis that, as the branching angle between the LAD and LCX increases, the wall shear stress is intensified. Thus, it can be conveniently said that the chances of arterial wall rupture due to stenosis formation are highest in larger angles of bifurcation in the artery.
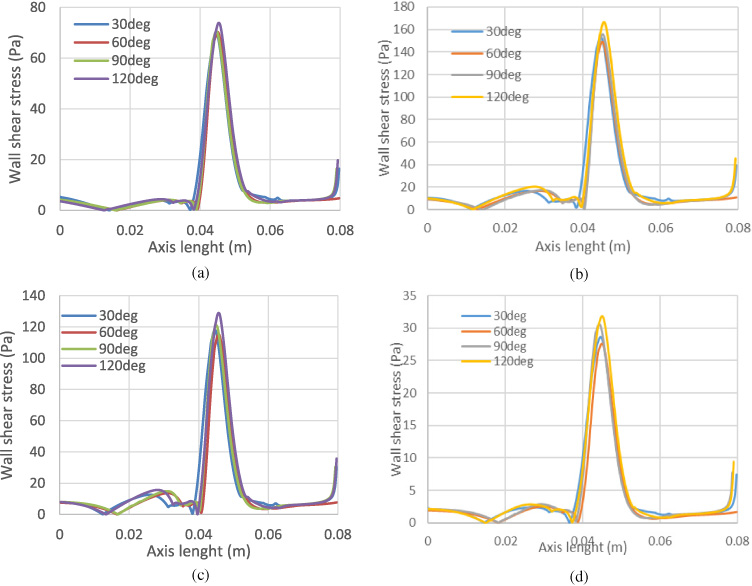
Wall shear stress alongside the axial length LAD for the considered bifurcation angles in various time steps: (a) 1.05 s, (b) 1.2 s, (c) 1.38 s and (d) 1.51 s.
The variations of the bifurcation angle between LCX and LAD of the left coronary artery and its influences on hemodynamics and wall shear stresses are the crux of current computational studies. The results of this study assist in significant predictions with respect to the atherosclerosis development and the consequent rupture of the coronary artery for the different bifurcation angles. As per the findings of the present study, the highest pressure drop was found for 120° (Fig. 7(b)), which further causes an on the spot boom in wall shear stress (Fig. 10(b)) in the vicinity of the stenosis. The highest value of wall shear stress was found at the wider angle model (120°) across the stenosis and is caused by the sudden upsurge in velocity in the neighbourhood of the stenosis; thereby leading to the exacerbation in activation of platelets, the fibrous cap weakens and finally the coronary artery ruptures. A development of low wall shear stress was seen in a recirculation zone in the vicinity of the stenosis [28,29]. The development of the recirculation area was the result of the low-pressure zone. It can be noted that blood flow velocity is very low pertinent to that specific area. The cleansing of low-density lipoprotein and other lipid bearing materials get affected considerably in that specific area due to the insufficient blood flow. It has been found that formation of new stenosis could take place due to the low velocity region post-stenosis. In this context the CFD analysis could be an effective tool in evaluating the functional severity of stenosis so that an appropriate medical therapy can be seriously thought of in the future.
There are a few limitations in the present research that should be properly considered in future works. The assumption of rigidity in the walls of the left coronary artery sometimes leads to the generation of spurious results, hence, the current study does not completely represent its realistic physiological behaviour and movement of the coronary wall during each cardiac cycle. The assumption of the rigid nature of stenosis is valid and reasonable as reported in previous studies.
Conclusion
The current study concentrates on the influences of various bifurcation angles plausible between the LAD and LCX on the blood flow behaviour inside the human artery suffering from stenotic blockage. The study is carried out for four different bifurcation angles of the left coronary artery with 80% stenosis. The current results clearly demonstrate that the pressure drop increased for the wider angle of bifurcation of the coronary artery. It is also observed that the wall shear stress at the stenosis is in direct proportion with the angles of bifurcation. This study provides the hemodynamic in a bifurcated left coronary artery by using CFD tools and may be useful to understand its blood flow behaviour. This study strongly suggests that the angles of bifurcation between the LAD and LCX in LCA is a significant factor when assessing the severity of stenosis.
Conflict of interest
All authors declare that they have no conflict of interest.
Ethical statement
This article does not contain any studies with human participants or animals performed by any of the authors.
Funding
The authors extend their appreciation to the Deanship of Scientific Research at King Khalid University for funding this work through the research groups program under grant number R.G.P.1/132/40.