
Abstract
BACKGROUND:
The blood flow in the human artery has been a subject of sincere interest due to its prime importance linked with human health. The hemodynamic study has revealed an essential aspect of blood flow that eventually proved to be paramount to make a correct decision to treat patients suffering from cardiac disease.
OBJECTIVE:
The current study aims to elucidate the two-way fluid-structure interaction (FSI) analysis of the blood flow and the effect of stenosis on hemodynamic parameters.
METHODS:
A patient-specific 3D model of the left coronary artery was constructed based on computed tomography (CT) images. The blood is assumed to be incompressible, homogenous, and behaves as Non-Newtonian, while the artery is considered as a nonlinear elastic, anisotropic, and incompressible material. Pulsatile flow conditions were applied at the boundary. Two-way coupled FSI modeling approach was used between fluid and solid domain. The hemodynamic parameters such as the pressure, velocity streamline, and wall shear stress were analyzed in the fluid domain and the solid domain deformation.
RESULTS:
The simulated results reveal that pressure drop exists in the vicinity of stenosis and a recirculation region after the stenosis. It was noted that stenosis leads to high wall stress. The results also demonstrate an overestimation of wall shear stress and velocity in the rigid wall CFD model compared to the FSI model.
Introduction
In 2016, the World Health Organization reported an estimation of 17.9 million deaths by cardiovascular diseases, which accounts for almost 31% of the total annual deaths. Atherosclerosis is a chronic coronary artery disease that restricts blood flow to the heart’s muscles. Many studies showed that the hemodynamic forces play a vital role in the variation of morphology and physiology of coronary arteries. Several researchers suggested that the morphology of the artery changes due to the formation of plaque (stenosis), which occurs across the curved and bifurcated sections where the wall shear stresses are very low [1]. The wall of an artery is mainly composed of three different types of layers. The innermost layer is called tunica intima (which is lined by smooth tissue endothelium), tunica media (the muscular middle layer), and the tunica adventitia (outermost layer). The continuous exposure of the luminal surface (tunica intima) and endothelium layer to the blood flow produces the hemodynamic shear forces [2–4]. When these hemodynamic forces are inadequate to maintain the physiological range, it leads to stenosis initiation and progression. Many engineers, clinicians, and mathematical researchers have carried out substantial work on the effect of stenosis severity on the blood flow [5–9]. Despite recent advancements in non-invasive medical image processing such as Magnetic Resonance Imaging (MRI) and coronary computed tomography angiography (CCTA), finding the blood flow pattern remains challenging. The anatomical reconstruction of the coronary artery wall can be determined using these imaging techniques but is limited to find the hemodynamic factors non-invasively.
In contrast, computational fluid dynamics analysis enables recognizing hemodynamic changes and the progression and development of stenosis in the coronary artery. Due to the highly complex structure of the artery wall and limitation in the experimental and computation methods developed, the progression and plaque development are still not clearly understood. Numerous studies related to blood flow patterns and wall shear stress (WSS) have been reported to improve the understanding of the growth of stenosis by using patient-specific medical images [10,11]. These studies show that the accurate reconstruction of the blood domain can be achieved, and the momentum and continuity equations could be solved numerically. The magnitudes of stress and strain inside the artery wall can also be computed by modeling the fluid-structure interaction. The effect of the fluid domain on the wall of structural domain vise-versa can be modeled by two-way fluid-structure interaction [12]. The main goal of the current study is to understand the mechanism of progression and growth of a plaque inside the artery wall and to identify the site of rupture by using the patient-specific left coronary artery.
Methodology
Medical image-based geometrical reconstruction of the left coronary artery model
The left coronary artery of an alleged patient of the male was selected to obtain the computed tomography (CT) images data. The CT scanned images were obtained by using 128-multislice. The standard protocol was adopted to obtain the CT images of the patient. Interval of reconstruction was 0.6 mm and Beam collimation 0.6 with pitch 1.4 along with tube voltage of 100 kV, current oscillating from 300 to 650 mAs.
The images were reconstructed in the axial directions having a slice thickness of 0.6 mm with a total distance of 0.75 mm. The images in all the directions (coronal, sagittal, and axial planes) had more than 400 slices. The collected images are taken in a standard DICOM format, and then a realistic 3D left coronary artery model was rebuilt with the help of CT volume data using image processing software MIMICS-18 [9]. Figure 1 shows the CT scan images and the 3D volume rendering image of the left coronary artery model.

Procedure of a patient’s specific reconstruction of the left coronary artery from the CT scan images.
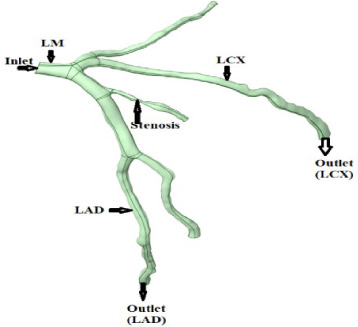
3D blood domain of the left coronary artery.
The CT scan images obtained from the patient with stenosis in the left coronary artery were exported to stl. format via MIMICS 18 software. The reconstruction of the left coronary artery was achieved by defining a series of appropriate thresholds ranging from 84 to 630 HU. The left coronary artery was identified, and the segmentation process was carried out. The detailed segmentation process of left coronary artery models, as shown in Fig. 1, is explained in the literature [11]. The reconstructed 3-dimensional models were imported into ANSYS. As the FSI model consists of fluid and solid domains representing blood and wall, both were generated separately. As shown in Fig. 2, the geometry of the blood domain was used for the CFD analysis as it only represents the blood domain. As shown in Fig. 3, the structural domain was subsequently built with ANSYS space claim software by balancing the fluid domain surfaces shown in Fig. 2. The wall thickness of 0.4 mm was considered for the Left coronary artery. The 3D blood domain and wall models meshed separately (Fig. 4). The dimensions of the left coronary artery model are as shown in Table 1.
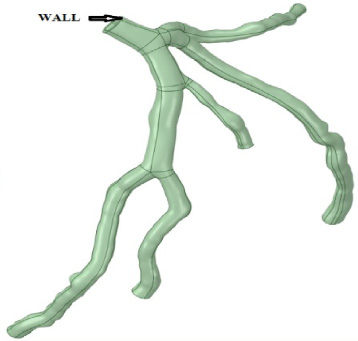
3D structural domain of the left coronary artery.
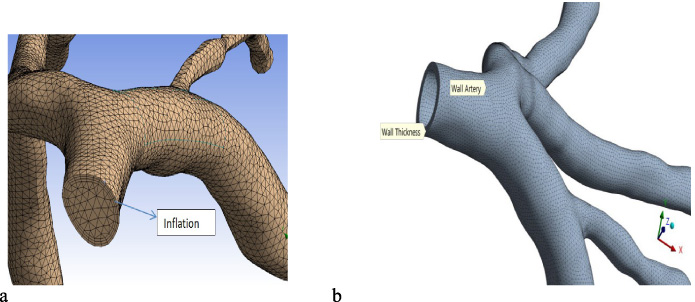
Tetrahedral and uniform mesh for the a) blood domain and b) structural domain.
Dimensions of the reconstructed left coronary artery
An automatic meshing algorithm was selected in the first stage to obtain the discretized fluid domain in ANSYS Meshing. The Tetrahedron mesh method was used in order to get a smooth and uniform mesh. The fluid domain meshed is 869,825 tetrahedral elements and the structural domain with the same elements of 726,563. Thus a total of 1596,388 tetrahedral mesh elements were used in the Fluid-Structure Interaction, as depicted in Figs 4a and 4b. Furthermore, the mesh was refined by adding the inflation layers across the interface between the fluid and structural domains to get more precise results in areas near the artery walls, as shown in Fig. 4a. An independent grid study was also performed, with Fig. 5 representing the detailed grid study.
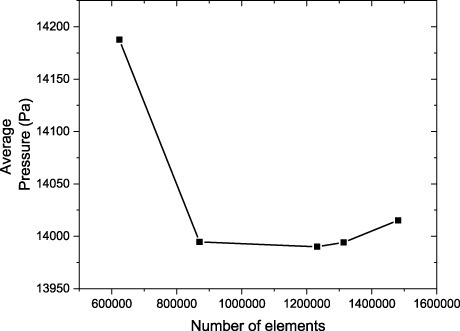
Mesh independent study.
The results of Fig. 5 show a decrease in average pressure from the number of mesh elements 623,279 to 1480,875 in the fluid domain. Moreover, 20% higher elements took about 200% additional time, but the variances in the wall pressure are found to be insignificant. The transient CFD analysis was performed with FLUENT, with a maximum number of 20 iterations. The convergence criteria were accepted when the residuals were below 10e−5. Each simulation was achieved over two cardiac.
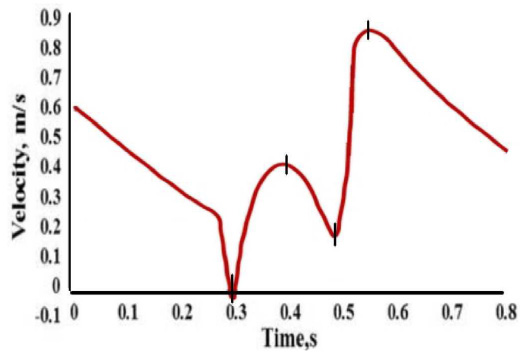
The boundary condition is the essential step of the engineering design system. It is impossible to discretize the entire cardiovascular system if the region or areas analyzed do not have one inlet and one outlet condition. The blood supply to the heart takes place during diastole but not at systolic conditions, and most researchers said that the use of cardiac cycles at inflow and outflow conditions is more important [13,14]. Time-dependent velocity profiles were applied at the inlet (Fig. 6) according to the literature [15,16], and an average pressure of 13,300 [Pa] was applied at the outlets [17]. The inflow and outflow have been imposed with zero displacements for the adjacent faces, relatively to the structural domain. Other boundaries of the structural domain are applied with a condition of free deformation, which permits the structural domain to deform in all directions.
Blood flow in the left coronary artery was considered as homogenous, incompressible, and Non-Newtonian [8,18,19]. Hence, the governing equations are given as:
The above Eq. (1) represents the rise in local density where time is balanced with a divergence of mass flux and Eq. (2) represents the momentum change where time in a fluid particle is equal to the summation of the forces present on it. The fluid-particle forces are taken as viscous and pressure forces, denoted in the RHS (Right Hand Side) of Eq. (2), whereas body forces like gravity have been neglected. As per the previous studies [20,21], the fluid behavior is considered to be Non-Newtonian in vessels; this approximation is followed because of the vessel’s diameters. Typically, these diameters are more prominent when compared with the diameters of individual red blood cells [22,23], making the blood viscosity independent of the shear rate. The shear rate is more significant in coronary arteries, around 100 m/s, and kept a flow system with constant viscosities [24,25].
Figure 7 depicts a systematic fluid structural interaction problem with a solid 𝛺 s and fluid domain 𝛺 f , which are self-governing from each other and interrelate alongside with common shared interface, 𝛤 f, s
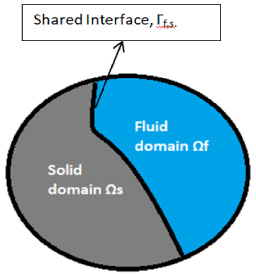
Fluid-structure interaction domains and boundary interface.
Equation ((3)) governs the wall deformation of a vessel:
FSI coupling is performed by the construction of two separate models that comprised the fluid and structural domains. In solving the FSI problems, neither Eulerian nor the Lagrangian formulations are primes to both the domain. The Lagrangian formulation cannot handle large deformations for the fluid, whereas Eulerian formulation compromises accuracy when applied to the solid domain. Generally, the FSI was resolved using a standard Arbitrary Lagrangian-Eulerian (ALE) formulation [26]. The fluid domain is permitted to deform arbitrarily in the ALE method so that its boundaries follow the structural domain deformation [27]. These two methods are combined and used to solve the structural problems by Lagrangian formulation. The coupling of the fluid domain and structural domain was attained by using commercial computational software ANSYS. In this research, the fluid and solid are both coupled in a two-way system and solved iteratively within each specified time step of 0.005. The detailed simulation procedure carried out in the current study is represented in Fig. 8.

Flowchart of two-way FSI simulation.
The FSI problem needs the conservation of mass and momentum along with the interfaces [28]. These values are content by the displacement compatibility and traction equilibrium at 𝛤
f, s
, accordingly to Eqs ((7)) and ((8)):
Similarly, the forces of the fluid and solid on the interfaces is defined as
In the current study, blood was taken as a Non-Newtonian fluid, having density (𝜌
f
) 1050 kg/m3 [21,29]. The Carreau model was used for blood viscosity [20]. The viscosity is given as:
In this study, the mechanical property of the artery fluid and structural domain was given in Table 2. In the current study, the wall of an artery was considered as a linear elastic isotropic material.
The detailed properties of the fluid and structural domains

Comparison between FSI and CFD-computed pressure distribution for coronary artery: a/b early systole (0.3 s), c/d local maximum systole (0.4 s), e/f local minimum systole (0.5 s), and g/h beginning of diastole (0.55 s).

Effect of stenosis on wall pressure in CFD and FSI models
Figure 9 shows the comparison of wall pressure distribution for CFD and FSI models during the entire cardiac flow: a/b, c/d, e/f, and g/h represent the early systole, maximum systole, local minimum systole, and beginning of diastole, respectively. It can be seen clearly from Fig. 9 that the pressure decreases along the direction of flow. The maximum wall pressure of 15180 Pa for a rigid model was observed, whereas 14350 Pa was noted for the FSI model at the minimum systole. The maximum wall pressure across the LAD and LCX bifurcations for the CFD and FSI model are 14780 Pa and 15030 Pa during the beginning of the diastole, respectively. The pressure drops for the minimum systolic condition across the stenosis are 14770 Pa to 13310 Pa and 14350 Pa to 13520 Pa in CFD and FSI models, respectively. The drop in pressure across the stenosis in CFD and FSI model is 14540 Pa to 13320 Pa and 14780 Pa to 13320 Pa during the beginning of the diastole, respectively.
Effect of stenosis on streamline in CFD and FSI models
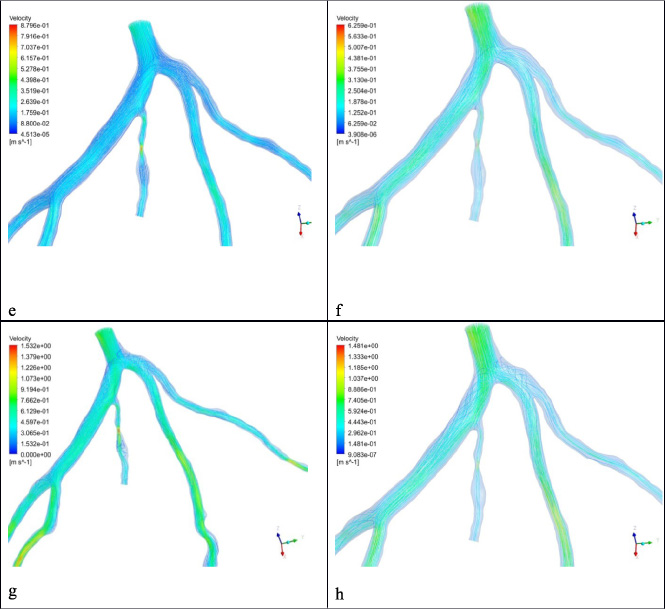
Figure 10 represents the comparison of velocity streamline distribution for CFD and FSI models during the entire cardiac flow: a/b, c/d, e/f and g/h denote the early systole, maximum systole, local minimum systole, and beginning of diastole, respectively. It can be observed that the velocity is higher at the stenosis. The maximum velocity across the stenosis for maximum peak systole is 0.7751 m/s and 0.3972 m/s for CFD and FSI, respectively. It is observed that the difference in the velocity magnitude of CFD and FSI studies is mainly found in the region of stenosis. This is justified by the fact that the artery wall is elastic and enlarges with the fluid’s pressure, thus increasing the lumen size. For the FSI simulation velocity decreases as the cross-section increases.
Similarly, the magnitude of velocity across the stenosis for the maximum diastole is 1.532 m/s and 0.443 m/s for CFD and FSI, respectively. On comparing the FSI results with the CFD, it is found that the overall magnitude of velocity is higher for the CFD model, which is due to the lesser deformations of the wall brought by the fluid. The obtained results of overall velocity for the model are well within the range of the measurements. A robust secondary flow and recirculation zone at bifurcation regions can be determined during the cardiac cycle for both the CFD and FSI models [30], whereas the recirculation region was found at the post stenosis region, which is consistent with the study published [7].

Comparison between FSI and CFD-computed velocity distribution for coronary artery: a/b early systole, c/d maximum systole, e/f local minimum systole, and g/h beginning of diastole.
The wall shear stress (WSS) has great hemodynamics significance, which is very hard to measure directly in vivo. Therefore, computational fluid dynamics provides an alternate way to calculate the WSS in the patient-specific vascular models. It is well known that the low or high area of WSS promotes the progression and development of vascular diseases, including aneurysm, atherosclerosis, and thrombus growth [31]. The endothelial cell layer that presents on the inner surface of the arterial wall is shear-sensitive mechanoreceptors that sense irregular stress and transfer them into biological signals to maintain vascular homeostasis [32]. Figure 11 shows the comparison of wall shear stress distribution for CFD and FSI models at four different time steps of the cardiac cycle: a/b, c/d, e/f, and g/h depict the early systole, maximum systole, local minimum systole, and beginning of diastole, respectively. It can be seen that the low wall shear found at the period of early systole and higher wall shear stress regions were noted at the beginning of diastole during the cardiac cycle. The results also demonstrated high values of WSS magnitude at the stenosis and the apex of the LAD and LCX bifurcation at the beginning of the diastole. This increased in the magnitude of WSS is due to high-speed flow and velocity gradients across the stenosis. A slight increase in the magnitude of the WSS was observed in CFD models as compared with the FSI model.
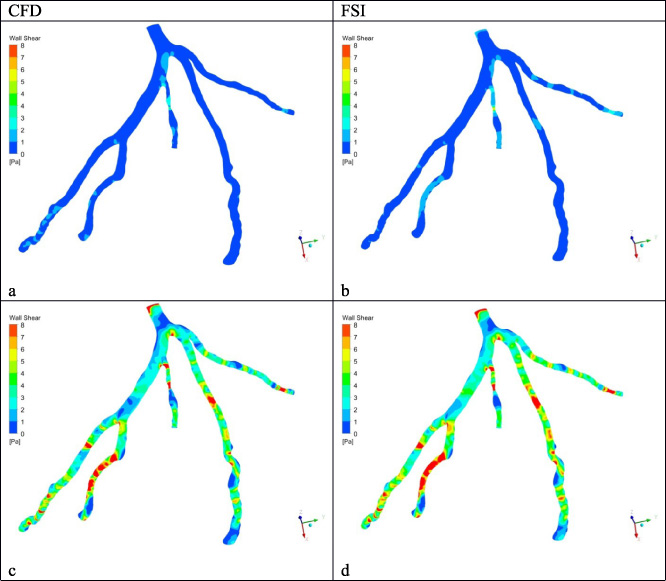
Comparison between CFD and FSI model computed for WSS distribution of the left coronary artery: a/b early systole, c/d maximum systole, e/f local minimum systole, and g/h beginning of diastole.

Figure 12 shows the front and back face side displacement of the FSI model, computed for the selected time during the cardiac cycle: a, c, e, and g represent early systole, maximum systole, local minimum systole, and beginning of diastole, respectively. Figure 12 shows the displacement of the arterial wall contours of the FSI studies for the different cardiac cycles. Displacement changes from 0.0015 mm to 0.012 mm in the left coronary artery. The maximum displacement was noted at the branch of the left anterior descending. The minimum displacement was observed across the stenosis, which is due to lower stress imposed by the flow field to the wall.
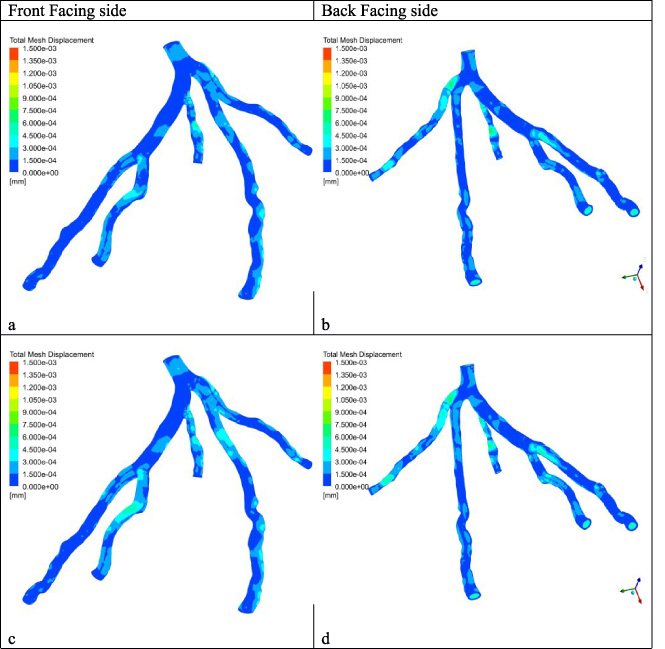
Displacement counters for the carious cardiac cycle: a early systole, c maximum systole, e local minimum systole, and g beginning of diastole.

In this study, the effect of stenosis on the hemodynamic parameters was investigated with CFD and FSI models for a patient-specific left coronary artery. The pressure drop was observed immediately to the stenosis and found the highest drop for the peak systole. Furthermore, a recirculation zone post stenosis was observed, which could lead to the development of low WSS. The recirculation zone is formed due to low pressure. The absence of adequate blood flow hinders the cleaning of adhesives such as cholesterol, fat, or calcification in that specific region. Thus, it could offer a safe zone for the formation of plaque. The current analysis suggests that the post stenosis could lead to the formation of new stenosis due to the low-velocity region. The wall shear stress had good agreement with the previously published results. The increase in wall shear stress was reported at the stenosis location, and a low WSS was noted immediately after the stenosis [8,9,11]. The decrease in WSS augments the creation of reactive oxygen species and increases low-density lipoprotein (LDL) oxidation in the intima layer. The endothelial layer generates the adhesive molecule, such as vascular cell adhesion molecule-1 (VCAM-1) and intracellular adhesion molecule-1 (ICAM-1) by the oxidation process. The platelets were possibly to adhere endothelium layer, where the production of adhesion molecules develops the low WSS region. A slight variation in the instantaneous values of all shear stress was seen in comparing the rigid and FSI models. This can be described by the occurrence of wall deformation, which produces flow and pressure waves which circulate at a finite speed through the arteries, in contrast to the rigid cases which produce instantaneous wave propagation. For example, it is noted that an increase in WSS area in the CFD model at the local minimum systole when the LCX flow is at its minimum (Fig. 11), at which time the CFD wall reacts to the lack of blood supply. In brief, the activation of platelets is related to the increase in the shear stress and harm to endothelial cells; however, the low shear stress is related to the reduction of nitric oxide production and increase endothelin-1 generated by endothelial cells, resulting in the growth of and progression of new stenosis. The results presented in the current study shed some light on the clinical diagnosis of the influence of stenosis on hemodynamic parameters in patient-specific left coronary artery disease, which could lead to the development of atherosclerosis.
Conclusion
The 3D models of the left coronary artery were modeled using CT images, and FSI was performed. The simulation results reveal that the progression and development of atherosclerosis are associated with the harm of the endothelium layer and the hardening of the arteries wall. The velocity and wall shear stress were significantly overestimated in the CFD model as the wall was considered rigid, comparing the CFD and FSI model of the patient-specific left coronary artery with the stenosis. The recirculation region developed immediately after the stenosis creates a low wall shear stress, assisting the stenosis progression. The high wall shear stress developed across the stenosis shoulder leads to the highest risk for stenosis rupture.
Footnotes
Acknowledgement
The authors extend their appreciation to the Deanship of Scientific Research at King Khalid University for funding this work through the research groups program under grant number RGP.1/327/42.
Conflict of interest
None to report.