



Abstract
BACKGROUND:
Coronary arteries disease has been reported as one of the principal roots of deaths worldwide.
OBJECTIVE:
The aim of this study is to analyze the multiphase pulsatile blood flow in the left coronary artery tree with stenosis.
METHODS:
The 3D left coronary artery model was reconstructed using 2D computerized tomography (CT) scan images. The Red Blood Cell (RBC) and varying hemodynamic parameters for single and multiphase blood flow conditions were analyzed.
RESULTS:
Results asserted that the multiphase blood flow modeling has a maximum velocity of 1.017 m/s and1.339 m/s at the stenosed region during the systolic and diastolic phases respectively. The increase in Wall Shear Stress (WSS) observed at the stenosed region during the diastole phase as compared during the systolic phase. It was also observed that the highest Oscillatory Shear Index (OSI) regions are found in the downstream area of stenosis and across the bifurcations. The increase in RBCs velocity from 0.45 m/s to 0.6 m/s across the stenosis was also noticed.
CONCLUSION:
The computational multiphase blood flow analysis improves the understanding and accuracy of the complex flow conditions of blood elements (RBC and Plasma) and provides the progression of the disease development in the coronary arteries. This study helps to enhance the diagnosis of the blocked (stenosed) arteries more precisely compared to the single-phase blood flow modeling.
Keywords
Introduction
Blood is mainly composed of Plasma, Red Blood Cells (RBCs), White Blood Cells (WBC) and suspended platelets. However blood plasma constitutes up to 45–55% of the total blood [1]. The interaction between the blood cells, aggregation and disaggregation of RBCs and their deformation (shear reliant property of viscosity) generally causes the non-Newtonian effect [1,2]. The magnitude of blood viscosity is mainly dependent on the hematocrit of the RBCs present and its variations in the total blood. The complex rheological nature was observed in small sized vessels due to the suspension of cells in the fluid plasma. It has been affirmed by various studies that the blood behaves as Newtonian fluid only in larger sized vessels or arteries [3,4]. But in micro (small) vessels between 20 to 500 mm sizes with a shear rate of approximately 100/s, the blood generally acts as non-Newtonian fluid [5–8]. In order to predict the cardiovascular disease, the shear-thinning rheological function of the blood and the interaction of RBCs with plasma were investigated in previous studies [9–12]. Hence, it is believed that the simulation of blood flow with the multiphase approach is able to predict the distribution of the blood elements better instead of using the blood as a single-phase model. In a recent study, the blood flow in an idealized coronary artery model was studied, and the study concluded that the RBCs move towards and concentrate close to the inward surfaces of arteries where the thickness is higher and the shear pressure is lower [13]. According to several studies, it has been suggested that clinical decisions could be made based on computational analysis [14,15], with real geometry vessels, especially for cardiovascular diseases [16,17]. There is adequate evidence that suggest hemodynamic factors such as pressure, flow rate, flow separation, wall shear stress and RBC hematocrit play a major role in the formation and progression of atherosclerotic (stenosis) plaques and other arterial disorders [13,18–22]. The important entity to explore the hemodynamic of complex fluids is continued by using the mesoscale algorithms and solving the Navier Stokes equations [23–26]. The computational simulation cost of mesoscale methods is usually much greater than other methods such as the Lattice Boltzmann method (LBM), Immersed Boundary Method (IBM) [27], Dissipative Particle Dynamics (DPD) [28] and Moving Particle Semi Implicit method (MPSI). These methods have all been employed to analyze the behavior of blood flow in arteries [29].
On the other hand, the computational fluid dynamics (CFD)-discrete element method (DEM) models and the continuous multi-component Eulerian models have been developed to investigate the blood flow. For the multiphase blood flows, the averaging method and mixture theory approach were considered to study the blood flow [30,31]. A multiphase transient non-Newtonian three-dimensional model for blood by using the averaging method was developed [32] where an idealized curved coronary artery model was simulated with pulsatile hemodynamics. They found that there are RBCs buildups on the inside of the curvature as well as a substantial effect of shear-thinning in the multi-phase non-Newtonian viscosity model than the single-phase non-Newtonian model. The shear-thinning effect is more significant in the multi-phase non-Newtonian viscosity model than the single-phase non-Newtonian model. The distribution of RBCs and the platelets was studied in a sudden expansion channel [33], where a decrease in the RBCs region and platelets enhancement in the flow circulation zone after the sudden expansion was discovered. However, it should also be noted that the study was not conducted on complete realistic coronary arteries. In a similar study of a sudden expansion pipe [34], it was also found that there is an adhesion of platelets immediately after expansion. The numerical simulation of multiphase model based on the Mixture Theory and the shear induced diffusion method was developed normally for ideal geometry [35]. They found that the increase in platelets and decrease in RBCs was found in the flow circulation region. As per the authors’ knowledge, there has been limited research carried out to investigate the pulsatile blood velocity flow by considering the multiphase fluid with patient-specific complete coronary artery branches. Hence, the present investigation has been successfully conducted to evaluate the hemodynamic parameters in a patient-specific complete branches left coronary artery by considering the blood as multiphase of RBC and plasma.
Materials and methods
In the present study, blood is considered as two phases of non-Newtonian fluid in which neutrally buoyant particle RBCs (the secondary phase) are suspended in the plasma (the continuous phase) or in the primary phase. The present study is based on the RBCs suspension flow in a real patient-specific complete branches of the left coronary artery model. As the White Blood Cells (WBCs) are less than 1 per cent, and hence, it can be fairly ignored [32,63].
Governing equations
In this study, the flow is assumed to be laminar, incompressible and of the non-Newtonian type. The RBC and plasma fluid are both modeled as a single continuum fluid. The multiphase mixture theory model was used to solve the constitutive equations based on continuity, momentum and transport equations to accomplish stronger correspondences with the literatures with numerical and experimental results [36,37]. Various studies have featured substantial multiphase mixture theory models method however these studies are based on ideal geometries or else use of a single branch arteries only [13,38,39].
Multiphase CFD blood flow model
The results within the CFD field established the principle in the analysis of multiphase flow observations. Hence, the blood was treated as a multiphase abiotic medium consisting of plasma and RBC, as already specified. The model preserves the volume fraction of all phases equal to one, as shown in Eq. (1).
In Eq. (1), “𝜀” is the volume.
The multiphase mixture theory was used to examine the hemodynamic parameters as this approach is more precise than the Euler–Euler model process, as mentioned in previous studies [40]. The multiphase mixture theory model solves the mixture’s conservation of mass, momentum and energy equations.
The continuity equations for the mixture theory model are given by,
For each phase, k is the ratio of plasma over RBCs so that the momentum equation becomes as follows,
The slip velocity is defined as the velocity of the secondary phase (expressed as p) relative to the velocity of the primary phase (expressed as q), given by Eq. (10),
If 𝜀
RBC
<0.2, then C
D
is represented by the equation below,
The representation of the constitutive model is based on the strain rate tensor
Where “
The viscous fluid constitutive behavior is given according to the equation below;
In the current study, blood was assumed to be two separate portions, and RBC behaves as the non-Newtonian Carreau-model. The detailed rheological properties of blood are given in Table 1. Blood viscosity 𝜇, given in poise (P) as a function of shear rate
The computed tomography (CT) images were picked up as follow; resolution time frame set to 0.6 mm, beam collimation fixed at 0.6 with a pitch of 1.4, and tube voltage maintained at 100 kVp, and the current wavering from 300 to 650 mAs. The picture replication in the critical thickness of the hub positions is at 0.6 mm, with a 0.75 mm of steady separation. In all the postures, the images consisted of more than 400 slices. The collected images were saved in the standard DICOM format configuration as shown in Fig. 1 where (a) shows the three dimensional main left coronary model is modified using a CT volume rendering as prescribed in previous similar studies [43 63], Fig. 1(b) shows the medical imaging process software, the MIMICS and 3-matic Research (Materialize, Belgium) and Fig. 1(c) represents the final reconstructed model for discretization.

(a) Computed tomography (CT) images (posterior and interior). (b) Volume rendering image with location of LCA. (c) 3D model developed for the left coronary artery (LCA) using image processing software, MIMCS.
The reconstructed patient-specific left coronary artery with complete branches model has been shown in Fig. 2a. The model of the coronary artery was saved in the stereolithography (STL) file format. The 3D surface models of the left coronary artery with stenosis were imported into the ANSYS Fluent 2020R1 (ANSYS Inc., USA) for meshing. Initially the automatic meshing algorithm was used to obtain the discretized fluid domain in ANSYS Meshing. The developed tetrahedral mesh model is shown in Fig. 2b. Additionally, the mesh was refined by including the inflation layers across the rigid wall.
The grid independence study has been carried out with five sets of tetrahedral meshes for the blood domain with mesh elements of 623,279, 869,825, 1231,504, 1312,969 and 1480,875. Figure 3 illustrates the grid analysis and shows the average pressure (Pa) at the systolic peak for the different grid sizes. The results show that the average pressure decreases from the number of mesh elements of 623,279, to 1480,875 in the fluid domain. In addition, the 20% increase in mesh elements took approximately 200% more time to simulate the same model, and the variances in the effects of the wall pressure are indicated to be negligible. Hence, we considered the 869825 mesh element models for further analysis which decreases the simulation time without affecting the accuracy of the results.
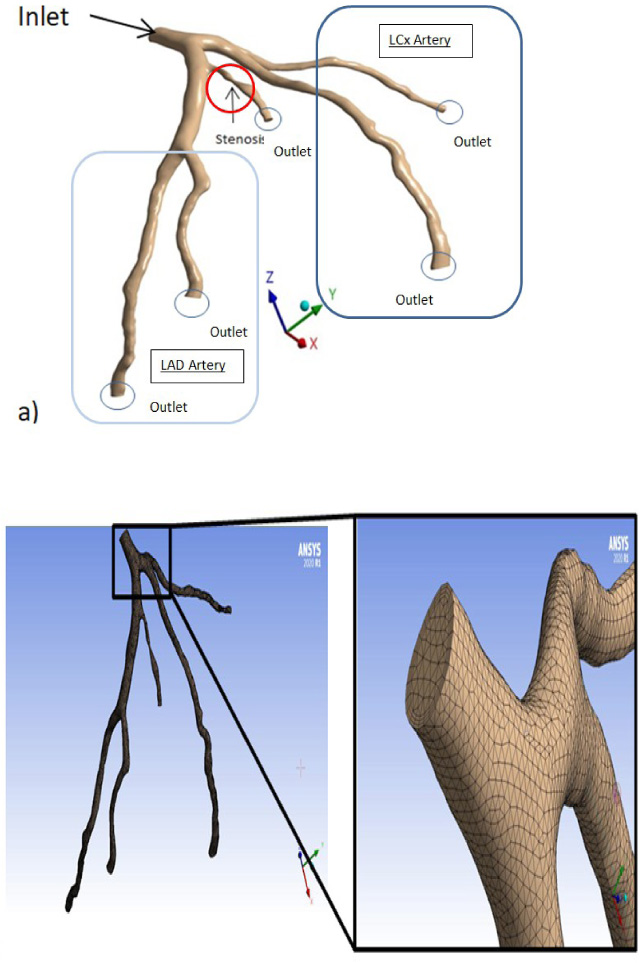
(a) Patient 3D reconstructed left coronary artery model with stenosis and associated branches. (b) Finite volume (FV) based model.
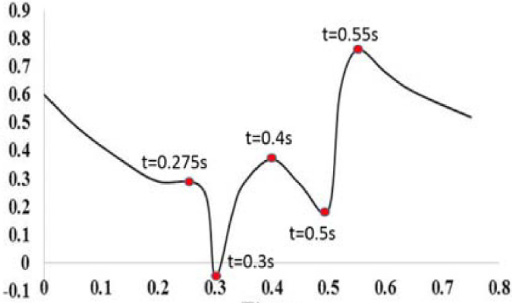
A time dependent numerical simulation using the multiphase (plasma and RBC) blood flow model was performed in this study. The pulsatile inlet velocity waveform was applied for both, the RBC and Plasma, for three cardiac periods. Figure 4a represents the inlet velocity boundary condition applied for the plasma and RBC which was previously applied on the ideal and few small realistic artery models [38,44,45]. The outlet pressure was maintained with 13,300 Pa for all five outlet branches, as marked by the circle in Fig. 2a. No slip boundary condition was applied at the wall boundary of the artery for multiphase flow. The volume fraction (0.45) of RBC was taken with 45% at the inlet and the RBCs particles were assumed to be 8 μm in granular diameter [39].

Mesh independency study for numerous numbers of elements and pressure results shown during the peak systole.
The numerical simulation was performed in the ANSYS FLUENT 2020R1 [ANSYS Inc., Canonsburg PA, USA] multiphase mixture model where it was used to solve the governing equations of blood flow. The numerical simulations were performed with a residual value corresponding to the convergence flow of 10−4. In the analysis setup, a total of 750-time steps with the time step size of 0.005 s were chosen by considering the maximum iterations of 25 for each time-step to complete five cardiac cycles. Solutions were then converged in the second cycle. To ensure the periodicity, the simulations were carried out for five pulsatile cycles for better accuracy in the results.
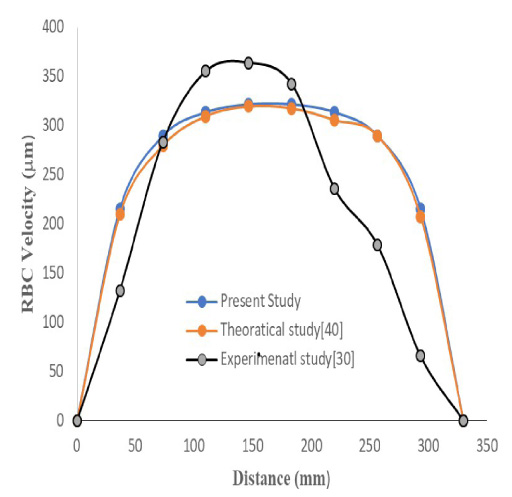
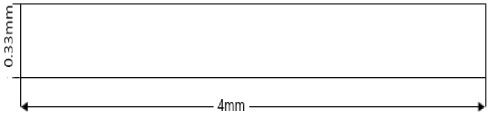

The parabolic RBC velocity profile vs. arterial distance (mm) in Z direction. Note: The artery is a CT scan model and so not present in a single plane like ideal geometrical models hence it is very difficult to consider the specific dimensions along the Y -axis (Fig. 5c).
The validation of model was carried out by initially performing the simulation with a rectangular micro channel of an experimental study and theoretically analysed results [37,47] shown in Fig. 5a. The inlet velocity was given in this case of 0.7 μL/min, and the volume fraction of 0.45 (haematocrit 45%) was assigned to the model.
When compared with the velocity profiles of the theoretical and experimental results by selecting the z-level directions, micro channel dimensions and with flow rates, the results agreed that the multiphase flow behaviour is more accurate than single phase flow behaviours, as mentioned in a previous published study [38]. The curve shifted 3% down in the z direction for experimental results and agree with the present study which is shown in Fig. 5a. The velocity of the RBC along the stream-wise distance (x) as a gathering of the wall in (y) distance at the depth of 16 μm is represented in Fig. 5c. The theoretical results are more accurate compared to the experimental studies in this case. This is due to the effect of the flexibility of RBCs, the walls and the porosity which are ignored, hence the curve is inconsistent to the experimental results [37]. Hence, a multiphase blood flow with the mixture theory model is feasible to apply for blood flow numerical simulations in patient-specific stenosed coronary arteries.
The RBC velocity vs. arterial distance is graphically represented in the X and Y axis respectively for current numerical work. The highest velocity of 0.6 m/s achieved is shown in Fig. 5c. The RBC velocity profile was validated by showing an RBC parabolic velocity profile, comparable to previously published results [37].
Wall shear stress (WSS)
The WSS is the most important parameter in the hemodynamic simulation of blood flow in vessels where the endothelial cells were aligned in the direction of blood flows where these are helped to calculate the wall shear stresses in blood vessels. The expression used to calculate the WSS in blood arteries is given as,
The averaged WSS over the cardiac cycle was used to calculate the shear stress magnitude applied on the artery wall surface during the cardiac cycle.
The magnitude based TAWSS expression is generally expressed as;
OSI is a mechanical factor which is related to the blood flow oscillations in arteries. It displays the values between the time averaged wall shear stress and the TAWSS Vector. The Oscillatory Shear Index (OSI) can also be given as the transient oscillations of low and high averaged shear stresses. The shear vector can be determined from the stress tensor ‘𝜎’ and the normal vector, to the surface ‘n’, i.e.,
Distribution of WSS
It has been shown in numerous studies that the variation in WSS and OSI are strongly associated with the key areas of progression and development of arthrosclerosis [48]. Figure 6 depicts the influence of stenosis on the WSS distributions for the peak systole (0.4 s) and at the beginning of the diastole in a multiphase LCA model. As evident from Fig. 5, the maximum WSS was observed across the stenosis for the peak systole and diastole during the cardiac cycle. The highest WSS ranges from 7 to 8 Pa across the stenosis observed due to the highest reduction in area because of atheroscelorosis presence. The lowest WSS region was found across the bifurcations during the systole, whereas the diastole was shown by arrows for clear views. This is in line with several studies that have shown the growth risk of stenosis to be greater when the endothelial surface or wall of arteries are exposed to the lowest WSS than the biological levels of WSS (<1.5 Pa) according to previous researchers study[49,50]. However, the low WSS area was produced due to the low velocity across the region which increases the potential area for the progression and development of plaques or atheroscelorosis.

Wall shear stresses distribution for LCA (a) (b) multiphase blood flow and (c) (d) single phase blood flow for peak systole (0.4 s) and beginning of diastole (0.55 s), respectively.
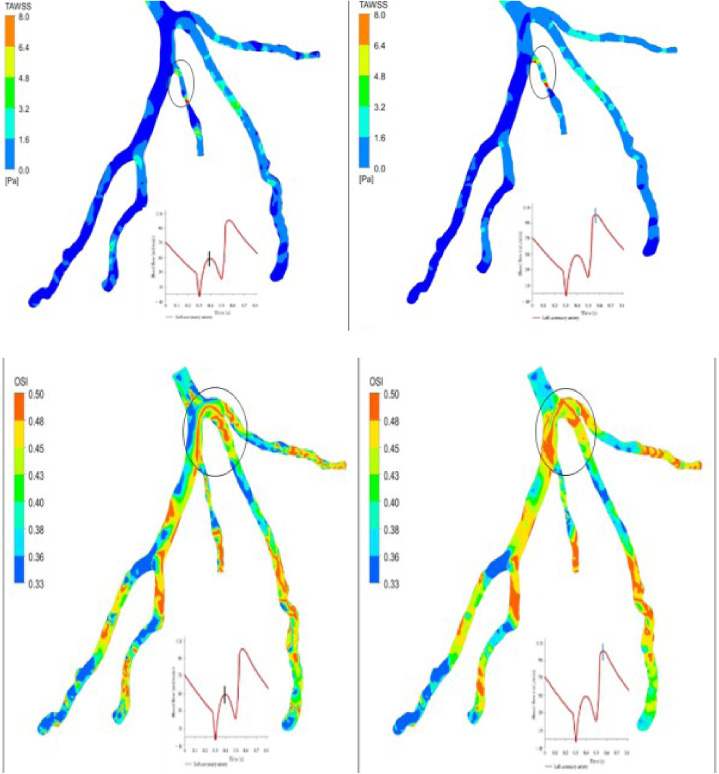
(a) Time averaged wall shear stress (TAWSS) and (b) Oscillatory Shear Index (OSI) for LCA peak systole (0.4 s) and beginning of diastole (0.55 s) for multiphase blood flow only.
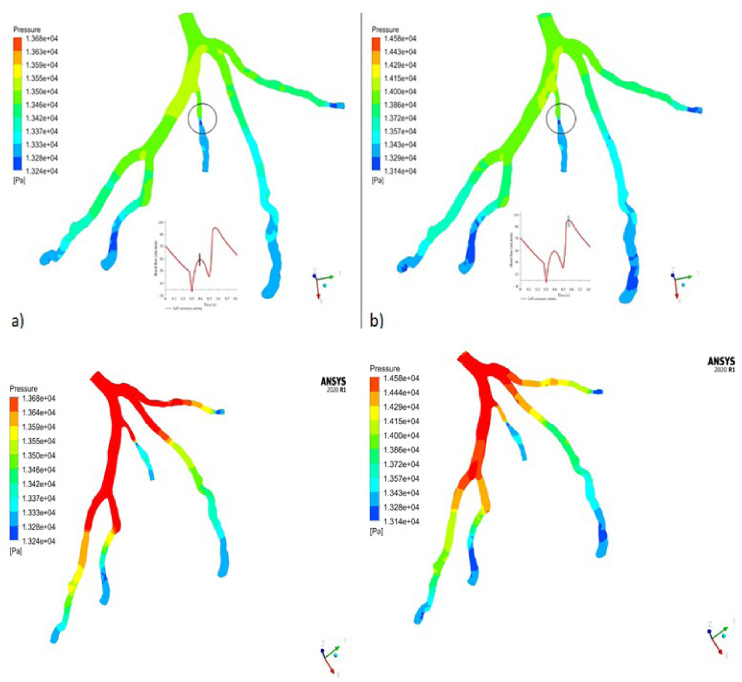
Artery wall pressure (a) (b) for multiphase blood flow and (c) (d) for single phase blood flow for peak systole (0.4 s) and beginning of diastole (0.55 s), respectively.
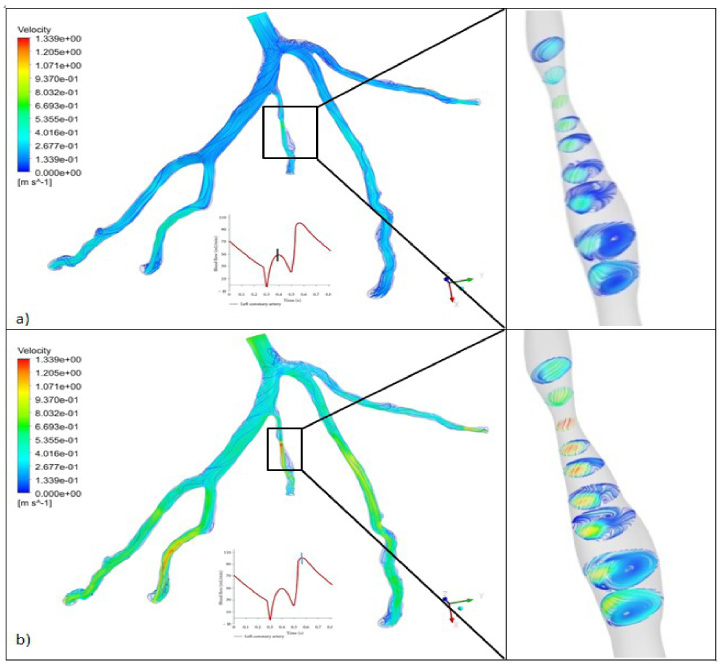
Velocity streamlines focused in stenosed region of LCA for (a) peak systole (0.4 s) and (b) beginning of diastole (0.55 s).
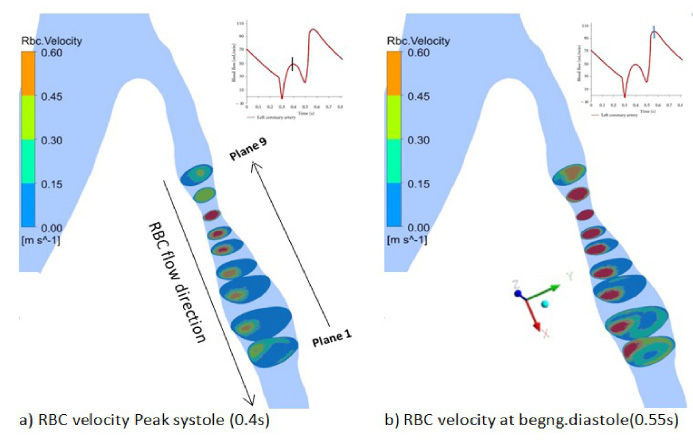
RBC velocity across the stenosis region for LCA: peak systole (0.4 s) and beginning of diastole (0.55 s).
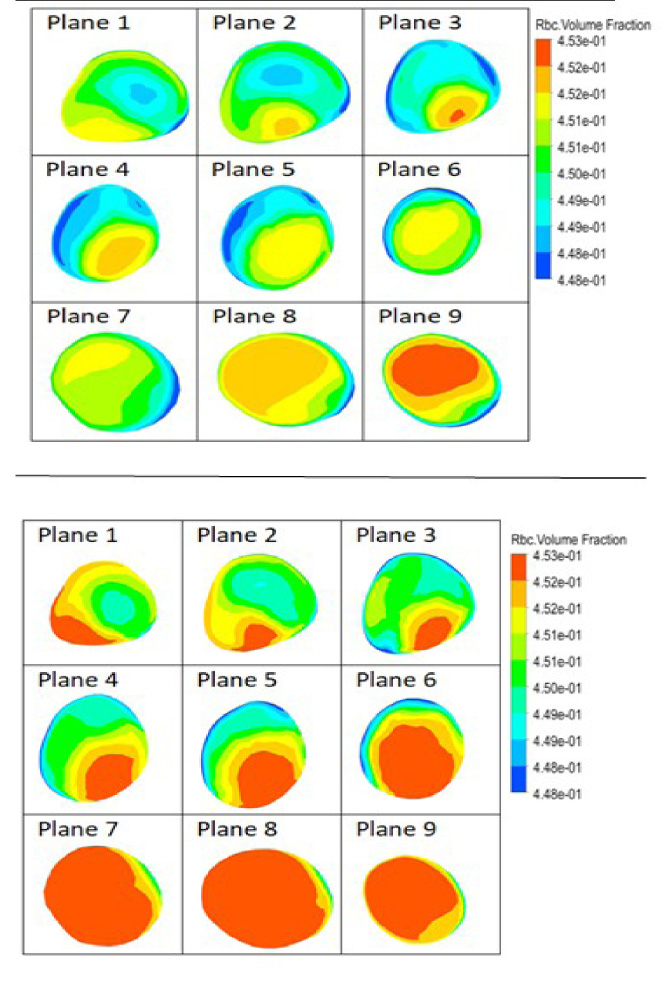
RBC volume fraction on different planes (1–9) at stenosis regions for (a) peak systolic (0.4 s), (b) diastolic (0.55 s).
A significant reduction in velocity was also noted at post stenosis regions.
The variations of TAWSS in the stenosed left coronary artery model for peak systole and diastole are shown in Fig. 7a. The distribution of TAWSS is not identical throughout the entire cardiac cycle. The higher TAWSS areas across the stenosis are shown in the range of 6.4–8 Pa, regions that are clinically important as it could lead to the destruction of the endothelial layers [51]. Low TAWSS was observed at concave region of LCA. The flows within the left coronary artery (LCA) branches are mainly dependent upon the geometry, curvature of the branches and its placement. The low TAWSS areas are correlated with the low velocity which consequently results in the formation of stenosis.
Distribution of OSI
The oscillating shear index (OSI) is a dimensionless hemodynamic parameter that provides a measurement of the oscillating nature of the WSS. Theoretical studies have reported the extreme value of OSI to be 0.5 [52]. It is believed that the endothelial cell forming the lumen interface does not align with the direction of flow at high OSI values, thus increases the risk of vulnerable atherosclerosis and endothelial dysfunction [53–55]. Figure 7b) illustrates the variation of the OSI contours predicted on the patient’s left coronary artery model during the third cardiac cycle. It is observed that the highest OSI values were predicted in the distal and downstream stenosis regions, and across the bifurcations due to low blood velocity at these regions. However, the OSI area was found higher for the diastole (0.55 s) than the peak systole (0.4 s) during the cardiac cycle as this is due to the sudden down flow of velocity during systolic conditions.
Wall pressure distribution
Figure 8 shows the pressure field in the stenosed left coronary artery for the systole (0.4 s) and diastole (0.55 s) during the cardiac cycle. The calculated maximum wall pressure of 13,555 Pa and 14,290 Pa were observed for the systole (0.4 s) and diastole (0.55 s) respectively. The pressure drops across the stenosis of 13,280 Pa and 13,290 Pa during the systole and diastole conditions respectively. The in-vivo measurement pressure drop through the stenosis causes several side effects such as chest pain, palpitations, breath shortness, nausea, headache or lethargy of a patient [6]. To overcome these factors, the pressure values can be non-invasively calculated via computational fluid dynamics (CFD) methods at each point of the artery as discribed in Figure 8. The red color of contor represents the highest wall pressure induced whereas blue color indicates the lower pressure regions. These results also help doctor or surgeons to calculating the length of stent to be installed at the regions where the lowest pressure ends.
Velocity streamlines
The flow velocity of the stenosed left coronary artery during the peak systole (0.4 s) and at the beginning of the diastole (0.55 s) is demonstrated in Fig. 9. It is observed that the maximum velocity was found in the range of 1.017 m/s to 1.339 m/s across the stenosis during the beginning of the diastole. It was also found that the flow velocity was reduced at the LCX and LAD bifurcation regions where the blood particles (platelet particles and blood cells) are prone to be accumulated and solidified to form an embolus. Consequently, these particles travel and consolidate on a lumen surface adjacent to the bifurcation, forming atherosclerotic stenosis, consistent with the results published in previous studies [21]. The recirculation zone immediately after the stenosis was found during the cardiac cycle, also in line with findings from previously published articles [56]. The induced recirculation region is shown in various planes (plane 1–plane 9) across the stenosis and post stenosis regions which gives better and clearer understandings.
RBC velocity and distortion
The nature of blood inside the left coronary artery and distribution of RBC and its velocity are explained in this section.
Figures 10- 11 shows the RBCs velocity at the stenosis region of the left coronary artery during the peak of the systole (0.4 s) and at the beginning of the diastole (0.55 s) during the complete cardiac cycle. Numerous experimental studies [57] have shown that the shape of the RBC variance is due to the transition of flow velocity. Their experimental results on capillary tubes have shown that the RBCs elongate as the velocity increases. The maximum velocity was found at the stenosis region in the range of 0.45 m/s to 0.6 m/s. Figure 10 also depicts the velocity to be highest during diastole conditions as compared to during the systolic conditions of the cardiac cycle. The low velocity of the RBC was noted to be towards the outer walls immediately after the stenosis. However, this type of RBC analysis could not be possible to do in a single phase blood studies. Hence, this present study gives a better and clearer understanding in analysing multiphase hemodynamic studies.
In the present multiphase study it also possible to calculate the concentration of RBC elements which is reported at the stenosis regions for LCA. It is clearly perceived from the cross section planes that the lowest concentration of RBC is at the proximal regions of stenosis where during the beginning of the diastole, it is at a higher rate as compared to during systolic conditions. Hence, the increase of sickle cells (damaged RBCs) deposition rate occurs more during systolic conditions which were not reported previously in any studies. But, In-vitro experimental studies have confirmed that the accumulation of RBCs or higher density RBCs may change the existing pathological responses of the endothelial cells [58,59] which were similar in present study.
Discussion
Our results based on patient-specific left coronary artery models with multiphase mixture theory showed that there is a strong relation between hemodynamic parameters and the progression of stenosis development in systolic and diastolic conditions when it considered all branches of the left coronary artery. The low wall shear stress (Fig. 8) and recirculation regions (Fig. 10) were found immediately after the stenosis in LCA models where these regions are likely to support the development and progression of stenosis. It is alleged that the disturbed flow of blood plays an important role in the alteration of the lumen surface and formation of stenosis In their study of hemodynamics, findings showed that the stenosis frequently occurred in these regions where low WSS was found [60,61]. However, this is confirmed from the present study where a low wall shear stress and recirculation region during post stenosis was noticed in the LAC, making it prone to develop arthrosclerosis as the sickle cycle (the RBC’s diameter reduced and cells do not carry oxygen supply) may start to deposit. A significant drop in pressure was noted across the stenosis, as shown in Fig. 8, consistent with the results published previously [61]. Advanced medical imaging techniques such as the CT (Computed Tomography) angiography and MRI (Magnetic Resonance Imaging) offer detailed anatomy of the coronary modifications. However, they are incapable of delivering hemodynamic variations and the disturbed flow inside the coronary arteries. The hemodynamic changes could be analyzed, and the disease prone regions can also be predictable using the computational fluid dynamic analysis for coronary artery diseases.
This study consisted of a few limitations. The patient specific LCA models with the presence of stenosis were presumed to have rigid walls rather than eleastic properties flexible walls. Hence, the current study does not reflect more realistic situations as in the reality the coronary artery wall is deformed during pulsatile cardiac cycles [62]. Secondly, only one patient’s data was used in this study. Hence, it is well known that studies based on small data may not be applicable to the whole population since the anatomy and physiological conditions may vary from patient to patient. Therefore, a larger number of data is required to increase the generalizability. This article however will be of use to computational analysts and helpful to doctors/surgeons in the continued development of circulatory (cardiovascular) health monitoring with also the continuous collaboration between doctors/surgeons and engineers [43].
Conclusion
The current numerical simulation study was performed to analyze the hemodynamic parameters by use of single and multiphase blood flow models. The hemodynamic parameters were computed only for systolic and diastolic conditions, and then compared with the single-phase flow results with multiphase flow. The results of the present study revealed that the high chances of development of atherosclerosis or plaque is mainly due to the low wall shear stress and disturbed flow across the bifurcation and post stenosis regions. The single-phase blood flow model never predict the actual flow behavior of composition of blood elements (such as RBC and plasma) in the left coronary artery. Hence, the multiphase model has more advantageous and provide more functionalities such as RBC Volume Fractions, RBC Velocity etc. However, a higher RBC velocity and WSS were found at the stenosis region. Whereas, the low WSS across the bifurcations and at the post stenosis regions were observed which enhances biological factors like the further deposition of low-density lipoprotein and lipid elements. The results of the present study may improve the clear and better understanding of the wall distortion by exploring the effect of stenosis on the coronary artery by considering the RBCs and plasma mixtures in blood flow. The current study is more realistic than previously conducted researches such as the ideal models study or use of single-phase blood models. So, finally this study could be helpful to doctors/surgeons to evaluate the Coronary Artery Disease (CAD) without the use of invasive techniques.
Footnotes
Acknowledgements
The authors extend their appreciation to the Deanship of Scientific Research at King Khalid University for funding this work through the Large Groups Project under grant no. RGP. 2/63/43.
Conflict of interest
The authors have no conflict of interest to report.