
Abstract
BACKGROUND:
Assessment of three-dimensional (3D) femorotibial alignment is essential for successful knee osteoarthritis treatment in the elderly. The complex morphology of the posterior tibial slope (PTS) might have an influence on sagittal and rotational alignment and the positional relationship between the femur and tibia in the anterior–posterior (AP) direction under weight-bearing conditions.
OBJECTIVE:
This study aimed to clarify the association between the PTS and 3D femorotibial alignment under weight-bearing conditions in healthy Japanese elderly individuals.
METHODS:
We investigated the 3D femorotibial alignment of 110 lower extremities of 55 healthy individuals (26 women, 29 men, mean age: 70 ± 6 years). Using our previously reported 3D-to-2D image registration technique, we evaluated the 3D hip-knee-ankle angle (3DHKA) in the sagittal plane, rotational alignment, and the distance between the femoral and tibial origins in the AP direction (tibial AP position) as femorotibial alignment parameters under weight-bearing conditions. We assessed the medial and lateral PTS and their angular difference (PTS difference) as PTS parameters. Stepwise multiple linear regression analysis was performed using PTS parameters and other possible confounders (age, sex, height, and weight) as the independent variables and femorotibial alignment parameters as the dependent variable.
RESULTS:
Weight (𝛽 = 0.393, p < 0.001) and lateral PTS (𝛽 = 0.298, p < 0.001) were the predictors associated with 3DHKA in the sagittal plane. Lateral PTS (𝛽 = 0.304, p = 0.001) was the only predictor associated with the tibial AP position. Sex (𝛽 = −0.282, p = 0.002) and PTS difference (𝛽 = −0.231, p = 0.012) were associated with rotational alignment.
CONCLUSIONS:
We found that a steeper lateral PTS resulted in a more flexed knee and anterior tibia. The PTS difference was positively correlated with tibial external rotation. Our data could be used as the standard reference for realignment surgery to ensure PTS is appropriately maintained.
Introduction
Detailed understanding of the three-dimensional (3D) femorotibial (FT) alignment including coronal, sagittal, and rotational alignment in healthy subjects is necessary to plan for the successful treatment of elderly knee osteoarthritis (OA) [1–3]. Coronal FT alignment is an important determinant of success following realignment surgery of the knee [4,5], such as total knee arthroplasty (TKA) and high tibial osteotomy (HTO). A flexion contracture or recurvatum as sagittal FT malalignment after TKA or HTO are associated with poorer postoperative results [6,7]. Rotational FT malalignment after TKA is typically caused by component malrotation [8], which leads to instability, painful knee and patellofemoral maltracking [9,10]. Therefore, each FT alignment measure has a targeted optimal range, and the assessment of 3D FT alignment in healthy subjects could provide reference data for realignment surgery of the knee. The importance of obtaining full-length, standing weight-bearing two-dimensional (2D) radiographs in assessing FT alignment has previously been emphasized [11]. However, the projection of the 2D radiographs is influenced by the leg position relative to the radiation source, and rotational alignment cannot be assessed on 2D radiographs. Few studies have focused on 3D FT alignment under weight-bearing conditions [3,4].
Morphologies of the articular surface of the knee joint may affect 3D FT alignment during weight-bearing. The posterior tibial slope (PTS) is three-dimensionally complex and asymmetrical [12]. There is an angular difference between the medial and lateral PTS (PTS difference) [12–17]. PTS plays an important role in controlling the biomechanical behavior of the knee joint, such as range of motion, resting position of the joint, and anterior tibial translation under weight-bearing conditions [18–21]. According to a clinical case report, excessively steep PTS after high tibial osteotomy (HTO) induced flexion contracture of the knee [7]. Given the importance of PTS on sagittal plane biomechanics of the knee, PTS may especially influence extension–flexion or sagittal alignment and the tibial position relative to the femur in the anterior–posterior (AP) direction. Furthermore, the asymmetric morphologies may influence the rotational alignment under weight-bearing conditions. Thus, PTS is one of the few parameters significantly changed by realignment surgery of the knee, such as TKA and HTO. Therefore, it is clinically important to assess the influence of PTS on 3D FT alignment.
A 3D FT alignment assessment system using biplanar long-leg radiography and a 3D-to-2D image registration technique was developed [2,8,22–24]. This system can automatically evaluate (1) 3D-FT alignment (coronal, sagittal, and rotational alignment), (2) the distance between the femoral and tibial origins in the AP direction (tibial AP position) under weight-bearing conditions, and (3) bony morphologies, all with a high accuracy in 3D space.
We hypothesized that PTS would have a correlation with sagittal alignment, the tibial AP position, and the rotational alignment under weight-bearing conditions. Specifically, we expect that the steeper the PTS, the higher the knee flexion and the greater the anterior tibial position. Further, we expect that the larger the PTS difference, the more the femur will be externally or internally rotated to the steeper side of the PTS. Given that one previous study showed that sex and body constitution were associated with 3D FT alignment [24], we investigated how the PTS is associated with 3D FT alignment with age, sex, height, and weight as potential confounders. The objectives of our study were as follows: (1) to assess the 3D-FT alignment and medial and lateral PTS of healthy Japanese elderly participants under weight-bearing conditions, and (2) to clarify the correlation and association, including potential confounders, between the sagittal alignment and PTS, the tibial AP position and PTS, and the rotational alignment and PTS difference.
Methods
Participants
This study was conducted in accordance with the protocol approved by the investigational review board of our institution (ID number 201501). All participants were volunteers generally in good health, aged 60 years and older, and provided informed consent prior to study participation. The exclusion criteria were as follows: patients with a history of trauma, surgery, radiographic abnormalities or symptoms in either of the knees or lower extremities, inflammatory arthritis, neuromuscular disorders, and congenital anomalies, and those having difficulty standing or walking independently. Initially, 62 Japanese elderly who did not have any complaints about their lower extremities were prospectively selected among the general population (Fig. 1). One of the authors assessed their general and lower extremity conditions through physical and radiographic examinations and excluded 7 participants who were assessed as having abnormalities (Fig. 1). Finally, 110 lower extremities of 55 healthy Japanese elderly (26 women, 29 men) were analyzed in this study (Fig. 1). The participants’ average age and body mass index (BMI) were 70 years (range, 60–83 years) and 21.6 kg/m2 (range, 17.1–27.0 kg/m2), respectively.
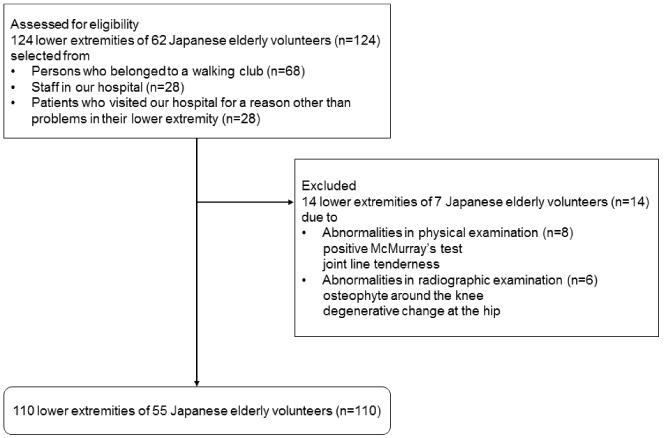
Flowchart showing subjects from eligibility to inclusion in the present study.
Computed tomography (CT) scans of the lower extremities of each participant lying in the supine position were captured with 1-mm slice intervals and slice thickness using Canon Aquilion 64 CT (Canon Medical Systems, Otawara, Japan). The parameters of the scan included a tube voltage of 120 kVp, a tube current of 50–300 mA, rotation time of 0.5 s, beam width of 64 × 0.5 mm, and pitch factor of 0.844. Effective dose (ED) of each participant was computed using web-based CT dosimetry system, WAZA-ARI [25]. The mean ED of men and women were 8.46 ± 1.29 mSv and 8.02 ± 1.78 mSv, respectively. A 3D digital bone model of the femur and tibia of each limb was constructed using CT data and visualization and modeling software (ZedView®; LEXI, Tokyo, Japan). The anatomical coordinate systems were set in each bone model using 3D model digitizing software (ModelViewer®; LEXI), using anatomical points to provide the reference axes. The femoral and tibial coordinate system was defined in a previously reported method (Fig. 2) [3,8,22–24].
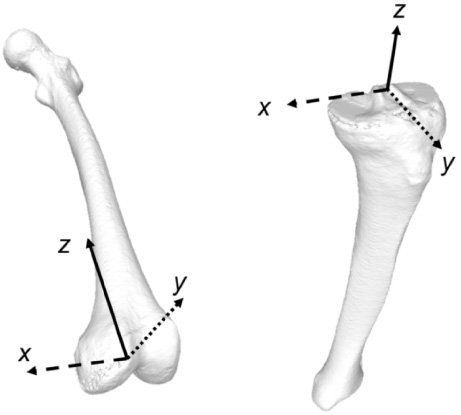
Schematic illustration of the femoral and tibial coordinate system.
Biplane computed radiography (CR) images of the lower extremities with 2.58 mGy of radiation exposure were captured under a weight-bearing standing position, with the knee fully extended and the toes in the neutral position, using the 3D lower extremity alignment assessment system (KneeCAS®; LEXI, Inc., Tokyo, Japan). The system applied a 3D-to-2D registration technique, and the camera calibration technique projected the 3D bone models generated from each subject’s CT scans onto the biplane CR images by matching the silhouettes of the 3D models to the contours of the respective CR images (Fig. 3). These image-matching procedures enabled the creation of the 3D bone model that accurately reproduced the spatial relation between the femur and tibia during the weight-bearing task. The 3D position of each model was matched by minimizing the difference between the projected outline and contour, and all 3D alignment parameters were automatically measured. The median and maximum values of absolute error in estimating the relative positions for the femur and tibia were within 0.5 mm and 0.61° and 1.6 mm and 1.5°, respectively [22].
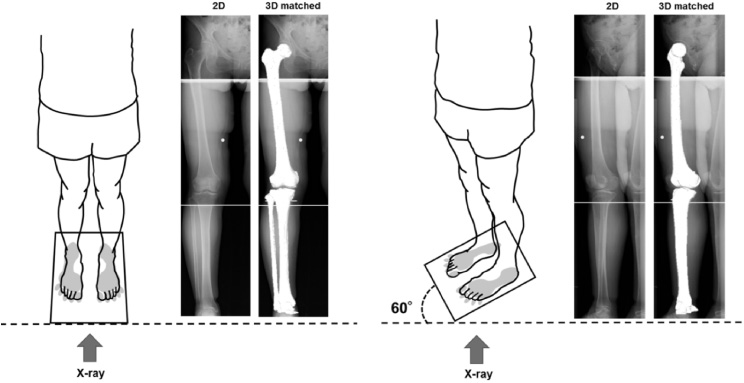
Schematic illustration of the three-dimensional (3D) to two-dimensional (2D) image registration technique. The 3D digital bone models were projected onto the biplanar radiographs under weight-bearing conditions, using the 3D-to-2D image registration technique.
3D-FT alignment parameters, including (1) 3D hip-knee-ankle angle (3DHKA) in the coronal plane, (2) 3DHKA in the sagittal plane, (3) rotational alignment between the femur and tibia, and (4) the distance between the femoral and tibial origins in the AP direction (tibial AP position) were evaluated and defined below.
To evaluate 3DHKA, the 3D mechanical axes of the femur (3DMA-f) and tibia (3DMA-t) were defined in 3D space. 3DMA-f was defined as the line connecting the center of the femoral head and midpoint of the spheres that represented the medial and lateral posterior femoral condyles. 3DMA-t was defined as the line connecting the midpoint of the eminences of the medial and lateral tibial spines with the center of the ankle joint. The angle between 3DMA-f and 3DMA-t projected onto the femoral coronal plane was referred to as the 3DHKA angle in the coronal plane. The 3DHKA in the coronal plane indicated that larger angles have a more varus alignment (Fig. 4). Regarding the extension–flexion angle, the 3DMA-f and 3DMA-t were projected onto the femoral sagittal plane and referred to as the 3DHKA in the sagittal plane (sagittal alignment). The negative values signified extension, which indicated hyperextension of the knee (Fig. 4). The relative rotational alignment between the femur and tibia was defined as the angle between the surgical epicondylar axis (SEA) and Akagi’s line [2] projected onto the axial plane in the tibial coordinate system. Larger values signified external rotation of the femur relative to the tibia, in other words internal rotation of the tibia relative to the femur (Fig. 4). Tibial AP position was presented as the distance between the femoral and tibial origins in the AP direction in the tibial coordinate system (mm). The positive values meant that the tibia was positioned anteriorly relative to the to the femur (Fig. 5). Medial and lateral PTS were defined as the angle between the tibial y-axis and the axis connecting the anterior-most point to the posterior-most point on the medial and lateral tibial joint surface in the sagittal plane (yz) passing through the center of the tibial condyle in each compartment (Fig. 6).
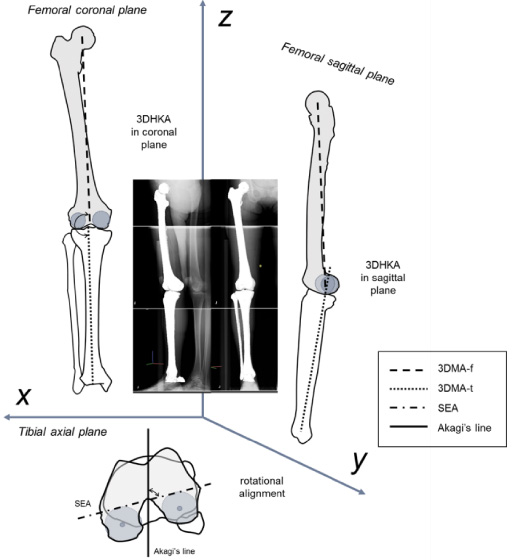
Schematic illustration of the coronal, sagittal, and rotational alignment in the three-dimensional space.
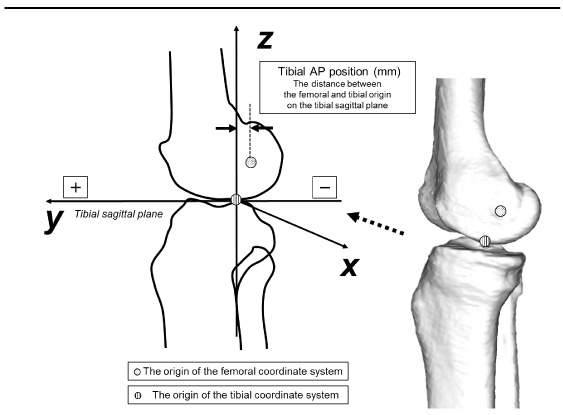
Schematic illustration of the distance between femoral and tibial origins in the anterior–posterior (AP) direction in a three-dimensional space.

Schematic illustration of the angle of the medial and lateral PTS. PTS, posterior tibial slope.
Evaluated parameters were (1) 3DHKA in the coronal plane, (2) 3DHKA in the sagittal plane, (3) rotational alignment, (4) tibial AP position, as 3D-FT alignment parameters, (5) medial PTS, (6) lateral PTS, and (7) PTS difference, as PTS parameters. PTS difference was defined as the angular difference between medial and lateral PTS. These parameters were consistently checked for normal distribution using the Shapiro–Wilk test. 3DHKA in the sagittal plane, age and weight were not normally distributed. Spearman’s rank-order correlation coefficients (r s ) were calculated when the parameters were not normally distributed, and Pearson’s product-moment correlation coefficients (r p ) were calculated when the parameters were normally distributed. To investigate the association between 3DHKA in the sagittal plane or tibial AP position (dependent variables) and PTS parameters (medial PTS and lateral PTS; independent variable), a multiple linear regression model with stepwise procedure was built, including potential confounders (sex, age, weight, height; independent variables). To investigate the association between rotational alignment (dependent variable) and PTS difference (independent variable), we also built a multiple linear regression model with a stepwise procedure including potential confounders (sex, age, weight, height; independent variables). A post-hoc power analysis was performed to determine the power (1 − 𝛽). If the power is close to 1, the hypothesis test is very good at detecting a false null hypothesis [26]. Multiple linear regression analysis showed that a sample size of 110 afforded a > 0.999 post-hoc power (1 − 𝛽) to detect an R 2 value of 0.191 attributable to one independent variable using an F-test with a significance level (𝛼 value) of 0.050.
Regarding the intra-observer reproducibility of the parameters, intraclass correlation coefficient (ICC) was obtained by measuring the parameters two times in a blinded manner in 52 participants on different days. The intra-observer reproducibility via ICC of coronal, sagittal, rotational alignment, tibial AP position, medial PTS, and lateral PTS was 0.99, 1.00, 0.94, 0.98, 0.97, and 0.93, respectively. Moreover, regarding the inter-observer reproducibility of the parameters, ICC was obtained by measuring the parameters in a blinded manner in 20 participants by two researchers. The inter-observer reproducibility via ICC of coronal, sagittal, rotational alignment, tibial AP position, medial PTS, and lateral PTS was 1.00, 0.98, 0.80, 0.88, 0.97, and 0.91, respectively.
The probability level accepted for statistical significance was set at p < 0.05 (SPSS version 24; SPSS, Inc., Chicago, IL, USA). Power analysis was performed using software G*Power 3.1 (Institut fur Experimentaelle Psychologie, Dusseldorf, Germany).
Results
The mean value and standard deviation of the 3DHKA in coronal plane, 3DHKA in sagittal plane, rotational alignment, and tibial AP position were 181.9° ± 2.4°, −2.5° ± 6.1°, 85.7° ± 7.2°, and 8.9 ± 3.1 mm, respectively. Medial PTS, lateral PTS, and PTS difference were 10.3° ± 2.6°, 6.6° ± 3.0°, and 3.8° ± 2.8°, respectively. The mean value, standard deviation, and range of each parameter are shown in Table 1.
Descriptive analysis of the measured variables
Descriptive analysis of the measured variables
HKA = hip-knee-ankle; HKA in coronal plane: larger angles have a more varus alignment; HKA in sagittal plane: the negative values mean extension angle; rotational alignment: the larger values mean internal rotation of the tibia relative to the femur; Tibial AP position: the tibia is positioned anteriorly relative to the femur; PTS = posterior tibial slope; PTS difference = the angular difference between medial and lateral PTS.
Significant positive correlations were found between 3DHKA in the sagittal plane and lateral PTS, height, and weight, and the tibial AP position and lateral PTS, medial PTS, and height (Table 2). Significant negative or positive correlations were also found between rotational alignment and PTS difference, height, and weight (Table 2). Multiple stepwise linear regression performed to identify whether PTS parameters (medial and lateral PTS) were associated with 3DHKA in the sagittal plane, including potential confounders (sex, age, height, weight), found that weight and lateral PTS were the predictors associated with 3DHKA in the sagittal plane (Table 3). Lateral PTS was the only predictor associated with tibial AP position (Table 3). Sex and PTS difference were the predictors associated with rotational alignment (Table 3).
Correlation between each parameter (n = 110)
∗Significant difference: ∗ p < 0.05, ∗∗ p < 0.01, CC: correlation coefficient, †Spearman’s rank correlation coefficient, ††Pearson product-moment correlation coefficients.
Multiple linear regression analysis with stepwise procedure and dependent variable of FT alignment
*Significant difference: ∗ p < 0.05, ∗∗ p < 0.01, 3DHKA: 3D hip-knee-ankle angle, PTS: posterior tibial slope, FT: femorotibial, AP: anterior–posterior.
This study demonstrated that PTS affected 3D FT alignment under weight-bearing conditions in healthy Japanese elderly, accounting for potential confounders such as age, sex, height, and weight. A steeper lateral PTS is associated with a more flexed knee and more anterior position of the tibia under weight-bearing conditions. As the PTS difference increased, the tibia rotated more externally. The novel contribution of this study was to define how the morphologies of the tibial surface of the knee joint affect 3D FT alignment during weight-bearing.
Some studies assessed FT alignment under weight-bearing conditions three-dimensionally [2,3]. These studies have reported that in healthy individuals, the coronal and sagittal alignment as HKA are slight varus and extension, respectively [2,3]. Regarding rotational alignment as the angle between SEA and Akagi’s line, studies have reported that Akagi’s line was perpendicular to the SEA [1,27]. However, in these studies, rotational alignment was assessed in the supine position. In a study examining only 3D FT alignment under weight-bearing on a separate healthy elderly cohort [2], coronal, sagittal, and rotational alignment between the femur and tibia were 181.8°, −3.8°, and 85.7°, respectively. These measurements, taken using the same methodology described in this study, were comparable to the current results, suggesting the validity of the 3D-FT alignment measurements.
In this study, the average medial and lateral PTS were 10.3° and 6.6°, respectively. We used CT to assess PTS. The main identifying measurement is PTS, as measured on conventional lateral radiographs, in which the medial and lateral tibial plateaus are superimposed [13]. Rotation would influence the results of the measured tibial slope on conventional radiographs. Thus, measuring PTS with conventional radiographs has shown poor reproducibility [14,17]. Studies that used magnetic resonance imaging for measuring the tibial slope could distinguish medial and lateral PTS, and may improve reproducibility [12,13,15]. However, images did not include the full length of the tibia, which compromised the measurement of the anatomic axis of the proximal tibia [15,16]. For accurate assessment of bony morphology, CT is the best modality, which was applied in this study. We could accurately measure the medial and lateral PTS at the defined resection plane, which was set parallel to Akagi’s line and contains full mechanical axis and passed the center of each tibial compartment. We also confirmed good intra-observer and inter-observer reproducibility of the measurement of each parameter. It was assumed that the clinical significance of our method was accuracy and reproducibility of the measurement of PTS.
There was a positive correlation between 3DHKA on sagittal plane and lateral PTS. Lateral PTS was the second dominant predictor to weight for sagittal alignment. That is, steeper the lateral PTS, higher the likelihood of 3DHKA being flexed in the sagittal plane. Increase in the slope may be related to higher quadriceps strength, often necessary for full-knee extension [18]. If the PTS was steeper, the knee would be more flexed to avoid fatigue or maintain voluntary quadricep muscle contraction while standing.
A positive correlation was found between the tibial AP position and lateral PTS. Lateral PTS was a dominant factor for tibial AP position. That is, steeper the lateral PTS, higher the possibility of a more anterior tibia. In an in vitro human cadaveric study, an increasing slope caused an anterior shift in the tibial resting position that was emphasized under axial loads, similar to the standing weight-bearing condition in the present study [19]. It is reported that a steeper lateral PTS increases the risk for anterior cruciate ligament (ACL) injury [16], and a steep lateral PTS is associated with an increased risk for early ACL graft failure [28]. Our results indicate a steep lateral PTS is associated with a greater anterior tibial shift, which could be a risk factor for ACL injury or early ACL graft failure.
Regarding rotational alignment, there was a negative correlation observed between rotational alignment and PTS difference. PTS difference was the second most dominant predictor after sex for rotational alignment. A large PTS difference was related to more internal rotation of the femur relative to the tibia; in other words, the tibia was more externally rotated relative to the femur. The external rotation of the tibia is known as a screw-home rotational motion and is associated with the later stages of extension [29]. A large PTS difference might enhance the screw-home rotational motion and result in greater tibial external rotation near full-knee extension (Fig. 7).
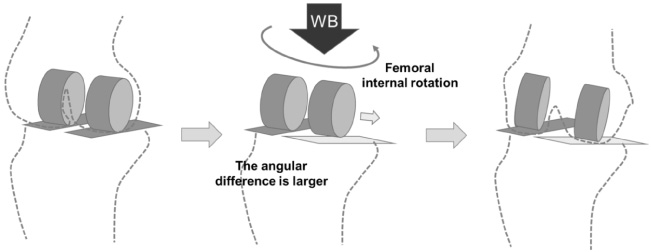
Schematic illustration showing the influence of the PTS difference on rotational alignment. WB, weight-bearing.
Our study revealed that PTS influenced sagittal plane alignment and the tibial AP position as well as rotational alignment in healthy individuals. In ACL deficient knees or knee OA, the influence of PTS might be magnified, causing secondary damage to the joint and accelerating the progression of disease stage. Realignment surgery, such as TKA or HTO, would change 3D-FT alignment by changing the PTS after surgeries. As a result, excessive lateral PTS after TKA or HTO could lead to knee flexion and anterior tibial position while standing and cause persisting flexion contracture or change of cruciate ligament force in activities of daily living. To address the negative clinical outcomes resulting from PTS post-operation, it may be beneficial for surgeons to consider the lateral pre-operative PTS as a guide for the tibial joint surface angle.
There are several limitations in this study. This study did not consider factors such as muscular strength and spinopelvic alignment, which are likely to influence FT alignment. Muscular strength might be a potential extrinsic factor affecting FT alignment. It is also noted that knee flexion, as a compensatory mechanism to sagittal imbalance, is well correlated to spinopelvic alignment, specifically the lack of lordosis and posterior pelvic tilt [30]. Further studies are needed to clarify the causal relationship between PTS and FT alignment parameters in consideration of muscular strength and spinopelvic alignment.
The present study demonstrated that PTS had a correlation and association with 3D-FT alignment under weight-bearing conditions. A steeper lateral PTS is associated with a more flexed knee and more anterior position of the tibia under weight-bearing conditions. Additionally, as the PTS difference increased, the tibia rotated more externally. The similarity between our 3D-FT alignment and those reported in previous studies validates the technique in healthy Japanese elderly individuals. Thus, this dataset could be used as standard reference for assessment of 3D-FT and realignment surgery.
Acknowledgements
The authors would like to thank all staff members of the Department of Rehabilitation, Niigata Medical Center: Drs. Yamanaka K., Takahashi Y., Omori G., and Koga Y.
Footnotes
Conflict of interest
None of the contributing authors have any conflict of interest to report.