
Abstract
BACKGROUND:
Modulation of macrophage polarization is required for effective tissue repair and regenerative therapies. Therapeutic modulation of macrophages from an inflammatory M1 to a fibrotic M2 phenotype could help in diseases, such as chronic wounds, which are stalled in a prolonged and heightened inflammatory stage within the wound healing process.
OBJECTIVE:
This study evaluates the efficiency of a pullulan/gelatin nanofiber scaffold loaded with retinoic acid (RA) and adipose-derived mesenchymal stem cells (ASCs) to modulate M1 to M2 anti-inflammatory transition.
METHODS:
Scaffolds were fabricated by electrospinning, and crosslinked using ethylene glycol diglycidyl ether (EGDE). Exposure of RA and/or ASCs to cultured macrophages have been shown to promote M1 to M2 transition. Pullulan was chosen as a scaffold material due to its ability to quench reactive oxygen species, key signaling molecules that play an important role in the progression of inflammation, as well as for its excellent mechanical properties. Gelatin was chosen as an additional scaffold component due to the presence of cell-binding motifs and its biocompatibility. Scaffold compositions examined were 75:25 and 50:50, pullulan:gelatin. The scaffolds were crosslinked in 1:70 and 1:50 EGDE:EtOH. The scaffold composition was determined via FTIR. For the present study, the 75:25 pullulan:gelatin crosslinked with 1:70 EGDE:EtOH, forming nanofibers 328 ± 47.9 nm (mean ± SD) in diameter, was chosen as the scaffold composition due to its lower degradation and release rate, which allows a sustained delivery of RA.
RESULTS:
The scaffold composition degraded to approximately 80% after 14 days, with approximately 38% of the drug released after 7 days. THP-1 monocytic cells were induced into a M1 macrophage phenotype through stimulation with lipopolysaccharide (LPS) and gamma interferon (IFN-γ). These M1 macrophages were the exposed to scaffolds loaded with RA and ASCs, to induce differentiation to an M2 phenotype.
CONCLUSION:
Gene expression quantitation by qPCR showed a reduction of M1 biomarkers, tumor necrosis factor alpha (TNFα) and interleukin 1β (IL1β), and an increase of M2 biomarker CCL22 after 2 days of exposure, suggesting successful M1 to M2 transition.
Introduction
Macrophages are important multifunctional white blood cells, which play a role in the adaptive and innate immune system, and are involved in disease prevention, infection and debris removal, tissue healing, and regulation [1]. They are versatile cells, capable of transitioning between phenotypes depending on environmental conditions [2]. The two commonly described phenotypes of macrophages are inflammatory M1 and anti-inflammatory or fibrotic M2 [3]. Polarization is not fixed, and transition of macrophages between M1 and M2 is critical to manage infection and disease [4]. During acute wound healing, M1 macrophages are mainly involved in the removal of debris, bacteria, and damaged cells. This is followed by macrophages transitioning to a M2 phenotype, promoting healing and regeneration, as they transition through the healing process. Dysregulation of M1 or M2 expression has been associated with major diseases including chronic wounds (i.e., diabetic, pressure and venous ulcers), chronic obstructive pulmonary disease, infections, atherosclerosis, cancer, asthma, Parkinson’s, Alzheimer’s, and cancer [5–11].
Injury leads to the recruitment of circulating monocytes and other inflammatory cells, which upon arrival are exposed to inflammatory stimulants such as lipopolysaccharide (LPS) and interferon gamma (IFN-γ), which induce their differentiation towards M1 macrophages. These macrophages then release immunostimulatory cytokines such as tumor necrosis factor alpha (TNFα) and interleukin 1β (IL1β), and microbicidal molecules. In adaptive immunity M1 macrophages are good antigen presenting cells and recruit T helper Th1 cells. In contrast, M2 macrophages express genes corresponding to anti-inflammatory cytokines, such as CCL18 and CCL22, and are associated with T helper 2 cell recruitment and suppression of T helper 1 cell response. In addition, regulation of regulatory T cells by M2 macrophages play a role in tissue regeneration as well as disease prevention [12]. Overall, macrophages play a vital role in controlling disease, wound healing, and regeneration. Research has shown promoting M1 to M2 transition can help alleviate inflammatory diseases [13–15].
We hypothesize that a novel combination of adipose-derived mesenchymal stem cells (ASCs) and retinoic acid (RA), in combination with an electrospun nanofiber scaffold composed of pullulan and gelatin may induce macrophage M1 to M2 transition. There is significant evidence supporting the role of ASCs and RA in promoting an M1 to M2 transition separately, and although they have been shown to improve wound repair simultaneously, their effect on M1 to M2 transition has not been documented [16–19]. Pullulan was chosen due to biocompatibility, effective mechanical properties, and ability to quench reactive oxygen species (ROS), which exacerbate inflammation [20–23]. The choice of gelatin was due to its well-established use in drug delivery and wound healing, and its biocompatibility and cellular adhesion properties [24]. The nanofibers were crosslinked using EGDE to prolong degradation. The combination of pullulan and gelatin has been shown to be effective for wound healing [25–27]. This is the first study which combining ASCs, RA, pullulan, and gelatin. In the following study, we verify the structure and composition of the resulting scaffold and evaluate its potential to modulate macrophage polarity from an M1 to an M2 phenotype.
Materials and methods
Electrospinning
The electrospinning technique was used to form nanoscale fibers, which were deposited on a collection surface, until forming the scaffolds used for the patch. This process was carried out at 50 °C by using a heat gun to maintain solution to be polymerized in the liquid phase. The device setup consisted of a syringe pump, a high voltage power supply (Information Unlimited, Inc., Amherst, NH, USA), and a collector plate covered with non-stick aluminum foil. Pullulan/gelatin composite solutions were loaded in 10 mL syringes and placed horizontally. The solution was expunged through a 22-gague blunt-end needle and fibers were collected. The electrospinning process was carried out at: 37 kV, 55 μL/min flow rate, 18 cm of distance between syringe needle and collector plate. Scaffolds were stored at 4 °C in a vacuum desiccator until use.
Crosslinking
Pullulan (MW - 200,000 Da, Hayashibara Laboratories, Okayama, Japan) and Type A gelatin from porcine skin (Electron Microscopy Sciences, Hatfield, PA, USA) were used at two different pullulan:gelatin ratios, i.e., 75:25 and 50:50 in water. Crosslinking solutions were prepared at different ratios of EGDE to absolute ethanol. Ratios tested were 1:100, 1:50 and 1:70 with the addition of 0.05 M citric acid. Pullulan/gelatin nanofibers were immersed in crosslinking solution for 24 h (n = 5). Crosslinked nanofibers were dried at 50 °C for 24 h. This is a modified protocol based on a method described by Li et al., to crosslink gelatin [28].
Scaffold loading
Nanofiber scaffolds (10 μg) were first rinsed with PBS and then sterilized with UV for 1 h prior to loading. Solutions with 5 or 10 μg of RA in EtOH were added via a 0.2 μm syringe filter to the sterilized scaffold, which was then dried. ASCs were incubated with the sterilized scaffold (with and without RA) for 3 min.
Cell culture
Human Monocytic THP-1 cells (ATCC® TIB-202 TM , Manassas, VA, USA) were maintained in culture medium (RPMI 1640, Life Technology, Grand Island, NY, USA) containing 10% heat-inactivated FBS (GE Hyclone, Marlborough, MA, USA). THP-1 cells were differentiated into macrophages by incubating for 24 h with 200 nM PMA (Cayman Chemicals, Ann Arbor, MI, USA) and supplemented with 30 ng/mL GMCSF (GenScript, Piscataway, NJ, USA) for macrophage growth. Macrophages were polarized to M1 macrophages by incubation with 100 ng/mL LPS (eBioscience, San Diego, CA, USA) and 100 ng/ml IFN-γ (Invitrogen, Rockford, IL, USA) for 24 h. Adult non-diabetic ADMSCs from Lonza (Alpharetta, GA, USA) were cultured to passage 4 in MSC basal medium (ScienCell, Carlsbad, CA, USA). In co-culture experiments, THP-1 cells were differentiated in 24-well plates. After polarization, cells were washed and resuspended in 1 mL 10% FBS with RPMI. MSCs were incubated on sterile electrospun scaffolds for 3 min, then loaded into transwell inserts (Corning, New York, NY, USA).
Reagents
IFN-γ (Invitrogen, Rockford, IL, USA) was used at a concentration of 100 ng/ml and LPS (eBioscience, San Diego, CA, USA) was used at a concentration of 100 ng/ml for macrophage differentiation. Treatments were added 1 day after differentiation. RA (Sigma Aldrich, Saint Louis, MO, USA) was dissolved in DMSO at 50 mg/mL. Treatment of RA in culture was at 5 μg/mL and 10 μg/mL.
Scanning electron microscopy (SEM)
SEM Images were obtained using a Phenom Pro scanning electron microscope (Thermo Fisher Scientific Inc., Waltham, MA, USA). Electrospun nanofibers were sputter-coated with 10 nm of iridium. Scaffold imaging was done before and after crosslinking with EGDE. Images are representative of the average results. Nanofiber diameters were measured using ImageJ (NIH, Bethesda, MD, USA). Diameter averages were compared statistically using JMP software (SAS Institute, Cary, NC, USA) and a t test. Three images were taken for each sample with 20 nanofiber diameters measured for each image.
Fourier-transform infrared spectroscopy (FTIR)
Scaffold compositions were determined by loading onto an attenuated total reflectance (ATR) attachment and using a Thermo Scientific Nicolet iS 50 FTIR (Thermo Fisher, Waltham, MA, USA). Data was plotted in MS Excel (Microsoft, Redmond, WA, USA).
Scaffold degradation and drug release
A 10 μg sample of crosslinked RA-loaded scaffold was incubated with 1 mL Ringer’s solution at 37 °C with shaking at 100 rpm. Samples for each concentration was measured in quadruplicate. The same sample was used consistently for both drug release and degradation. Ringer’s solution was collected and analyzed for RA using a NanoDrop 2000 spectrophotometer at 316 nm (Thermo Fisher Scientific, Waltham, MA, USA). Time points for drug release collection were 1, 4, 8, 24, 72 and 168 h. Time points for scaffold degradation were 1, 3, 7 and 14 days. For time points that coincide between drug release and degradation, Ringer’s solution was collected, then the scaffold was dried at 50 °C for 24 h and the weight of the contents measured. A 1 mL sample of fresh Ringer’s solution was then added, and incubation was resumed.
Live/dead imaging
An ethidium and calcein kit (Invitrogen, Rockford, IL, USA) was used to stain for live and dead cells. Calcein is retained by living cells, while ethidium only enters damaged cell membranes. Live and dead cells were imaged using a Leica DMI 6000 CS inverted fluorescent microscope (Buffalo Grove, IL, USA). Live cells have emission at 495 nm and excitation at 515 nm, dead cells have emission at 528 nm and excitation at 617 nm.
Quantitative polymerase chain reaction (qPCR)
In vitro ability of RA and ASC-loaded pullulan/gelatin nanofibrous scaffold to influence macrophage polarization from M1 to M2 was assessed by determining the gene expression of M1 markers TNFα (Sinobiological, Beijing, China) and IL1β (Sinobiological, Beijing, China), and M2 markers CCL22 (Biomol, Rockville, MD, USA) and CCL18 (GeneCopoeia, Rockville, MD, USA) using real time quantitative PCR (qPCR). Macrophages were plated at 1 × 10⁶ cells per well. A 10 μg sample of scaffold was added to each transwell with RA loaded at 5 μg or 10 μg and/or passage 4 ASCs loaded with 1 × 10⁶ cells. After 2 days of incubation M1 and M2 marker expression were assessed. After incubation cells were washed with PBS, and RNA was isolated using Trizol (Cat. # 15-596-018, Invitrogen, Carlsbad, CA, USA). RNA concentration was measured using a NanoDrop 2000 spectrophotometer (ThermoFisher, Waltham, MA, USA). Approximately 300 ng of RNA was transcribed into cDNA using the high-capacity cDNA reverse transcription kit from Applied Biosystems (Cat. # 43-688-14, Foster City, CA, USA). qPCR was carried out using SYBR Green PCR master mix (Cat. # 4309155, Applied Biosystems,) in combination with specific primers using StepOnePlus from Applied Biosystems (Foster City, CA, USA). The amplification reaction was set at 95 °C for 5 min, and for pre-denaturation, 50 cycles of 95 °C for 20 s, 60 °C for 40 s, and 72 °C for 20 s, then the melt curve was taken. Relative expression was normalized to GAPDH and relative gene expression was calculated as fold change (fold change = 2−ΔΔCt).
Statistical analysis
Collected data was examined using Microsoft Excel and SAS JMP student edition 11. P-values of <0.05 were considered significant.
Results
Scaffold composition
We initially tested several different compositions including 75:25 and 50:50 pullulan:gelatin, both at crosslinking ratios of 1:70 and 1:50 EGDE. A 1:100 ratio was also tested; however, it was discarded due to low crosslinking, which resulted in dissolution rates that did not last the duration of our experiments. FTIR, drug release and degradation rate were analyzed using each of these compositions. However, the 75:25 pullulan:gelatin composition and a crosslinking ratio of 1:70 EGDE:EtOH gave the best degradation and release results. The composition was confirmed via FTIR for each scaffold, however, only the 75:25 pullulan:gelatin at a 1:70 EGDE:EtOH crosslinking ratio was used for this study.
FTIR analysis confirms the presence of both gelatin and pullulan in our scaffold (Fig. 1). Gelatin has peaks at 1520 cm−1 for N–H bending of amide II, and 1630 cm−1 for C=O stretching of amide I [29]. Pullulan has peaks at 755 cm−1 for α-(1,6)-D-glucosidic bonds, 844 cm−1 for α configuration of α-D-glucopyranose, 928 cm−1 for α-(1,4)-D-glucosidic bonds, 1140 cm−1 for C–O–C stretch, 1340 cm−1 for C–O–H bend, and 2900 cm−1 for C=O stretching of sp3 C–H bond. After confirming the presence of pullulan and gelatin in the scaffold, we then focused on the presence of crosslinker [30].

FTIR of pullulan (100:0), gelatin (0:100), and 75:25 pullulan:gelatin scaffold, FTIR of 75:25 pullulan:gelatin scaffold before and after crosslinking 1:70 EGDE:EtOH, FTIR of 75:25 pullulan:gelatin scaffold crosslinked 1:70 EGDE:EtOH before and after adding RA.
Presence of the EGDE crosslinker can be seen in the scaffold with peaks at 852 cm−1 and 1260 cm−1 showing C–N bonds, and 3300 cm−1 shows an increased peak due to stretching of OH groups (Fig. 1). The presence of the metabolite RA, chosen to promote M1 to M2 transition, was then analyzed via FTIR to assess its incorporation into the scaffold. After crosslinking the scaffold, RA was added. FTIR analysis confirms the presence of RA with peaks at 1250 cm−1 showing C–O stretch vibrations (Fig. 1).
Each scaffold combination of polymer and crosslinker composition was imaged using SEM. We looked at 100:0, 75:25, and 50:50 pullulan:gelatin, each with 1:70 and 1:50 EGDE:EtOH crosslinking. SEM images of the pullulan/gelatin nanofibers can be seen in Fig. 2. Nanofibers were seen to be randomly distributed and monomodal. The diameter of all nanofibers was determined in the range of 300–370 nm (Table 1), with a significant increase in diameter with gelatin content from 0 to 50%. The nanofibers with 75% pullulan and 1:70 crosslinking, showed the smallest diameter between the composites, implying increased space for drug loading.
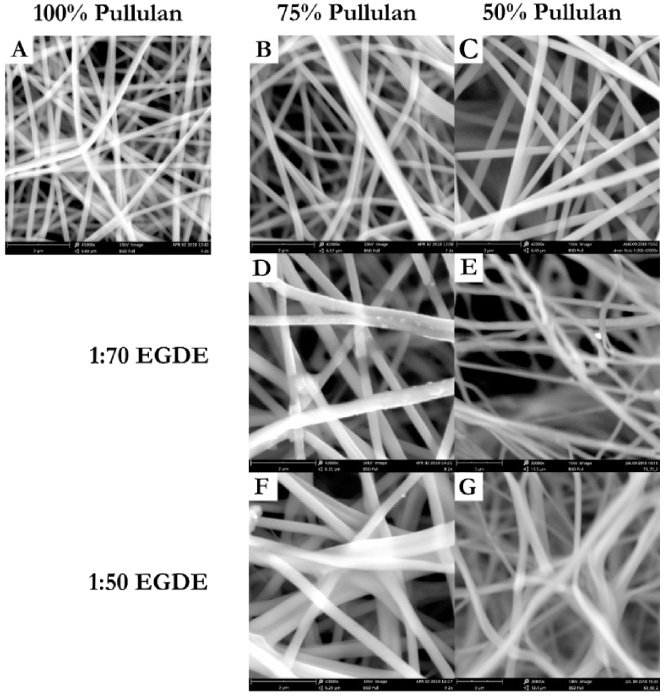
SEM images of nanofibers; 100% pullulan (100:0) (a), 75:25 pullulan:gelatin (b), 50:50 pullulan:gelatin (c), 75:25 pullulan:gelatin with 1:70 EGDE:EtOH crosslinker (d), 50:50 pullulan:gelatin with 1:70 EGDE:EtOH crosslinker (e), 75:25 pullulan:gelatin with 1:50 EGDE:EtOH crosslinker (f), 50:50 pullulan:gelatin with 1:50 EGDE:EtOH crosslinker (g).
Nanofiber diameter
SD refers to standard deviation, and ∗∗∗ to P < 0.05.
Figure 3 shows scaffold degradation for each of the polymer-crosslinker combinations with and without RA. Ringer’s solution at 37 °C with constant agitation, was used for the scaffold degradation experiments to mimic physiological conditions. RA was added to these samples to determine if there was an effect on degradation rate, however no significant differences were detected. Degradation testing was examined using two-way ANOVA. Scaffolds with 75:25 pullulan:gelatin had significantly less degradation, when compared to 50:50 with a p < 0.0005.
Degradation of scaffold measured at day 1, 3, 7 and 14. Data is represented as mean ± SEM.
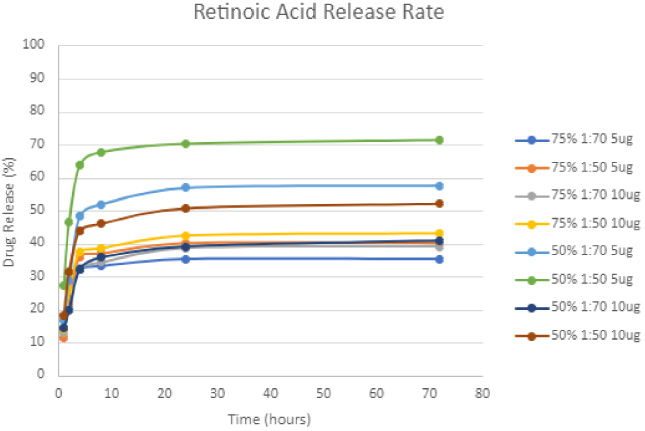
RA release rate from the scaffolds was examined at 1, 2, 4, 8, 24, 72 h and 1 week (i.e., 168 h), loaded with either 5 or 10 μg of RA (Fig. 4). The majority of RA was released within the first 3 days. RA concentrations show a significantly lower release with increased crosslinking for both 75:25 and 50:50 pullulan:gelatin, with a p value of <0.0001 using two-way ANOVA. There is no significant difference for drug release between 75:25 and 50:50 pullulan:gelatin concentrations. Since RA release rate is lower with 1:70 EGDE:EtOH crosslinking, we chose this concentration for extended drug treatment. From this point on, any reference to the scaffold, will imply 75:25 pullulan:gelatin and 1:70 EGDE:EtOH crosslinking.
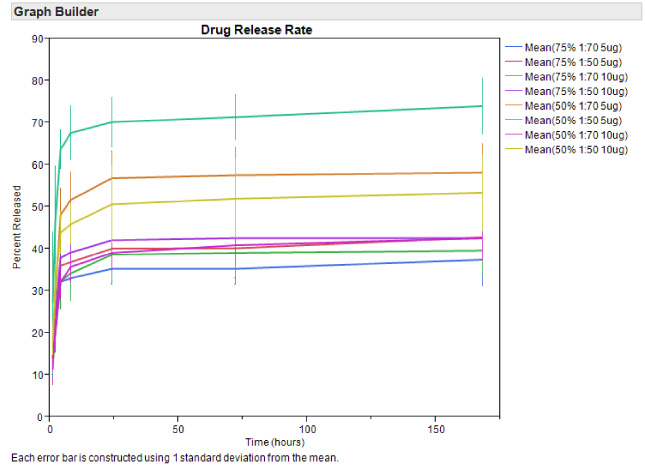
Release rate of RA from scaffolds measured at 1, 4, 8, 72, and 168 h. Data is represented as mean ± SEM.
Figure 5 shows live/dead assay for M1 polarization at days 1, 2 and 3, with an increase in number of dead cells at days 2 and 3.

Live/dead assay showing no treatment (NT) with RA (a–c), 1 day of LPS/IFN-γ treatment (d–f), 2 days of LPS/IFN-γ treatment (g–i), 3 days of LPS/IFN-γ treatment (j–l). Live cells are green (a, d, g, j), dead cells are red (b, e, h, k), and merging of live and dead cells (c, f, I, l).
M1 markers, TNFα and IL1-β, and M2 markers, CCL22 and CCL18, were analyzed for polarization at days 1–3 post LPS/IFN-γ treatment (Fig. 6). Since the M1 phenotype was clearly shown after 1-day exposure to LPS and IFN-γ, and fewer cells were dead, this was chosen as day 0 of exposure to the scaffold-ASC-RA combinations. There was no significant difference between observed M2 marker expression between days 1, 2 or 3 except 6-fold change from day 1 to day 3 in CCL22 (Fig. 6).
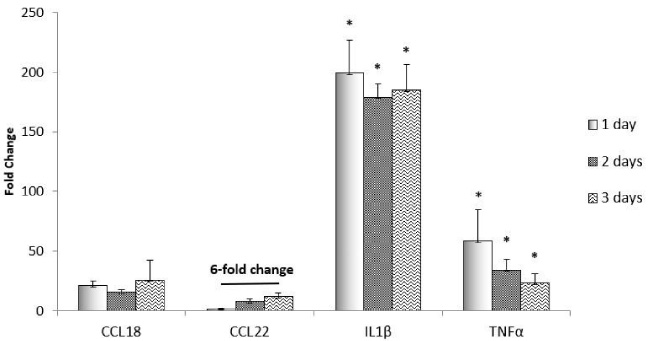
qPCR of day 1, 2, and 3 post-treatment of macrophages with 100 ng/mL LPS and 100 ng/mL IFN-γ. Normalize to untreated cells. Data is represented as mean ± SEM. ∗, significantly different from untreated cells (one-way ANOVA, P < 0.05).
Temporal expression of M1 and M2 biomarkers of macrophages exposed to 0, 5 or 10 μg/ml of RA. Data is represented as mean ± SEM. (∗student’s t-test, P < 0.05).
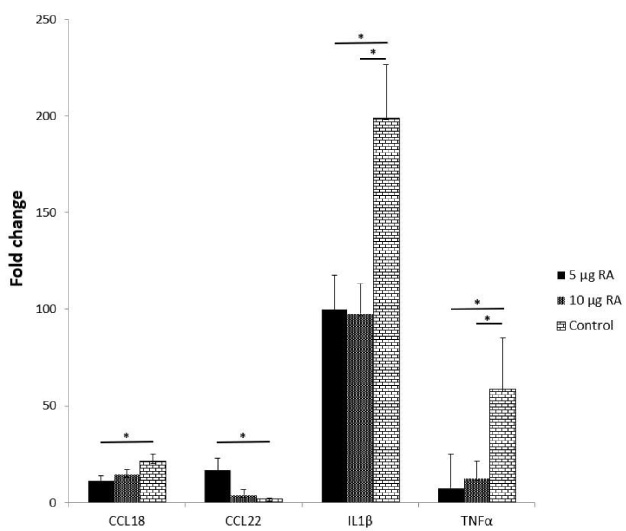
To investigate the ability for the scaffold, RA, and ASCs to polarize macrophages to the M2 phenotype, the same M1 and M2 markers were measured using qPCR (Fig. 7). Macrophages can switch polarity between the M1 and M2 phenotypes due to changes in their microenvironment. In this study, 5 and 10 μg RA added directly onto the macrophages, significantly decreased the M1 marker IL-1β with a p-value of 0.015, and TNF-α with a p-value of 0.02. In addition, the CCL22 marker also increased (Fig. 7).
Exposure of the macrophages to the scaffold alone, significantly increased the M2 biomarker CCL2, while significantly decreased both M1 biomarkers, IL-1β and TNFα, when compared to those exposed to either scaffold-ASC or scaffold-ASC-RA.
Macrophages exposed to acellular scaffolds loaded with RA (i.e., scaffold-RA), revealed a decrease in TNFα compared to the scaffold with ASCs and no RA (i.e., scaffold-ASC). In addition, this decrease in TNFα was not seen in the presence of ASCs, showing that RA plays a vital role in the M1 to M2 transition. Also, the presence of ASCs in scaffolds with or without RA had a weaker effect in lowering the expression of M1 biomarker IL1-β (Fig. 8). In addition, there was a significant difference (P < 0.05) in the expression of M1 biomarker between the scaffold alone and the one containing both ASCs and 10 μg RA (i.e., scaffold-ASC-10 μg RA).

qPCR of M1 and M2 biomarkers of macrophages exposed to scaffolds loaded with RA and/or ASCs on M1 to M2 transition. Data is represented as mean ± SEM. (∗student’s t-test, P < 0.05.)
As seen in Fig. 8, after 3 days, all treatments except scaffold-ASC-10 μg RA show a decrease in M2 biomarker CCL18 expression. These differences were significant (P < 0.05) for the scaffold with cells between 5 and 10 μg RA, and between the scaffold with cells but without RA and the scaffold alone with 10 μg RA. In addition, the was a significant increase (P < 0.05) in the expression of the M2 biomarker CCL22, for the scaffold-ASC, without RA and with both quantities of RA (i.e., 5 and 10 μg) with the last having the larger difference.
In this study we analyzed the effect of pullulan and gelatin scaffold to determine macrophages fate considering its importance in inflammatory disease and wound healing. Pullulan was chosen because it is a natural nonionic exopolysaccharide produced by Aureobasidium pullulans, composed of α-1,6-linked maltotriose residues. It is water soluble, biodegradable, non-hygroscopic, non-reducing, thermally stable, blood compatible, antioxidant, non-toxic, and non-immunogenic. Pullulan is also FDA-approved as a slow digesting, low calorie food additive for preservation. There are recent investigations that demonstrate the potential of pullulan in drug targeting [31], tissue engineering [32] and wound healing [33,34] Gelatin on the other hand, is the hydrolyzed form of collagen I, the main component of connective tissue. It has great biocompatibility and is less immunogenic than collagen. Gelatin contains functional motifs, such as RGD sequences, which promote cellular adhesion, differentiation, and proliferation. Gelatin has been FDA-approved and is widely used in many tissue engineering applications [35].
The scaffold of 75:25 pullulan:gelatin was selected in this study and was crosslinked with EGDE, which crosslinks both pullulan and gelatin via their hydroxyl groups. This crosslinker contains two epoxide functional groups located at each end of the linear molecule, which is highly reactive due to the high strain existing in the epoxide ring. This allows EGDE to chemically react with amino, carboxyl and hydroxyl functional groups [25].
We doped our scaffold with known inducers of M2 macrophages, RA and ASCs, to see if they could accelerate the M1 to M2 transition.
Interestingly, scaffolds alone promoted a significant level of expression of the M2 biomarker CCL2. Macrophage plasticity is seen in their capacity to switch polarization states in response to their microenvironment [36]. The surface of various biomaterials has been shown to influence macrophages. For example, it has been shown that softer scaffolds are capable of a reduced inflammatory response [37]. Pullulan and gelatin have a softer surface compared the polystyrene in the control groups. So, it is reasonable for the M2 macrophage transition to be induced when exposed to pullulan/gelatin scaffolds. Additionally, macrophages are in a three-dimensional environment in the body, so culturing them in the scaffold is closer to their natural environment. In a study using poly-hydroxy-ethyl-methacrylate (p-HEMA) scaffolds of small (34 μm) and large (160 μm) pore sizes, increased the presence of M1 phenotype when grown in the small pore size scaffold [38]. The preference for M2 macrophages with scaffold pore size, shown in our study, needs further analysis.
Surface topography is an established method to modulate cellular response [36]. It has been shown that M2 macrophages favor smaller electrospun fibers [39], as those resulting from the gelatin-pullulan composite used in this study.
Adding RA to this scaffold resulted in a significant reduction in TNFα, supported by the reported anti-inflammatory actions shown in various cell types. An in vitro study on rat microglia, RA showed similar anti-inflammatory effects, which correlated with the increased expression of retinoic acid receptor-β and TGF-β1, and the inhibition of NF-𝜅B translocation, reducing the expression of various pro-inflammatory genes [40]. RA inhibited hepatic macrophage expression of the proinflammatory cytokine TNF-α in another study. This effect was found to be mediated, at least in part, via destabilization of TNF-α mRNA [41]. More specifically, RA downregulated the proinflammatory cytokines, like TNF-α, in the THP-1 monocyte/macrophage cell line. In this study TNF-𝛼 mRNA was slightly reduced by RA in LPS-stimulated THP-1 cells [42]. It is possible that RA stabilizes TNF-α mRNA expression in this study as well once it is release from the scaffold.
Presence of ASCs in scaffolds seems to inhibit the expression of M1 biomarker IL1-β, compared to the control, but not to the acellular scaffold. Hence, a scaffold doped with RA without ASCs, is more efficient in inducing the M2 phenotype. In general, its known that stem cells have a positive effect on M1-to-M2 macrophages transition. M1 macrophages show high levels of nitric oxide synthase (iNOS) expression and low levels of arginase-1 (Arg1). If iNOS is inhibited, Arg1 increases, promoting the M2 phenotype [43]. The effect of scaffold/RA/ASCs on iNOS expression deserves further study, to clarify the potential of pullulan or gelatin in inhibiting iNOS, as a mechanism of inducing an M2 transition.
Finally, in vitro studies results show that 75:25 pullulan:gelatin crosslinked with 1:70 EGDE:EtOH scaffolds loaded with 10 μg RA, where shown to have the strongest effect on M1 to M2 differentiation in exposed macrophages. This scaffold formulation may potentially result in novel therapeutics to reduce the inflammatory environment of chronic wound beds.
Ethics statement
Approval from the institutional review board was not required.
Informed consent
Not applicable.
Conflict of interest
The authors declare no potential conflicts of interest with respect to the research, authorship, and/or publication of this article.
Author contributions
KA: Collection and/or assembly of data, data analysis and interpretation, manuscript writing. NN: Assembly of data, data analysis and interpretation, manuscript writing. SS: Conception and design of the work, data interpretation. JR: conception and design, data analysis and interpretation, manuscript writing, final approval of manuscript.