
Abstract
BACKGROUND:
Sand therapy is a non-pharmacological physiotherapy method that uses the natural environment and resources of Xinjiang to treat through the heat transfer and magnetic effects of sand.
OBJECTIVE:
Employing the two-phase flow-Casson blood flow model, we investigate the mechanism of atherosclerosis prevention via sand therapy, offering a biomechanical theoretical rationale for the prevention of atherosclerosis through sand therapy via the prism of computational fluid dynamics (CFD).
METHODS:
Sand therapy experiments were conducted to obtain popliteal artery blood flow velocity, and blood was considered as a two-phase flow composed of plasma and red blood cells, and CFD method was applied to analyze the hemodynamic effects of Casson’s blood viscosity model before and after sand therapy.
RESULTS:
(1) The blood flow velocity increased by 0.24 m/s and 0.04 m/s at peak systolic and diastolic phases, respectively, after sand therapy; the axial velocity of blood vessels increased by 28.56% after sand therapy. (2) The average red blood cell viscosity decreased by 0.00014 Pa ⋅ s after sand therapy. (3) The low wall shear stress increased by 1.09 Pa and the high wall shear stress reached 41.47 Pa after sand therapy. (4) The time-averaged wall shear stress, shear oscillation index and relative retention time were reduced after sand therapy.
CONCLUSION:
The increase of blood flow velocity after sand therapy can reduce the excessive deposition of cholesterol and other substances, the decrease of erythrocyte viscosity is beneficial to the migration of erythrocytes to the vascular center, the increase of low wall shear stress has a positive effect on the prevention of atherosclerosis, and the decrease of time-averaged wall shear stress, shear oscillation index and relative retention time can reduce the occurrence of thrombosis.
Introduction
Sand burial therapy (sand therapy for short) is a non-pharmacological physiotherapy method that uses the natural environment and resources of Xinjiang to treat through the heat transfer and magnetic effects of sand. Sand therapy can treat rheumatism and has analgesic, sedative, anti-inflammatory, decongestive, antihypertensive, hypolipidemic and antidiarrheal effects [1]. In the study of sand therapy on haemodynamics, Liu et al. [2] studied the haemodynamic effects of sand therapy on human femoral artery, and Qiao et al. [3] found that sand therapy has reduced the tendency of atherosclerotic plaque enlargement. Wu et al. [4] studied and statistically analysed the haemodynamic parameters of popliteal artery before and after sand therapy in 58 subjects, and found that sand therapy could increase the blood circulation rate and improve the blood circulation. However, current studies on the haemodynamic aspects of sand therapy consider blood to be a Newtonian fluid with constant viscosity; in fact, blood is a non-Newtonian fluid consisting of e.g. plasma, erythrocytes and platelets, and a single Newtonian fluid model may overestimate the wall shear stress.
Atherosclerosis is a lipid-driven, chronic inflammatory disease that forms plaques, usually in medium and large arteries, and is a major cause of ischaemic heart disease and stroke. An important and potential factor in the formation of atherosclerosis is wall shear stress, where low wall surface weakens the mass transfer between blood and the vessel wall, high wall shear stress may damage the vessel wall and endothelial cells ultimately resulting in thrombosis, and there is a strong association between local intimal thickening and wall shear stress. In addition, studies [5,6] have shown that atherosclerotic disease is a long-term developmental process, and that timely intervention at an early stage can be effective in controlling the disease or even improving the condition.
Although some achievements have been made in the study of the effect of sand therapy on haemodynamics, basically the blood is regarded as a single-phase Newtonian fluid and there is no specific analysis of the mechanism of sand therapy on atherosclerosis. In this paper, we use Phillips CX50 colour Doppler ultrasound to collect the popliteal artery inlet velocities before and after sand therapy, and the blood is regarded as a two-phase non-Newtonian model, which will be more able to reveal the mechanism of the effect of sand therapy on atherosclerosis. Majid Abbasian et al. [7] investigated the haemodynamics of Newtonian fluids and 15 non-Newtonian fluids, and found that the most accurate results were obtained by using the Casson blood viscosity model in computational fluid dynamics (CFD) calculations by comparing it with clinical experimental data. Therefore, this paper extends blood into a two-phase flow model composed of plasma (liquid phase) and red blood cells (solid phase), and other blood components such as platelets are ignored as their volume fraction is less than 1%, and analyses the changes in hemodynamic parameters of Casson blood viscosity model before and after sand therapy to explore the physiotherapy mechanism of sand therapy on atherosclerotic diseases, and to provide the theoretical basis for biomechanics in the prevention of atherosclerosis.
Materials and methods
Model reconstruction
Fifty-eight (age: 33 ± 14) healthy volunteers without popliteal artery stenosis and other known cardiovascular diseases were selected to participate in this study. Blood flow parameters such as popliteal artery blood flow velocity, intravascular diameter and other blood flow parameters before and after sand therapy were collected and statistically analyzed using Doppler ultrasonography with the subjects lying on their backs to calculate the Reynolds number of blood flow before and after sand therapy and to determine the state of blood flow. The DICOM data of the popliteal artery of a healthy volunteer without popliteal stenosis and other known cardiovascular diseases were obtained using CT scans, and the DICOM data were imported into Mimics 17.0, and the 3D geometric configuration of the vessel was reconstructed by selecting the popliteal artery (POA), anterior tibial artery (ATA), and posterior tibial artery (PTA) sites of the lower extremity. A solid model of the vessel wall with 1 mm thickness was constructed using Geomagic Studio, and the geometric model of the bifurcation vessel of the popliteal artery in the subject was obtained as shown in Fig. 1.
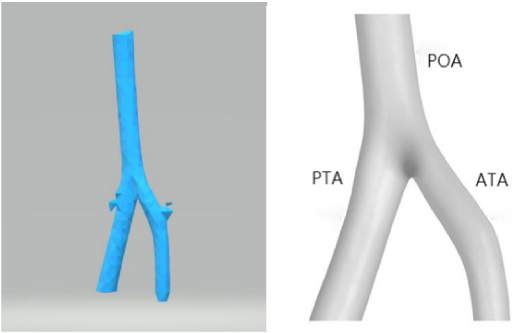
Establishment of geometric model. A. Construction of rouge artery model based on CT data. B. Rouge artery model after construction and smoothing.
In this paper, the multiphase model is extended to a two-phase flow consisting of plasma and red blood cells (RBC), and the multiphase CFD method proposed by Gidaspow [8] and Anderson and Jackson [9] is applied to describe the multiphase hemodynamics of blood. The multiphase model includes the volume fraction of each phase, and the mechanisms of momentum, mass and energy exchange between the phases.
The equation of continuity between the phases (k = plasma, RBC) is given by the following equation:
The momentum equation for each phase (k = plasma, RBC) is given by the following equation [10]:
The mixed density of blood is derived from the sum of the volume fraction weighted densities of plasma and RBCs [11]:
The stress tensor for each stage is given in Newtonian form as follows [7]:
Plasma is considered as a Newtonian fluid with constant viscosity 𝜇
plasma
= 0.0035 Pa ⋅ s [16],
Particles moving in a viscous fluid are subjected to drag forces and the Schiller–Naumann model was used to calculate the trapping forces between the continuous phase (cp) and the discrete phase (dp) [17].
The other forces acting on each phase include the lift force [18] and the virtual mass force [19], and the lift force expression is given by:
The virtual mass force expression is given by:
Casson blood viscosity model [20]:
The elastic vessel wall will deform periodically under the action of pulsating blood flow, while the pressure and stress on the vessel wall surface will change periodically, and in turn the deformation of the vessel wall will affect the change of the blood flow field, i.e., the flow-structure coupling between the pulsating blood flow and the elastic vessel wall.
The arbitrary Lagrangian–Euler method (ALE) is the most commonly used method for solving the fluid–solid coupling problem [21,22]. For the solid region, the control equations satisfy the law of conservation of momentum.
For the fluid region, the continuity equation and the momentum conservation equation are still satisfied. Considering that this paper applies a two-fluid model to describe the blood flow, Eq. (3) can be rewritten in an arbitrary Lagrangian–Eulerian form as follows:
In this paper, the finite element software ANSYS Transient Structural and CFX modules are used to calculate the solid and fluid domains, respectively, and the data are exchanged between the two under the ANSYS workbench platform through a predefined intersection interface, i.e., the inner wall surface of the vessel, thus realizing the fluid–solid coupling calculation. The solid and fluid regions satisfy the boundary conditions of no slip and no infiltration at the intersection:
The reconstructed popliteal artery model was loaded in the CFD software CFX 17.0, and the popliteal artery inlet velocity waveforms before and after sand therapy were fitted according to the experimental data, as shown in Fig. 2. The vessel wall is an isotropic linear elastic material with a wall density of 1150, an elastic modulus of 5 MPa, and a Poisson’s ratio of 0.45 [23]. The reference pressure value in the computational domain is 13339 Pa [24], and the relative pressure at the outlet is 0 Pa [25], the contact surface between blood and the vessel wall is a non-permeable, non-slip boundary, and the collision between red blood cells and the vessel wall is a completely elastic collision.
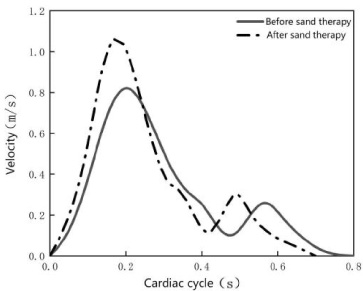
Popliteal artery inlet velocity before and after sand therapy.
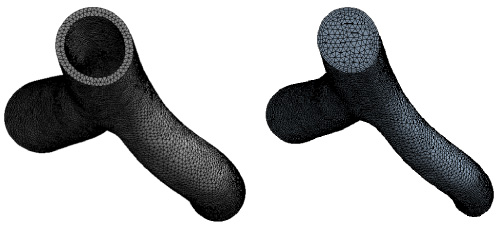
Mesh model.
When generating the computational mesh, a tetrahedral mesh was used to mesh the model with a cell size of 0.4 mm, and the mesh was encrypted near the contact between the blood and the vessel wall with three layers of encryption, and the mesh effect is shown in Fig. 3. In order to eliminate the influence of the initialization error on the calculation results, three consecutive cardiac cycles were calculated, and the calculation results of the third cardiac cycle were taken for analysis.
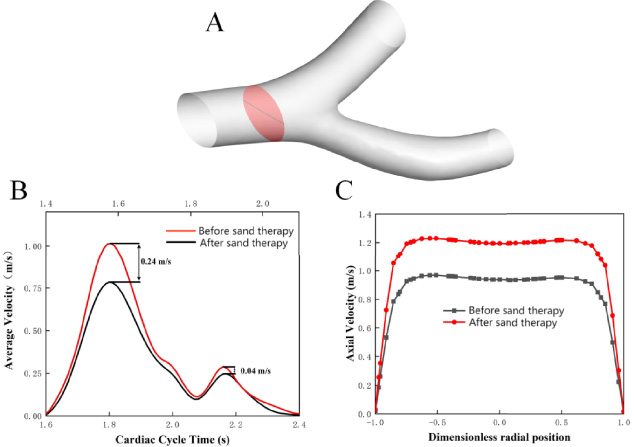
Blood flow velocity distribution. A: Schematic diagram of popliteal artery cross-section; B: mean velocity distribution of blood flow before and after sand therapy, subscript is cardiac cycle before sand therapy, superscript is cardiac cycle after sand therapy; C: axial velocity distribution of blood flow at peak systole.
Velocity of flow
Due to the increase in heart rate after sand therapy, the cardiac cycle decreased from 0.789 s to 0.6516 s [3], and to compare the changes in blood flow velocity after sand therapy, the mean velocity distribution of popliteal artery during the cardiac cycle before and after sand therapy was plotted as shown in Fig. 4B. The blood flow velocity increased after sand therapy, and at the peak of systole, the blood flow velocity was 0.78 m/s before sand therapy and 1.02 m/s after sand therapy, with an increase in blood flow velocity of 0.24 m/s. At the peak of diastole, the blood flow velocity was 0.25 m/s before sand therapy and 0.29 m/s after sand therapy, with an increase in blood flow velocity of 0.04 m/s. To facilitate comparison of the axial velocity distribution, the vessel diameter was normalized and the axial velocity distribution of the popliteal artery cross-section at peak systole was plotted as shown in Fig. 4C. The axial velocity of blood increased by 28.56% after sand therapy.
Figure 5 shows the flow diagrams of blood at characteristic moments before and after sand therapy, with flat and stable blood flow before and after sand therapy at peak systole and peak diastole. Figure 5B shows that unstable blood flow occurs at the vascular bifurcation and vascular outlet at the systolic trough, and Fig. 5D shows that blood flow velocity decreases with the prolongation of diastolic phase, and vortex flow occurs in the vascular bifurcation vessels before sand therapy and decreases in the bifurcation vessels after sand therapy.
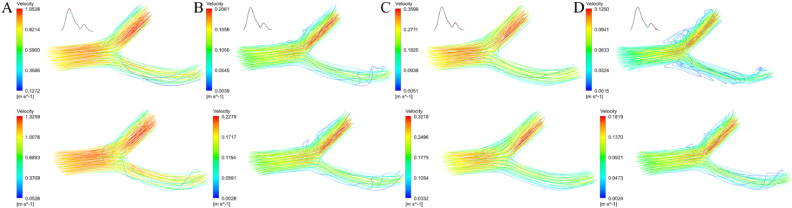
Comparison of flow lines before and after sand therapy. A: Blood flow line during peak systole (T = 1.80 s before sand therapy; T = 1.58 s after sand therapy); B: blood flow line during systolic trough (T = 2.07 s before sand therapy; T = 1.82 s after sand therapy); C: blood flow line during peak diastole (T = 2.16 s before sand therapy; T = 1.86 s after sand therapy); D: blood flow line during mid-diastole (T = 2.30 s before sand therapy; T = 2.0 s after sand therapy).
Figure 6 shows the variation of erythrocyte viscosity with radial position at the popliteal artery cross-section, which shows that the erythrocyte viscosity near the vessel wall is relatively low, and the erythrocyte viscosity in the central part of the vessel is high, reaching a maximum viscosity of 0.0052 Pa ⋅ s at a dimensionless radial position of about 0.5. The average erythrocyte viscosity decreased by 0.00014 Pa ⋅ s after sand therapy in the interval of −0.5 to 0.5 dimensionless radial position.
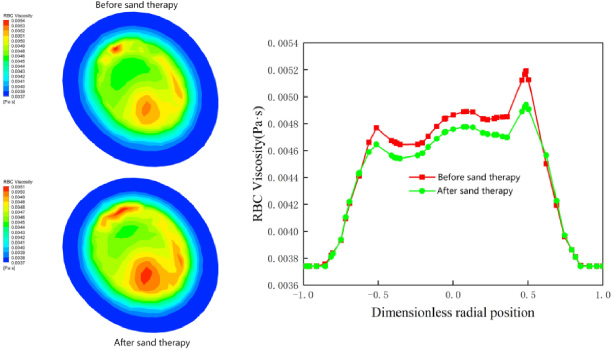
RBC viscosity of popliteal artery cross section.
In order to study the distribution of wall shear stress (WSS) in the vessel wall, 56 data extraction points were set along the vessel as shown in Fig. 7, with data points 1∼19 for the lateral anterior tibial artery, data points 20∼36 for the lateral posterior tibial artery, and data points 37∼56 for the medial branch vessel. The WSS at the peak of systole before and after sand therapy were extracted separately and plotted as shown in Fig. 7. The trend of WSS distribution before and after sand therapy was more or less the same, and the WSS increased after sand therapy, with a low WSS at the bending part of the vessel (Point6∼Point14 and Point26∼Point28) with a minimum value of 0.13 Pa (Point 27) before sand therapy and a WSS of 1.22 Pa after sand therapy. The maximum value was 30.39 Pa (Point 47) before sand therapy and reached 41.47 Pa after sand therapy.
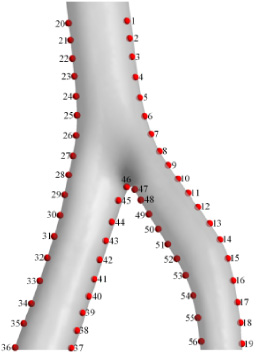
Distribution of data points.
WSS is an important parameter of hemodynamics, and researchers have further derived WSS-based parameters to describe different characteristics of WSS, such as Time-averaged Wall Shear Stress (TAWSS), Oscillatory Shear Index (OSI), and Relative Residence Time (RRT).
TAWSS refers to the average value of WSS over the entire cardiac cycle, while WSS is the tangential frictional force of blood flow on endothelial cells, which is decisive for the histophysiological changes of endothelial cells in the lesioned area and is generally considered to be a key factor contributing to atheromatous plaques. The distribution of TAWSS is more clinically significant than the transient wall shear. The mathematical expression is defined as:
OSI is the force at transient shear angles greater than 90° during the cardiac cycle and ranges from 0 to 0.5. Higher OSI values are thought to be determinants of the cyclic stresses that lead to functional deficits and altered cell structure in endocardial cells. The mathematical expression is defined as:
The calculation of RRT combines the WSS parameters and the OSI parameters to describe the relative residence time of the blood flow. Relative residence time is closely related to thrombus formation, with higher values of this value indicating a longer residence time and a higher probability of thrombus formation. The mathematical expression is defined as:
As a non-pharmacological therapy, sand therapy has been used for a long time to improve blood circulation, and for the study of sand therapy hemodynamics, Brgeby [26] analyzed the effect of sand therapy on femoral artery hemodynamics, which provided a theoretical basis for the subsequent sand therapy studies. Qiao et al. [3] analyzed the effect of sand therapy on hemodynamic parameters of different stenosis models of femoral bifurcation vessels and found that the trend of atherosclerotic plaque enlargement was attenuated after sand therapy. Based on this paper, the two-phase flow of blood and the non-Newtonian characteristics of Casson model were considered, and the physiotherapeutic mechanism of sand therapy on atherosclerotic diseases was further investigated to provide a theoretical basis for the prevention of atherosclerosis.
Figure 4B shows that the blood flow velocity increased after sand therapy, and the increase of blood flow velocity during systole was the largest, and the increase of blood flow velocity can promote blood circulation thus treating cardiovascular diseases caused by poor blood circulation, while the increase of blood flow velocity. Figure 4C shows that the blood flow velocity increases in the center of the blood vessel after sand therapy, and according to Bernoulli’s equation, the increase in blood flow velocity causes a decrease in pressure in the center of the blood vessel, and the substances in the blood that cause atherosclerosis (cholesterol, etc.) will move from the high-pressure area to the low-pressure area, i.e., from the vessel wall to the center of the vessel, reducing the atherosclerosis caused by excessive deposition of cholesterol and other substances on the vessel wall [27].
Figure 5 shows that during the diastolic phase, the flow velocity of the bifurcated vessels is low, the blood flow is disturbed, and the phenomenon of vortex and reflux is obvious, which tends to cause insufficient blood flow dynamics, and cholesterol and other substances in the blood will be stagnant and deposited in the vortex area, providing conditions for early atherosclerosis [28]. After sand therapy, the blood flow velocity increases and the vortex and reflux phenomenon decreases, and Fig. 5D shows that at the middle of the diastolic phase, the vortex disappears at the vascular bifurcation, which is conducive to reducing the accumulation of cholesterol and other substances, thus reducing the risk of atherosclerosis generation.
Figure 6 shows that the high viscosity of erythrocytes in the central region of the vessel is due to the fact that blood is a shear-thinning fluid with low viscosity at the wall surface velocity gradient and high viscosity at the center with a small velocity gradient [29]. The viscosity of erythrocytes in the central vascular region decreases after sand therapy, and according to Jung et al. the high viscosity zone tends to impede the flow of erythrocytes, causing them to migrate preferentially through the boundary layer, and the decrease in the viscosity of erythrocytes in the central vascular region after sand therapy facilitates the migration of erythrocytes from the vascular center, reducing the possibility of overcrowding of erythrocytes in the vessel wall leading to the formation of atherosclerosis [30].
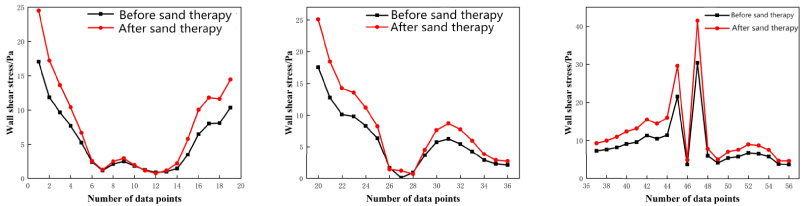
Wall shear stress distribution of popliteal artery.
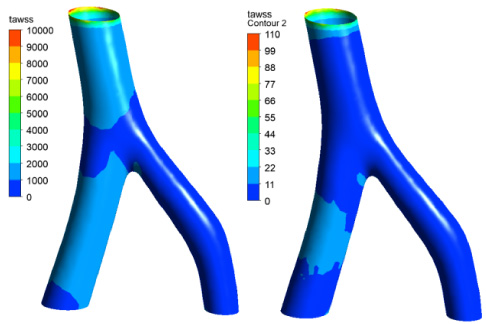
Comparison of TAWSS before and after sand therapy.

Comparison of OSI before and after sand therapy.
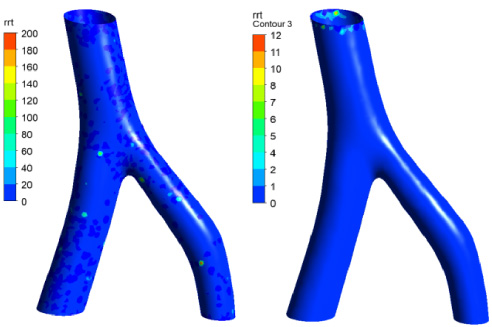
Comparison of RRT before and after sand therapy.
Figure 8 illustrates that the overall wall shear stress of the vessels experienced an increase subsequent to sand therapy. Atherosclerosis predominantly occurred in the low wall shear stress area as well as the high oscillatory wall shear stress area, where the vessels bend and bifurcate. This is because the low wall shear stress area can trigger intimal hyperplasia, causing harm to the vascular intima, and ultimately leading to the development of atherosclerosis [31]. In vitro studies [32,33] have also indicated that a shear stress of 1.0–1.5 Pa promotes the expression of arterioprotective endothelial genes, whereas shear stress below 0.4 Pa leads to an atherosclerotic phenotype. Moreover, following sand therapy, low wall shear stress levels increased from 0.13 Pa to 1.22 Pa, which may play a significant role in reducing vascular endothelial damage, promoting the expression of arterioprotective endothelial genes, and mitigating the occurrence of atherosclerosis.
Figure 9 shows that the maximum TAWSS value decreased after sand therapy and the area of high TAWSS decreased, which indicates that sand therapy reduces the occurrence of atheromatous plaques. Figure 10 shows that the OSI values decreased after sand therapy. As can be seen in Fig. 11, RRT values are reduced after sand therapy. Sand therapy decreases the probability of popliteal artery thrombosis by reducing the functional deficiency of endothelial cells and altering the cytoarchitectural cyclic stress.
This paper presents a computational study of flow-solid coupling using a two-phase flow-Casson model in a realistic vascular model of the human popliteal artery. Haemodynamic parameters were obtained before and after sand therapy, and conclusions were drawn that provide a theoretical foundation for the biomechanics of atherosclerosis prevention. The increase of blood axial velocity after sand therapy can promote the movement of cholesterol and other substances toward the center of blood vessels and reduce the risk of the development of atherosclerosis caused by excessive deposition of cholesterol and other substances on the surface of blood vessel walls. The reduction of vortex flow at the bifurcated blood vessels after sand therapy helps to reduce the accumulation of cholesterol and other substances. The reduction of erythrocyte viscosity in the center of the vessel after sand therapy facilitates the migration of erythrocytes from the center of the vessel. The increase of low wall shear stress after sand therapy can reduce the occurrence of atherosclerosis. The decrease of time-averaged wall shear stress, shear oscillation index and relative retention time after sand therapy can reduce the occurrence of thrombosis.
Footnotes
Conflict of interest
None to report.
Funding
This research was financially supported by the National Natural Science Foundation of China (no. 31460245).