
Abstract
During the past few decades, nondestructive damage evaluation (NDE) techniques are widely applied in industries, such as architecture, power plant equipment, and mechanical manufacture, etc. non-destructive damage detection techniques being applied to experimental data where it becomes a hotspot and challenging matter. Each of the NDE methods developed to date can be classified into different levels according to their performance and application. This paper will focus on the application of a Two Points -Condensation (TPC) technique. The TPC technique this method detect the damage based on vibration. The TPC technique reduces the structural system to two degrees of freedom system. The current stiffness matrices obtain from optimization the equation of motion of two degree of freedoms system using the measured test data. The current stiffness matrices compare with original (undamaged) stiffness matrices. The large percentage changes in matrices’ coefficients lead to the location of the damage. The improvement occurs in the reduction method, where the static condensation method replaced by the system equivalent reduction expansion process (SEREP) condensation method that provides a dependable result. The method allows fewer sensors than those required in the mentioned methods. The technique is applied to the experimental data of a steel truss bridge model structure after inducing the damage by removing an element from the specimen. The results show that the method detects the damage location area.
Introduction
Recent the needing for rapid assessment of the performance and safety of civil structures such as bridges have amply demonstrated due to the natural disasters. The ability to monitor the structural integrity of these systems is becoming increasingly important. During the past decades, several studies have addressed non-destructive damage evaluation (NDDE) via changes in the dynamic modal responses of a structure [2].
Structural health monitoring (SHM) for civil engineering applications is taking improvement of the latest technologies in sensors and data analysis methods to protect civil infrastructure and preserve life safety. SHM consists of damage diagnosis and residual life prognosis. The aim of damage diagnosis is to detect, localize, and quantify structural damage arising from a variety of sources, including long-term degradation such as corrosion and short-term events such as earthquakes, and then to inform decision-makers about the proper responsive action [3].
The present study proposed vibration-based structural damage detection procedure called TPC technique using of a time-domain analysis. The method creates a set of matrices by reducing the structural system to two degrees of freedom systems using the static condensation. The equation of motion is optimized to find the best stiffens matrix values fitting the equation where this stiffness matrix called current stiffness matrix. The TPC technique uses the measured test data for optimization. The current stiffness matrices compare with original (undamaged) stiffness matrices. The large percentage changes in matrices’ coefficients lead to the location of the damage.
In this study, the TPC technique is used where the Identified stiffness matrices compare with original (undamaged) stiffness matrices. The system equivalent reduction expansion process (SEREP) method is used for reducing the system global matrix instead of the static condensation.
Two points-condensation (Tpc) technique
TPC technique is an analytical method that detects the damage by observing the value of changes in the stiffness coefficients. The technique compares the reduced theoretical stiffness matrix (K r ) with the Identified stiffness matrix (K c ). The theoretical stiffness matrix (K o ) is obtained using the as-built drawings of the structure. The reduced theoretical stiffness (K r ) is generated by condensing the theoretical stiffness matrix (K o ) to 2–DOF stiffness matrices. The selection of these 2–DOF depends on the location of accelerometers on the structure these DOF should be chosen according to the DOF that measures its vibration signal.
In this technique, the SEREP method is used for condensation. The SEREP condensation has the best performance and less error in identification of stiffness values [1].
In TPC technique calculate the Identified stiffness matrices (K c ) matrix by finding the optimal solution of the equation of motion (1) so that the optimal solution should satisfy the system real properties.
Where:
K: The stiffness matrix of the system.
M r : Reduced mass matrix of the system.
C: Damping Matrix of the system.
ü: The acceleration vector.
u: The displacement vector.
In this technique, the input data includes the reduced mass matrix (M
r
) and initial stiffness matrix (K
r
) in addition to the corresponding vectors of acceleration (ü), velocity (
The technique uses the theoretical mass matrix of the structure because it does not change mostly (Prashant et al. 2010). Damping matrix (C) is calculated according to Rayleigh damping. The damping matrix is optimized due to the stiffness updating.
The multi-objective solver is used to optimizing the equation of motion. Multi-objective optimization is a mathematical optimization problem which is dealing with more than one objective functions to be optimized simultaneously. In this study for TCP technique, a multi-objective optimization technique is used to minimize the function (2).
The optimization uses the measured test data. The measured data that use is the acceleration signals. The acceleration signals (ü) are integrated to get the velocity signals (
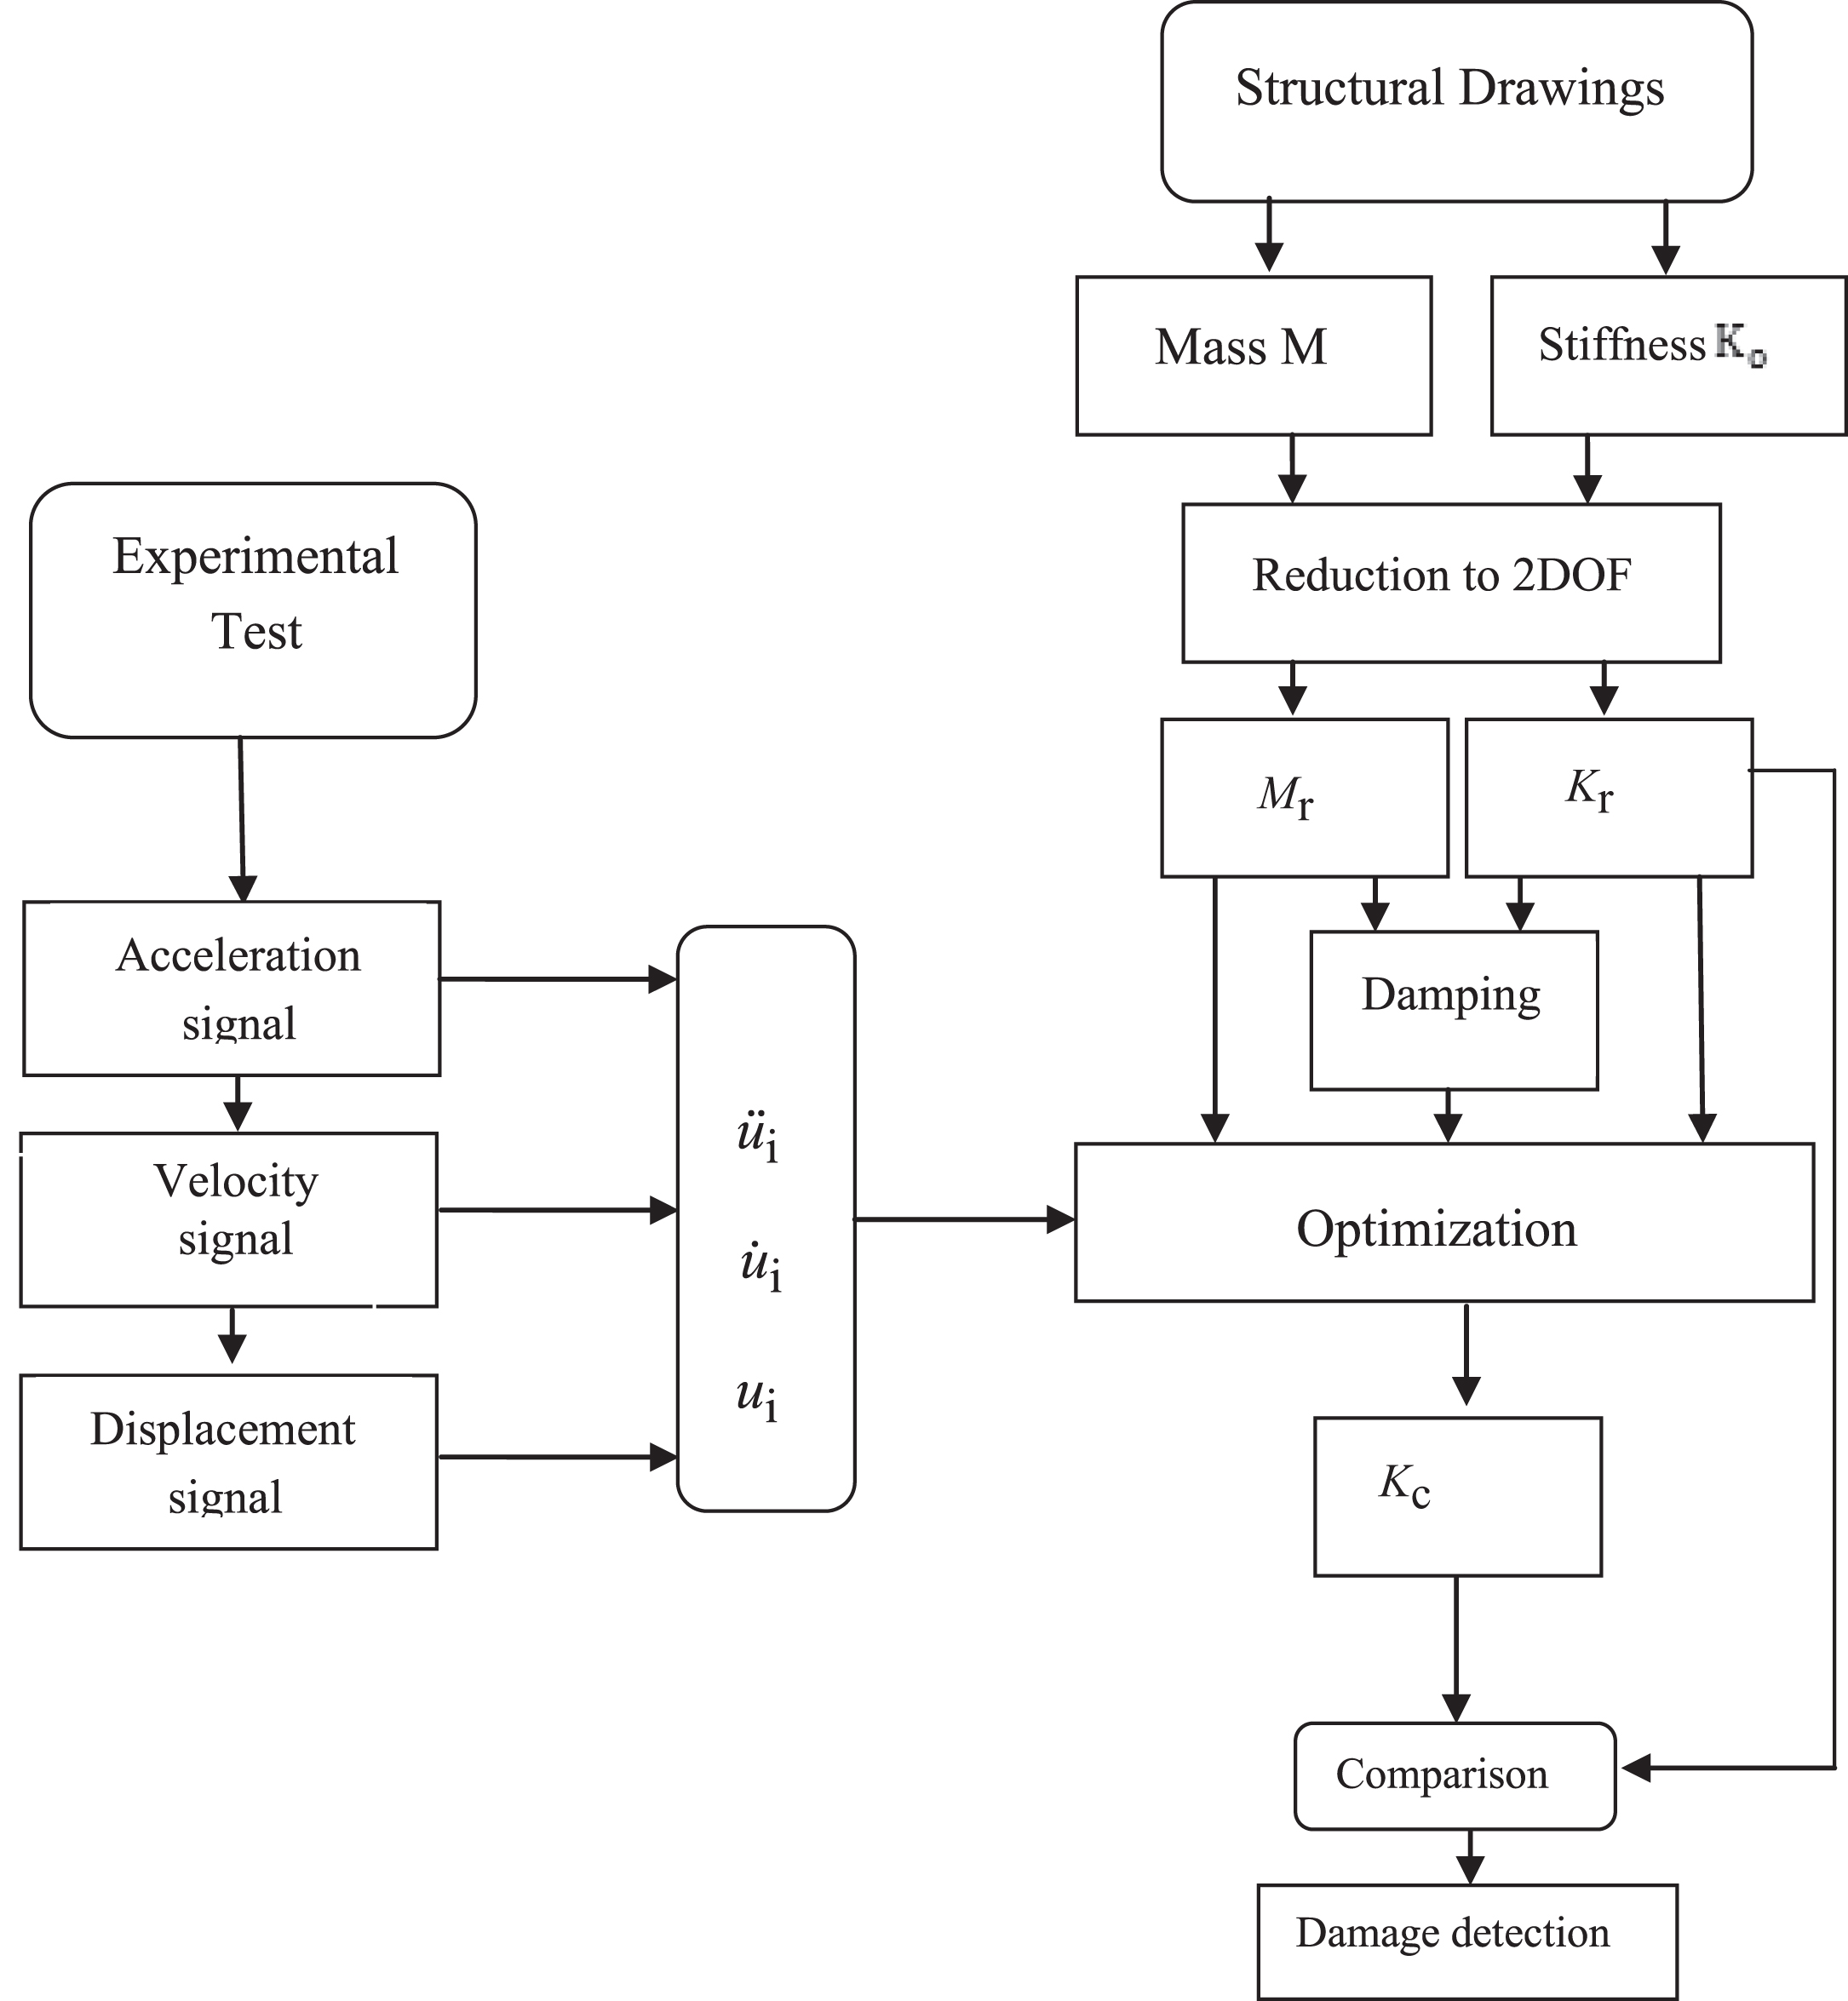
The main steps of the TPC technique.
Truss Bridge Description: A steel truss bridge structure is designed and fabricated as shown in Fig. 2 and 3. The bridge is simply supported with a span of 6 meters. The density is 7.85×10⁻⁵ N/mm3 and Young’s modulus E is 205900 Mpa. The bars connected together using bolts. The bridge a sampled using three types of hollow bars:
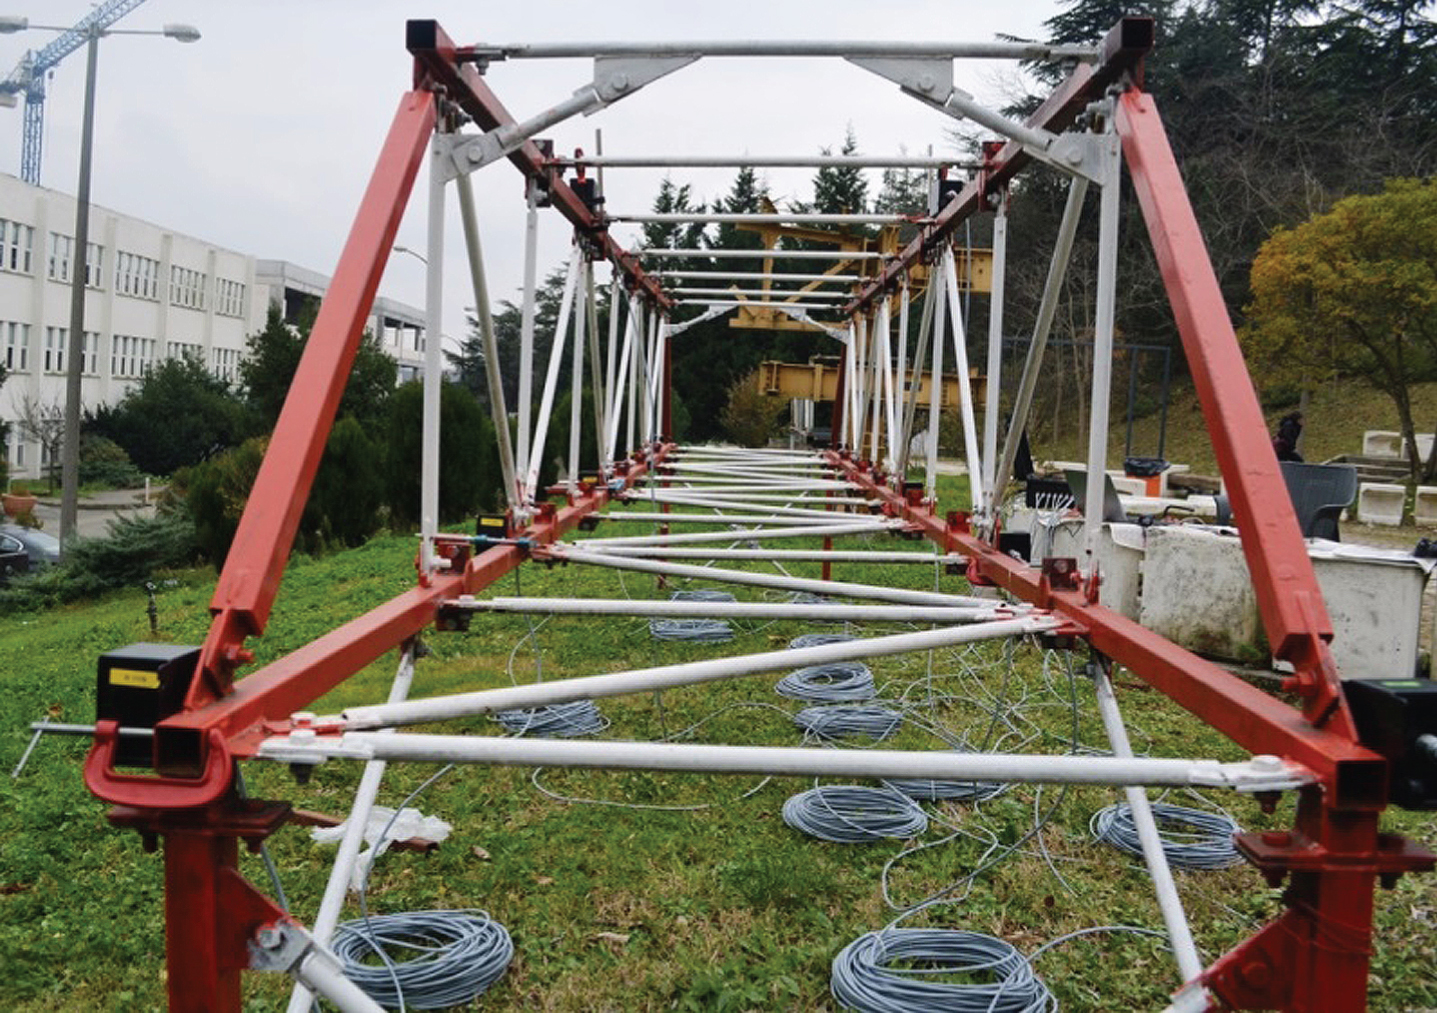
Steel 6 m span bridge with sensors.
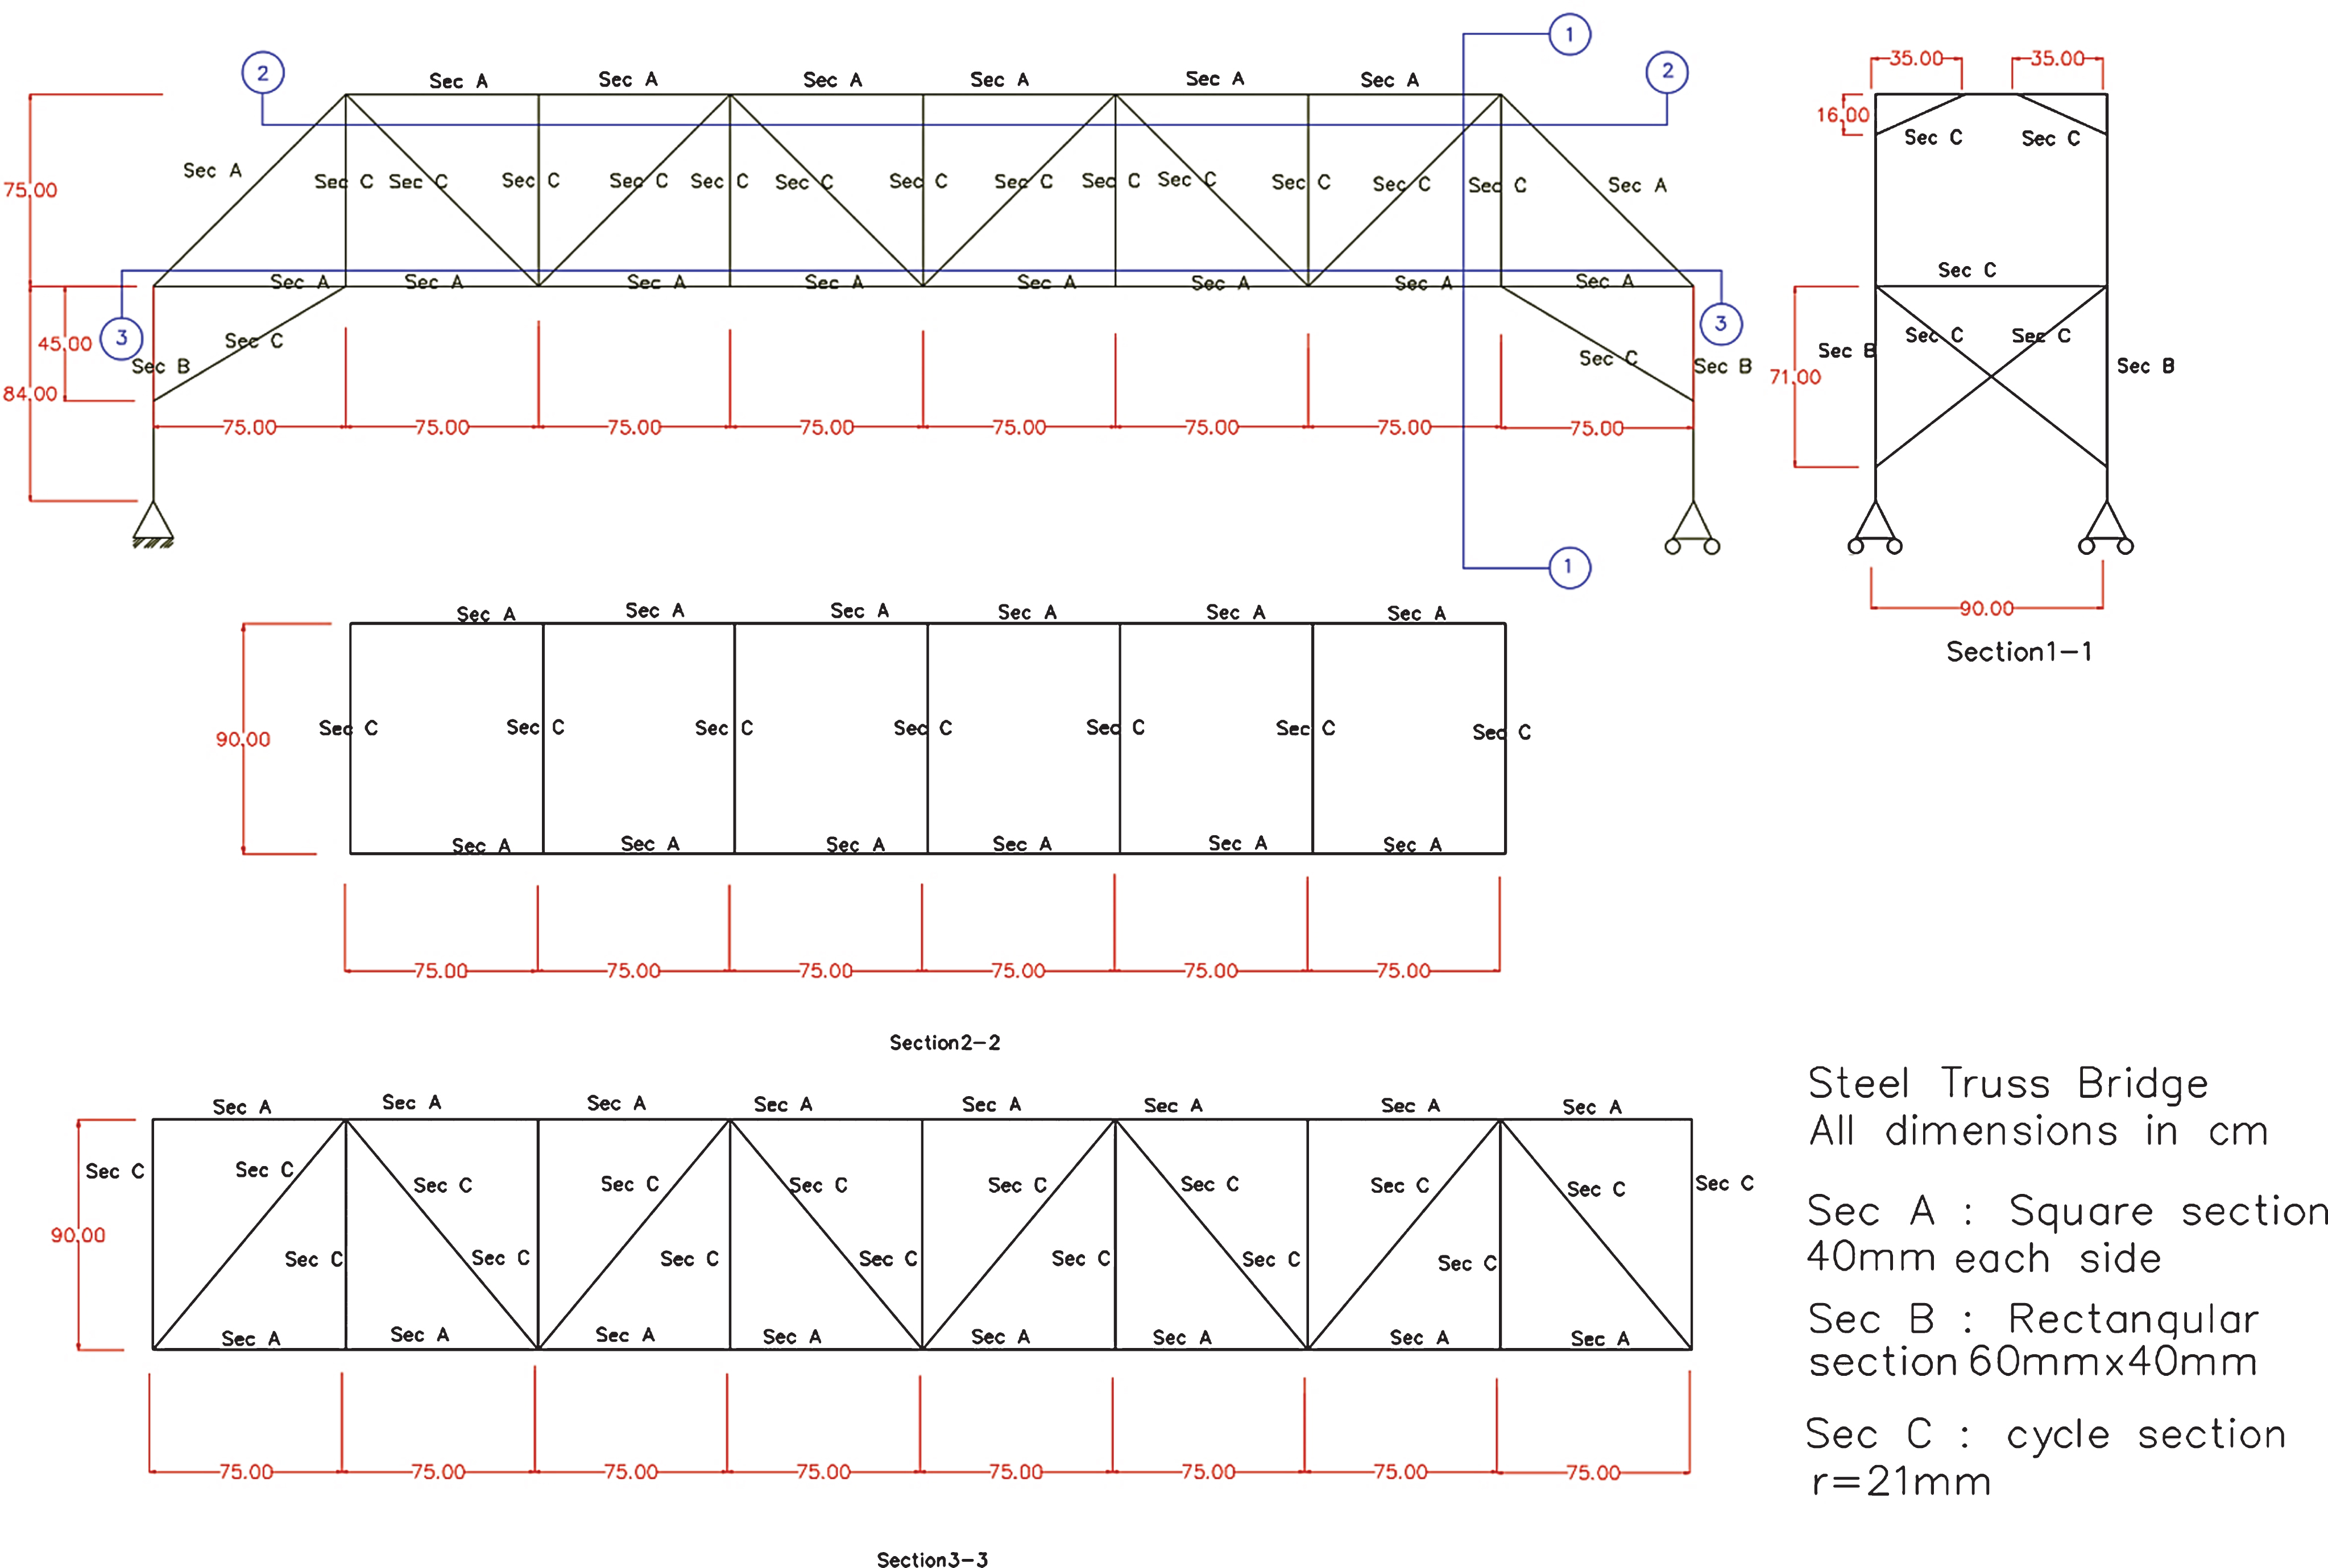
A steel truss bridge structure.
Section-A is a square section 40 mm×40 mm the thickness is 2 mm.
Section-B is a rectangular section 60 mm×40 mm the thickness is 2 mm.
Section-C is a cycle section the diameter is 42 mm and the thickness is 2.5 mm. As shown in Fig. 3.
For test 12 accelerometers are used. The layout of the accelerometer is shown in Fig. 4, the “Sen” represents the accelerometer. The mass of the accelerometer is 0.88 kg (including the clamping apparatus for connections), where these masses are added to the global mass matrix of the system as lumped mass just at the nodes where the accelerometers are located. Figure 5 shows the steel bridge and the test instruments. The accelerometers measure the vertical acceleration of the node that located in it.
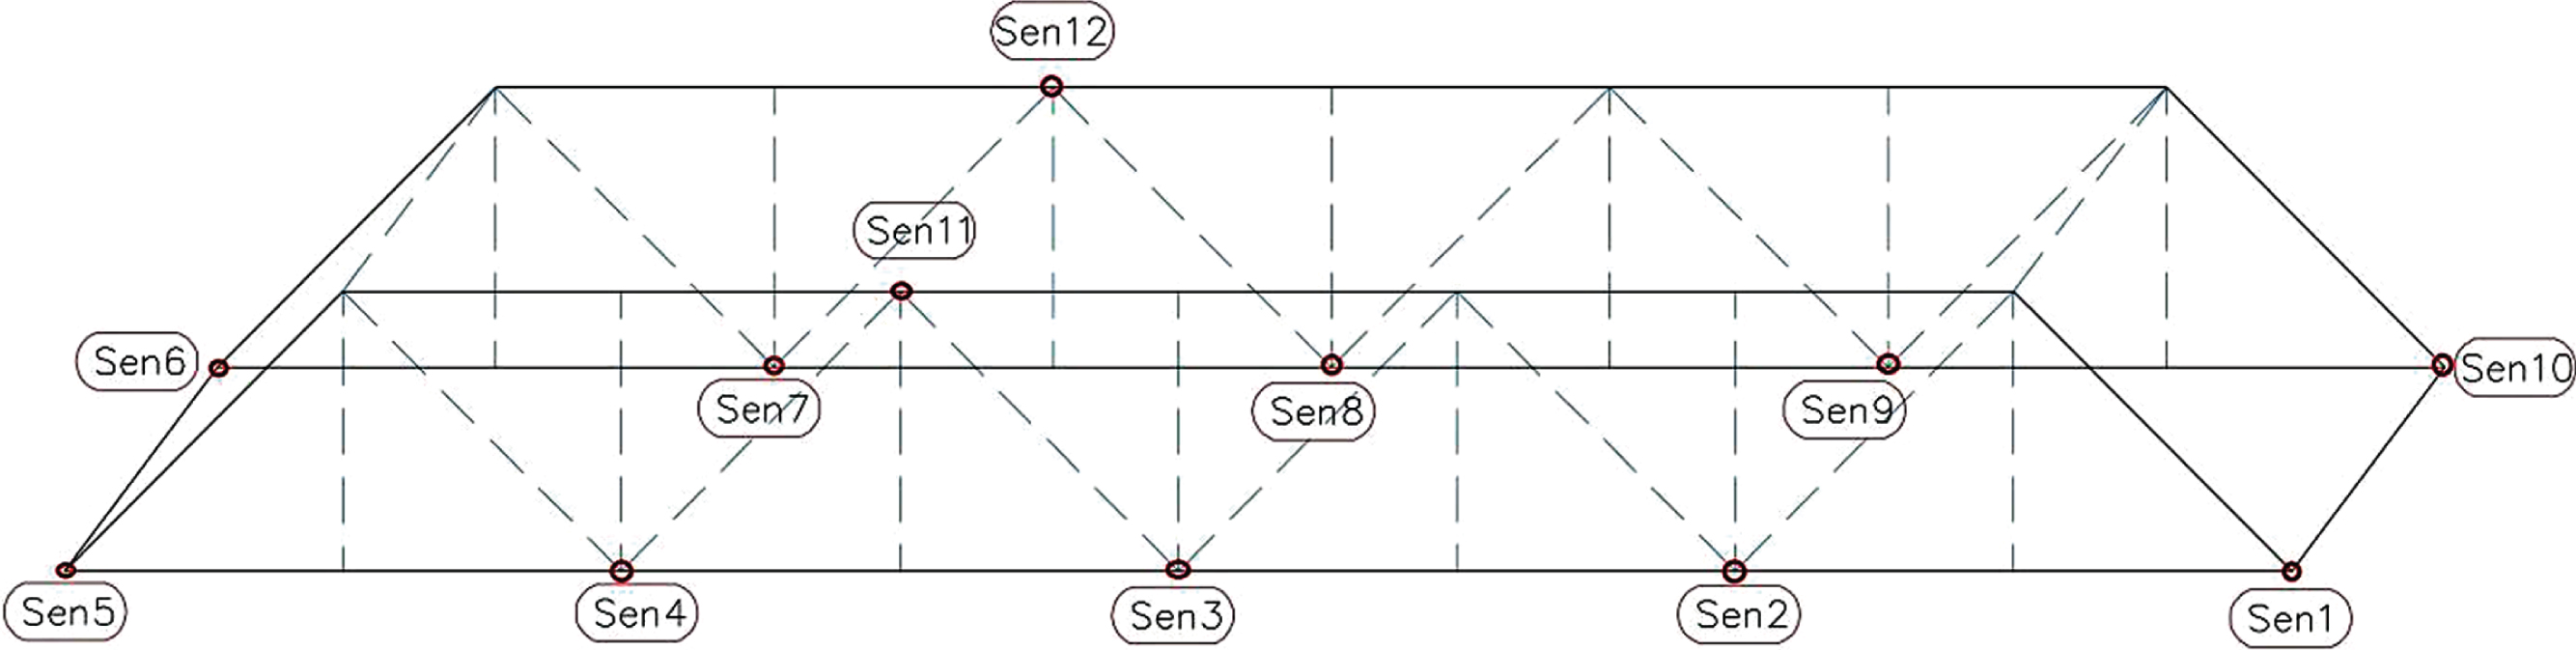
Layout of 12 accelerometers.
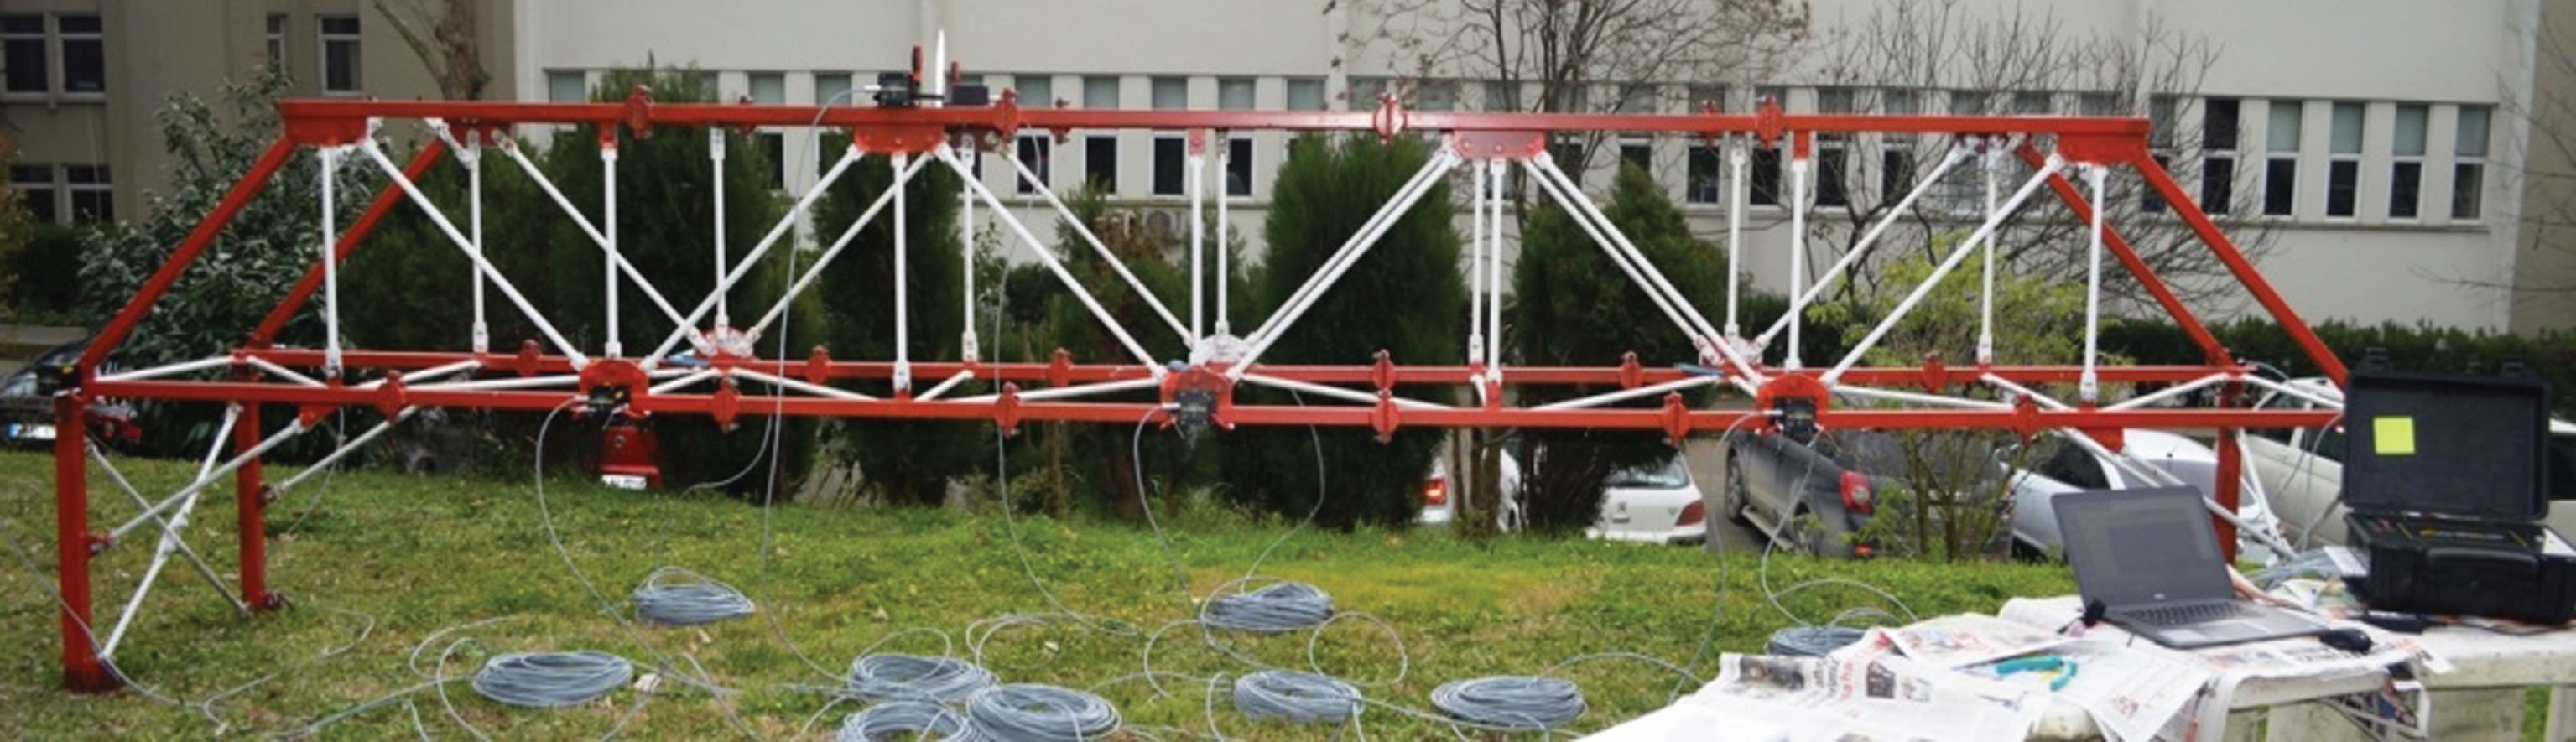
Layout of 12 accelerometers and test instruments.
In order to simulate structural damages, four damage scenarios are set up by removing members as shown in Fig. 6.
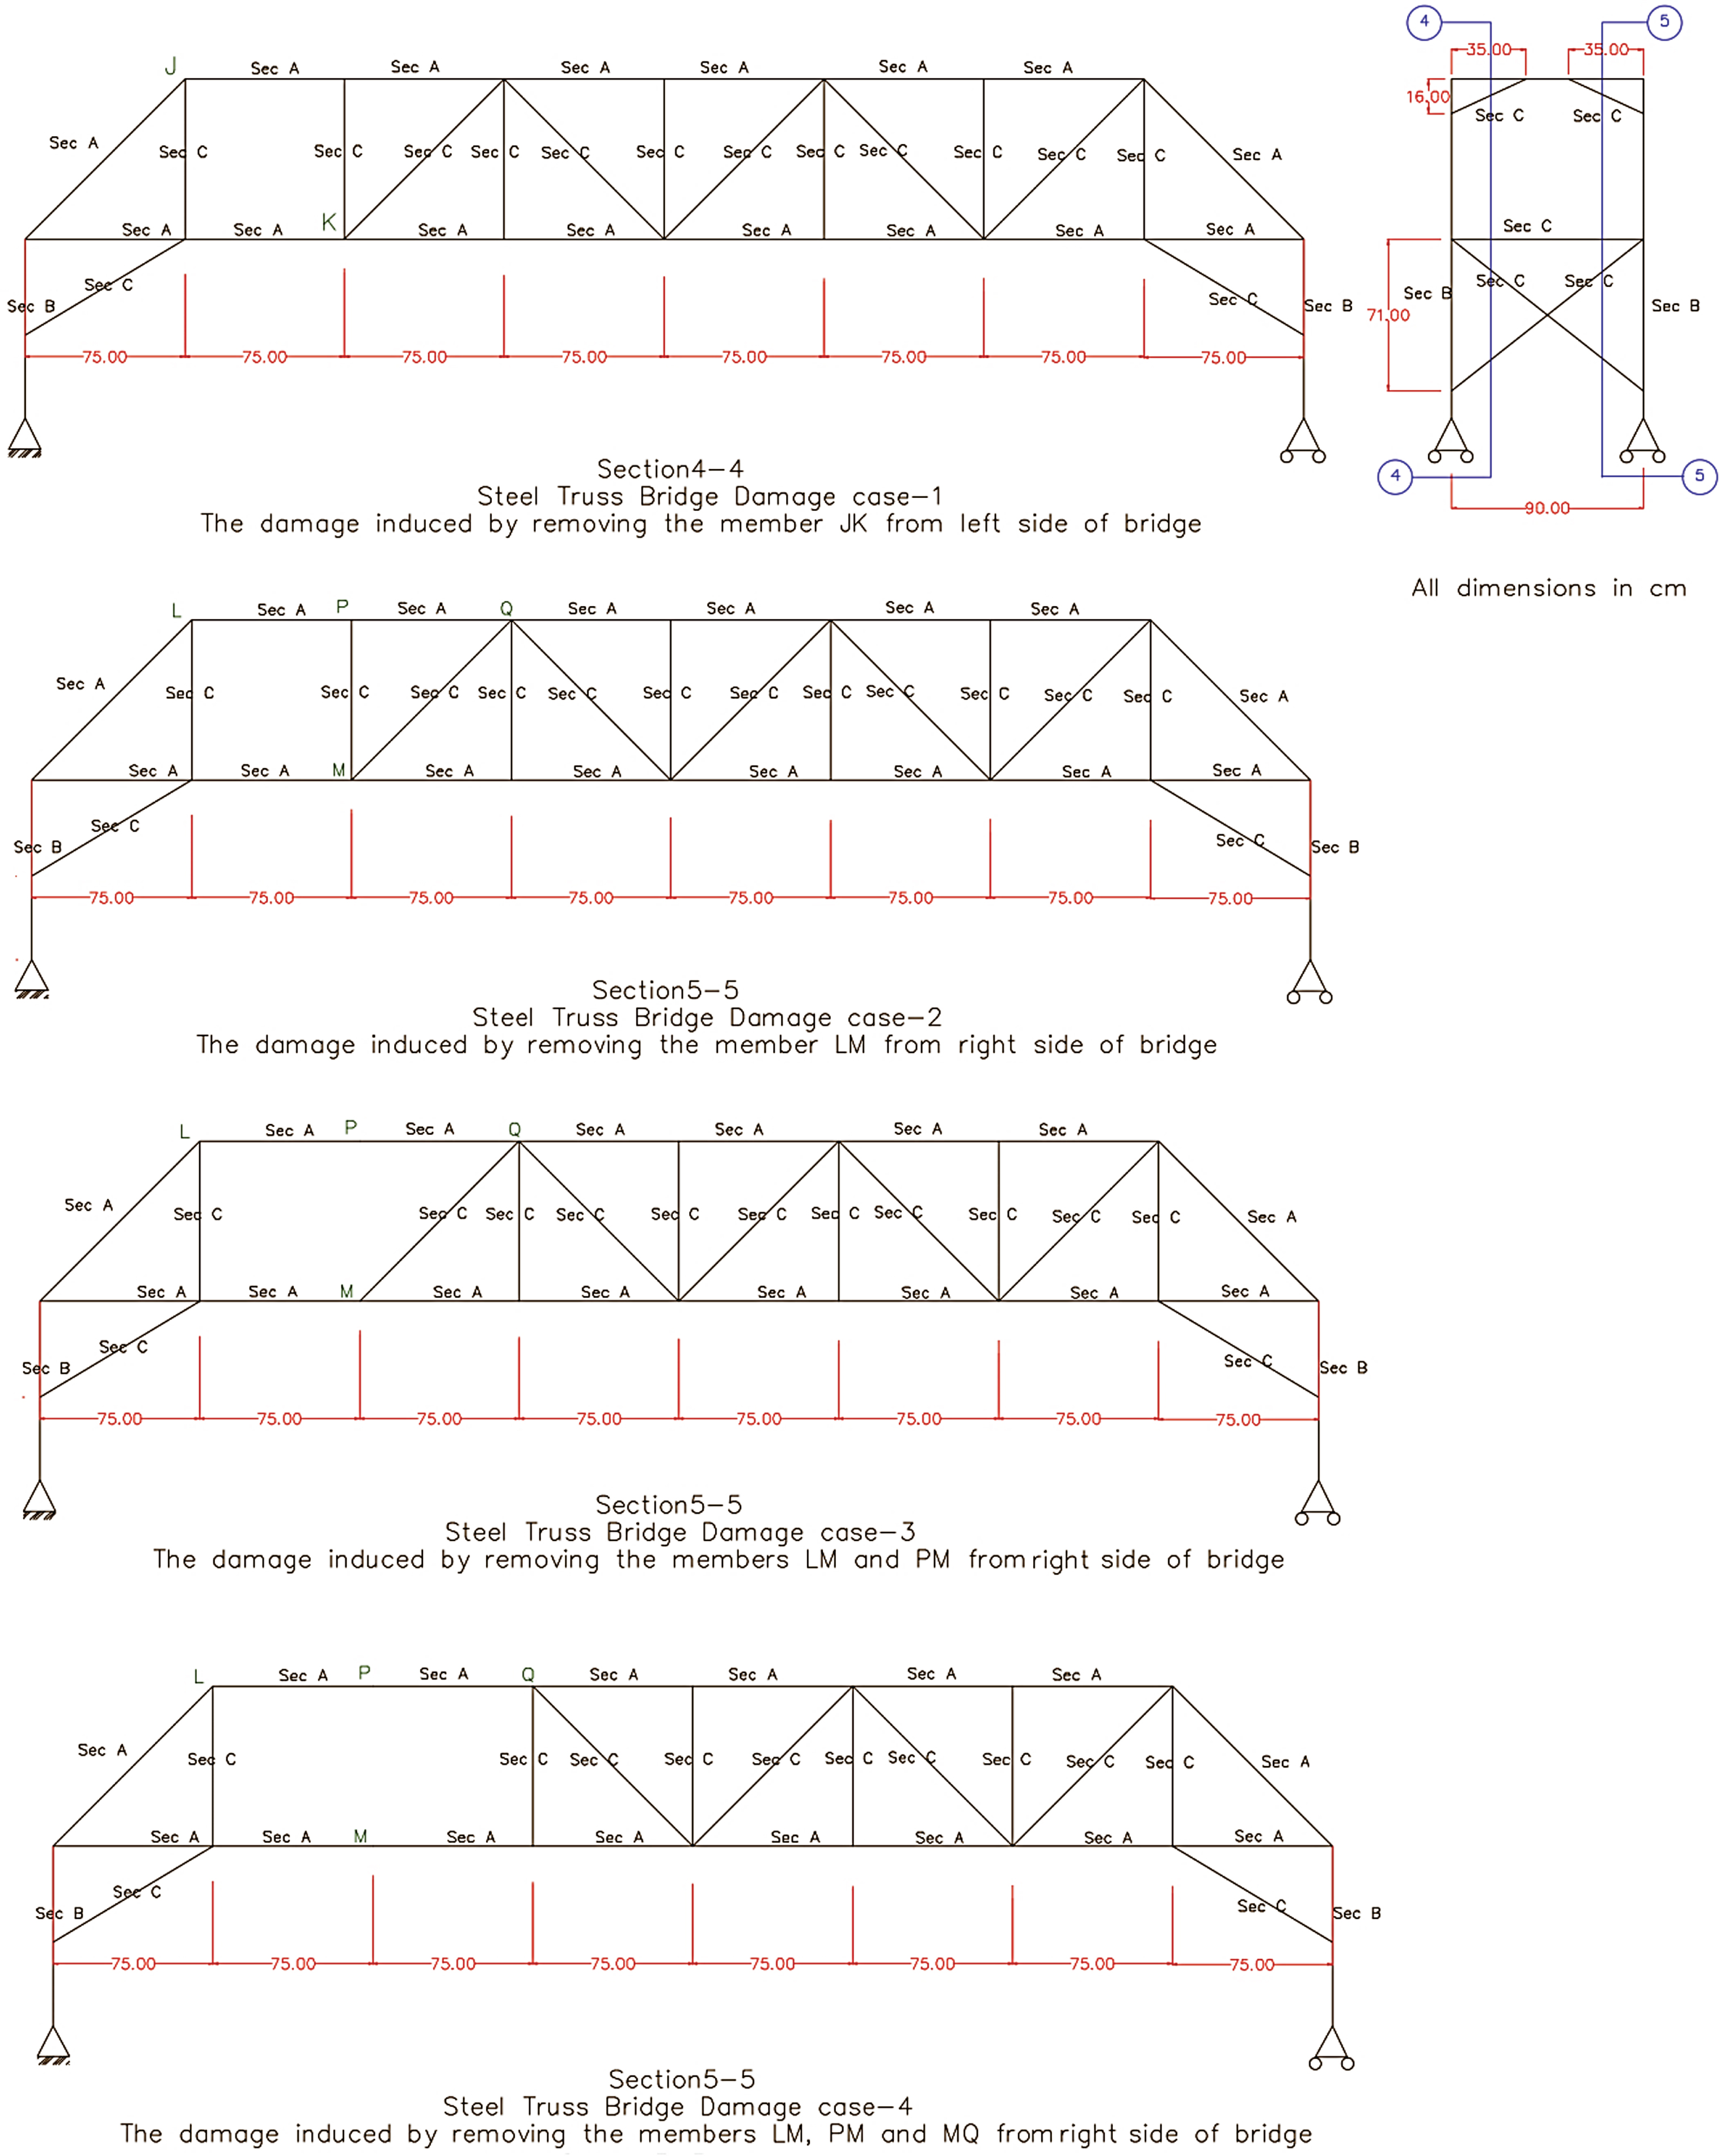
The structural damage cases.
The first damage is introduced to the system by removing the member JK from the left side of the bridge. The second case generates the damage by fix the JK member back to the left side and removed the member LM from the right side. In third damaged case the member PM removed in addition to the member LM. The last case damage is stablished by removing the members Lm, PM and LQ as shown in Fig. 6.
The truss bridge is excited by pullback-quick release method by tying a rope to the middle of beam span, and then cutting it after having pulled it down, the sampling rate that used is 500 Hz. Figure 7 shows the acceleration signal that captured for the undamaged case.
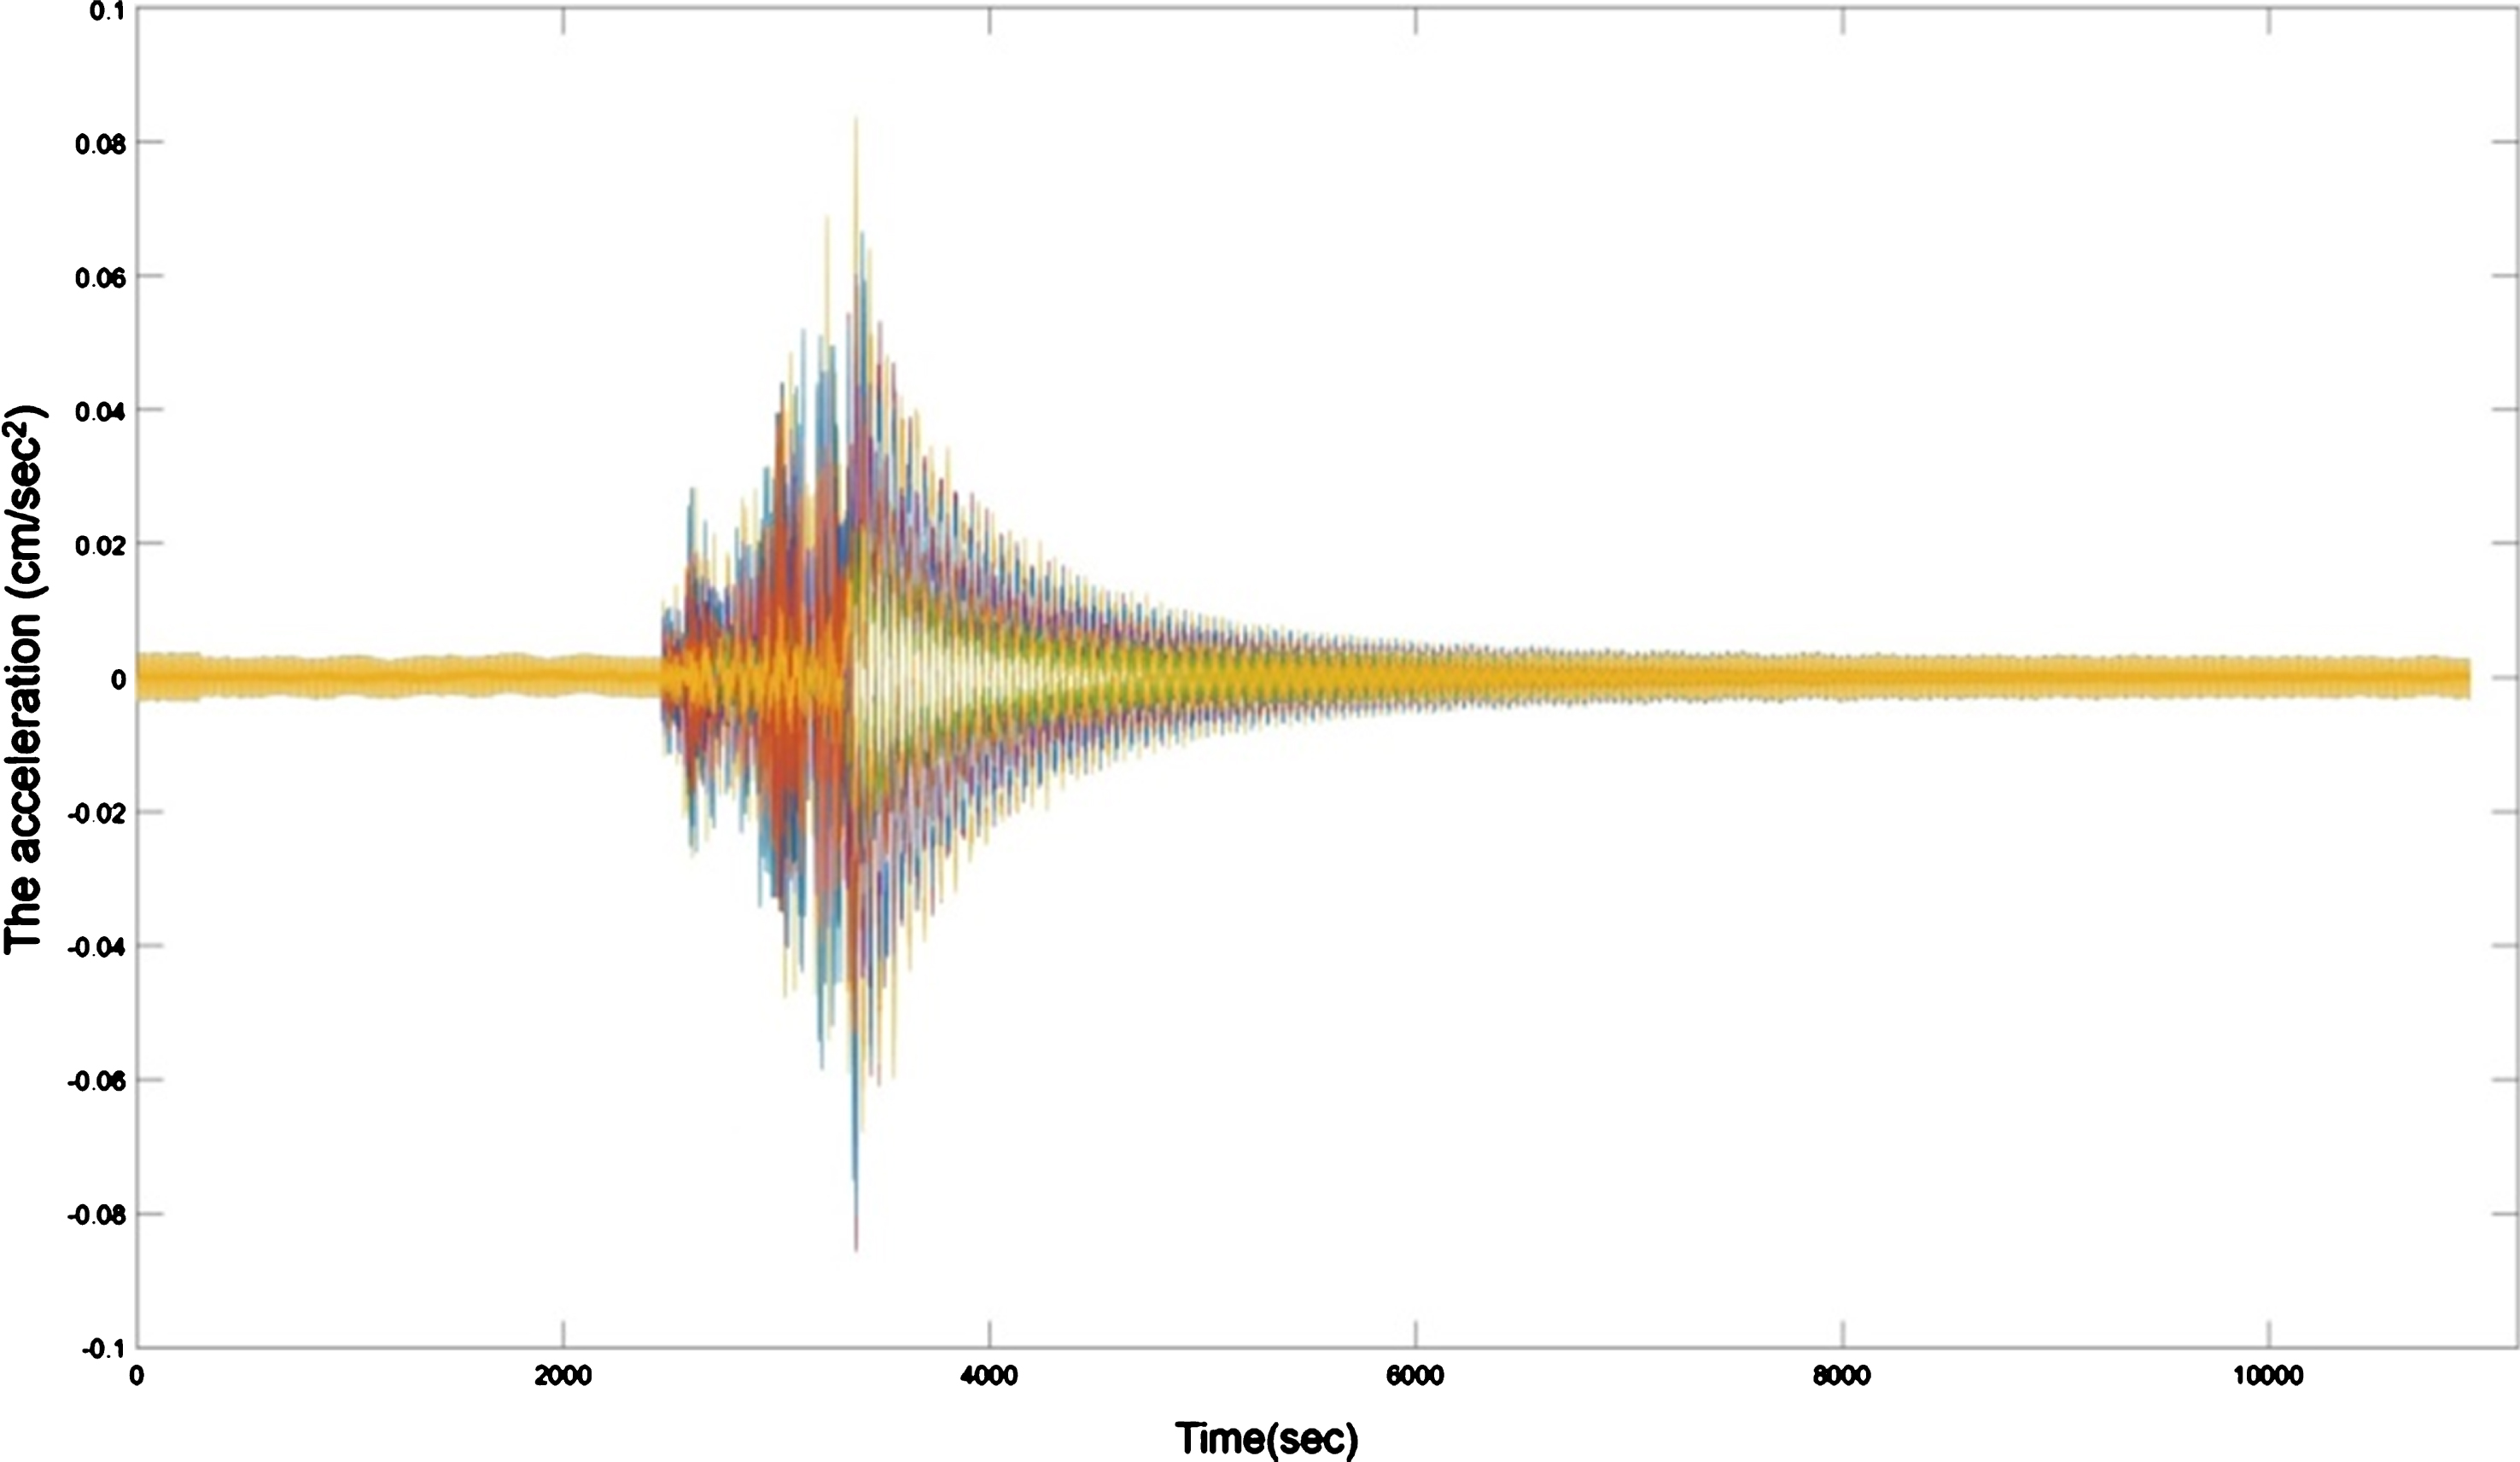
The acceleration signal of 12 channels for the undamaged case.
The velocity is obtained by integrating the acceleration signals using the trapezoidal method. The signals used as input in optimization function. The first two frequencies are recording in order to control the solution the optimization result. Figure 8 represents the Fourier Spectra of the signal.
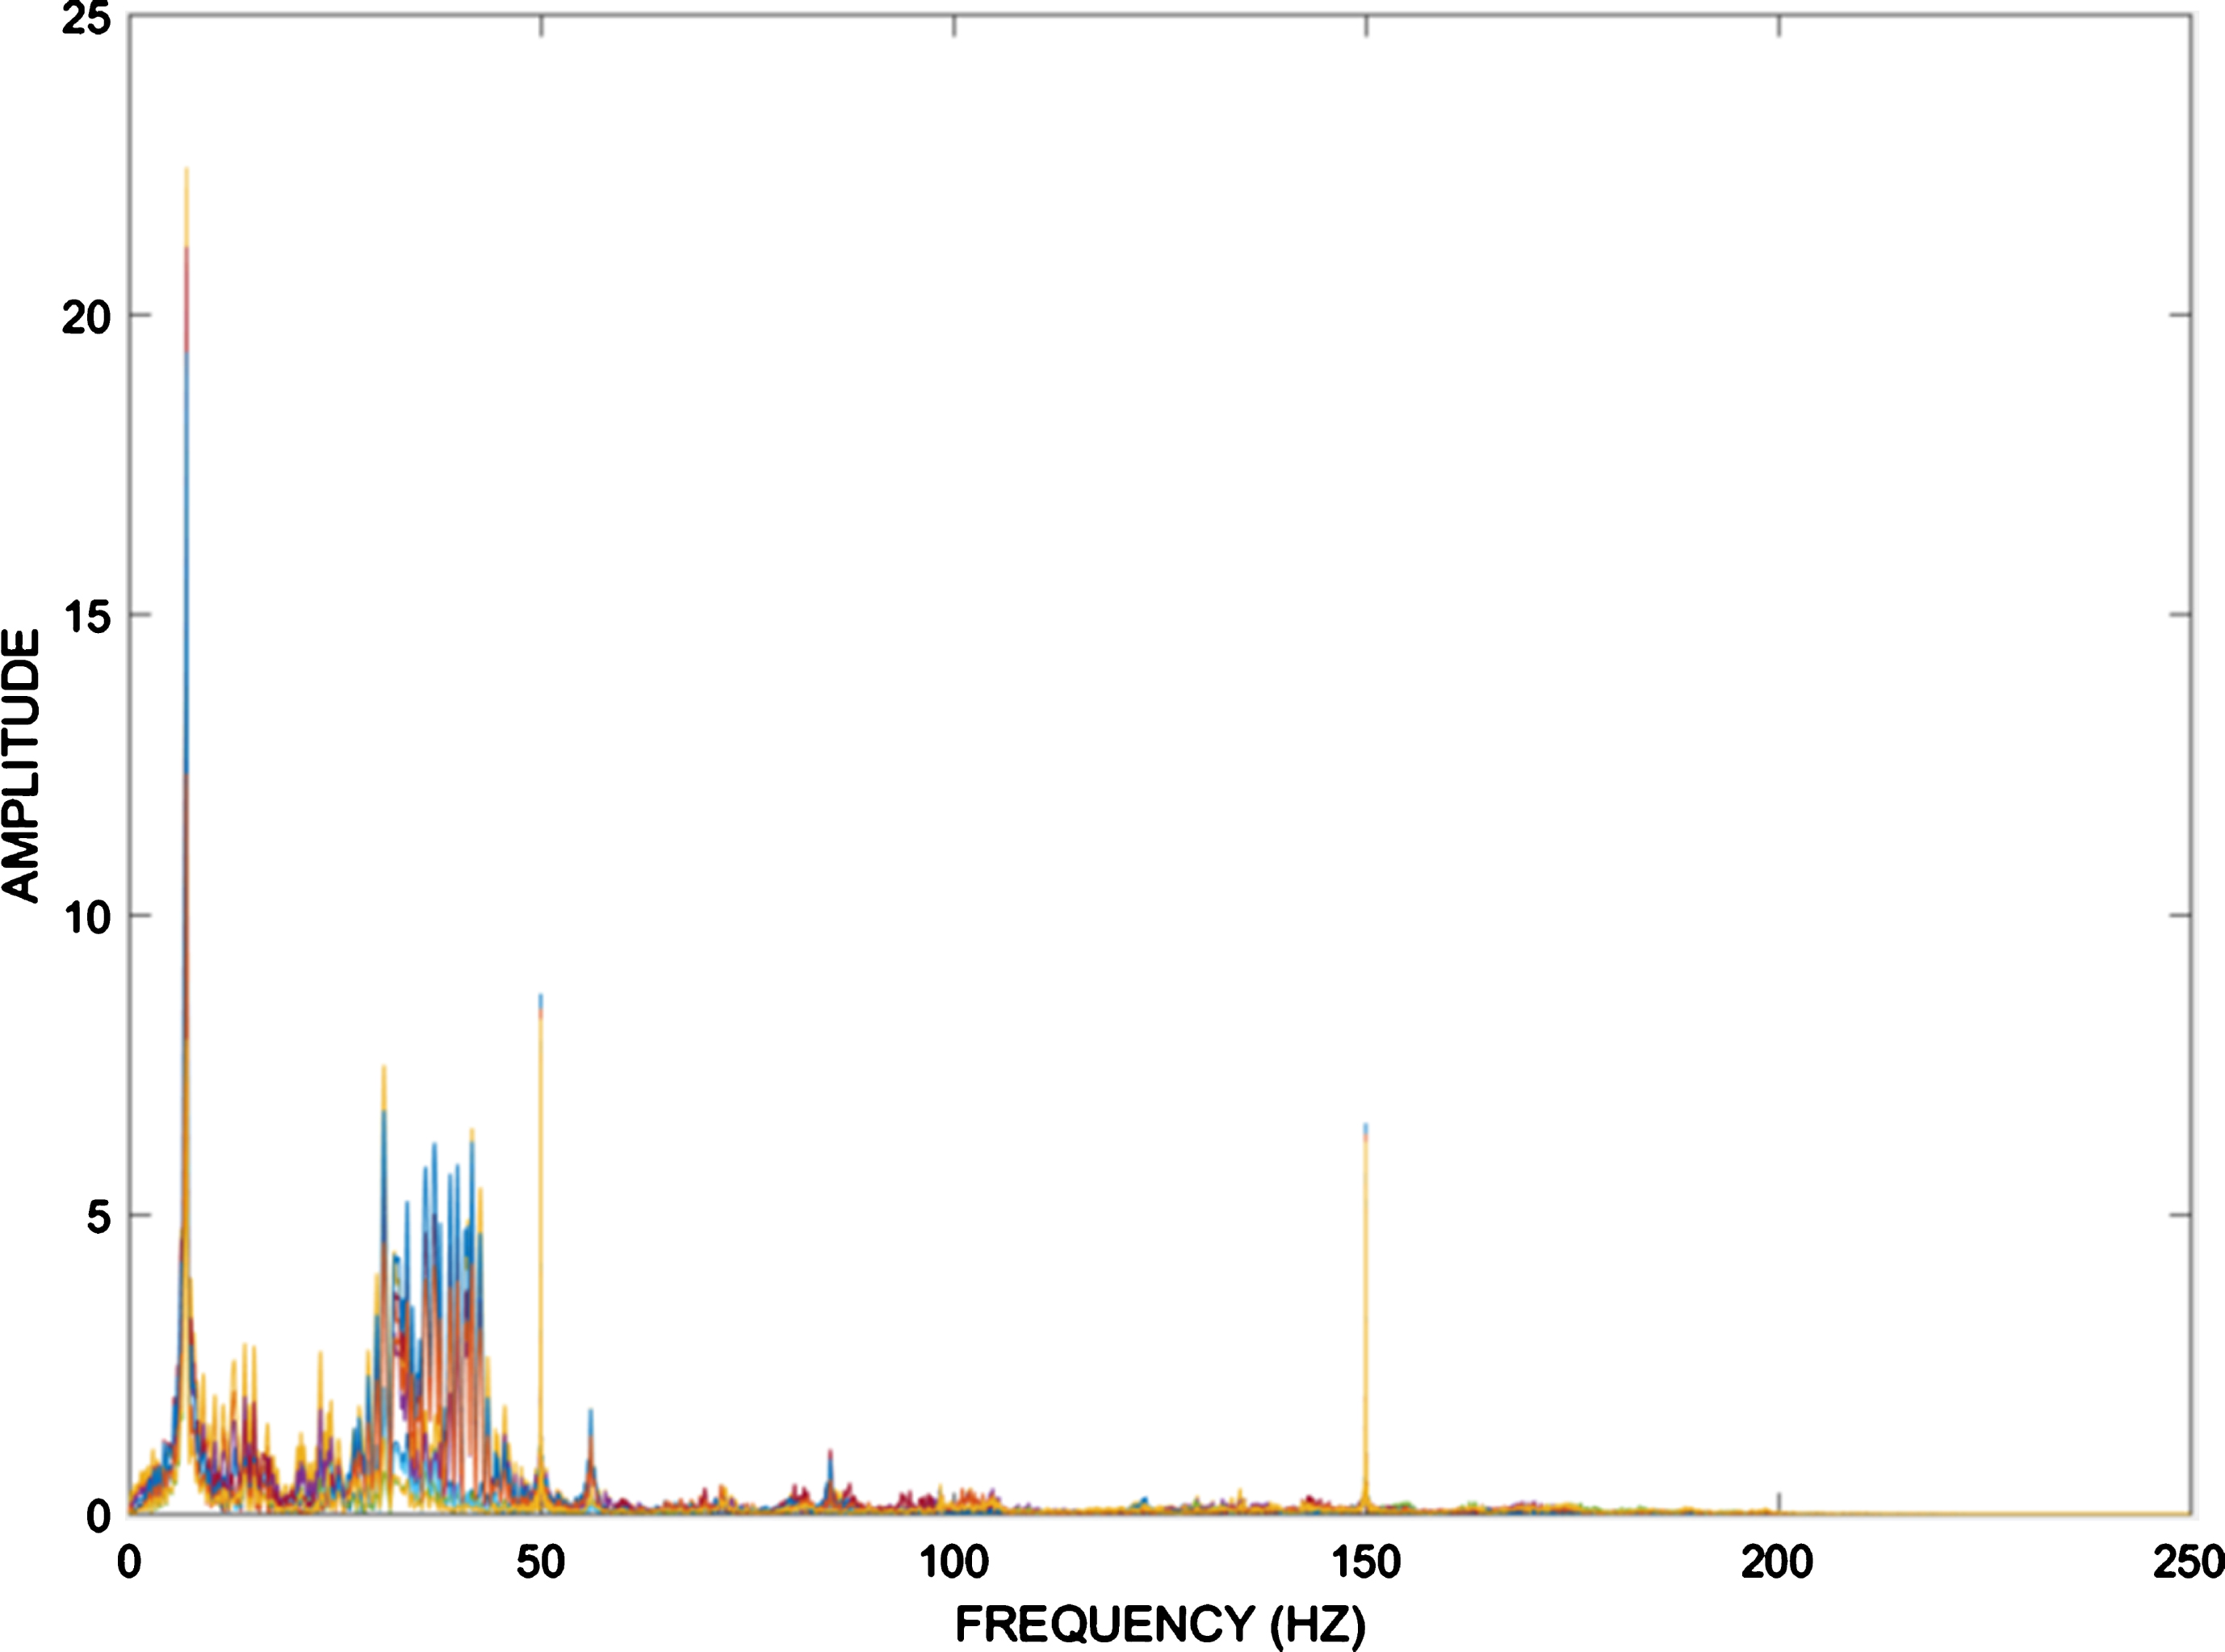
The Fourier Amplitude Spectra.
The DOFs that consider for reduction are shown in Fig. 9. The DOFs v1, v2, v3, v4 and v5 in the side 4–4 while the DOFs v6, v7, v8, v9 and v10 in the side 5–5. The accelerometer sen1, sen2, sen3, sen4, sen5, sen6, sen7, sen8, sen9, sen10, sen11 and sen12 measure the vertical accelerations of the DOFs v1, v2, v3, v4, v5, v6, v7, v8, v9, v10, v11 and v12 respectively. The TPC technique required to selecting two DOFs on each side in order to locate the location of the damage in which part of the side.
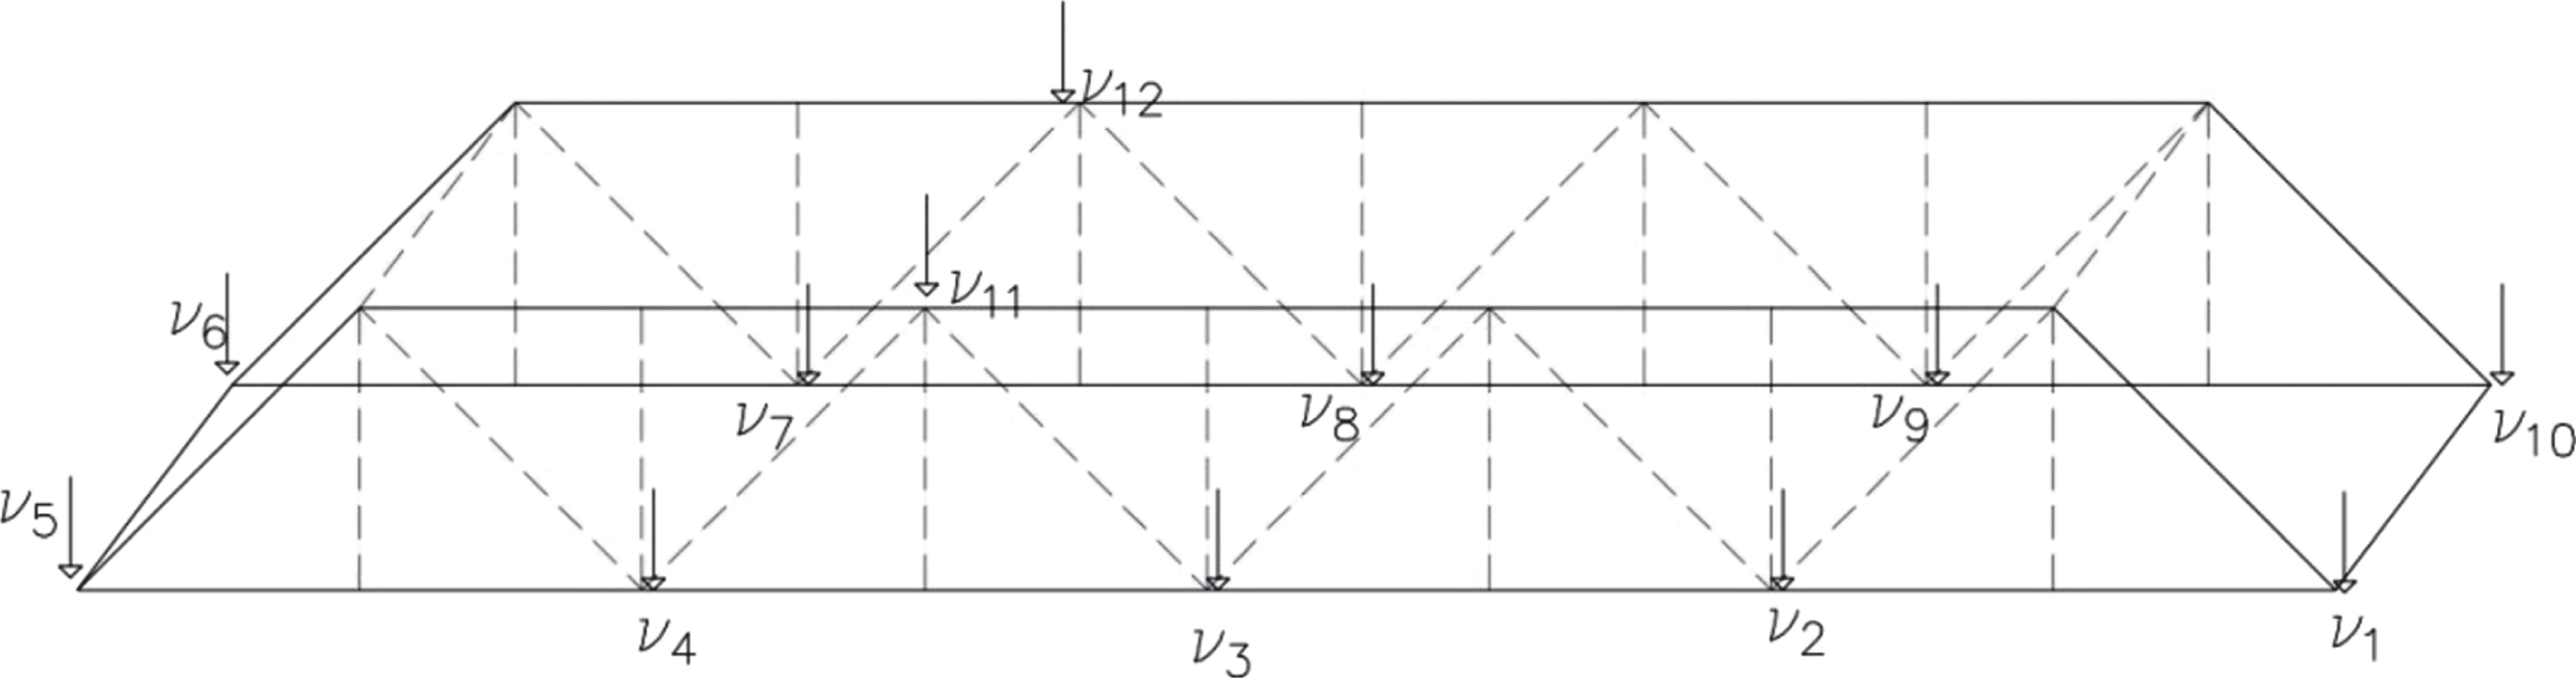
The DOFs that consider for reduction.
The comparison of calculated stiffness matrices (K c ) and reduced theoretical stiffness matrices (K r ) helps to find out, where the location of damage. Large changes in the stiffness coefficients of the two degrees of freedom matrices imply the location of the damage. Assuming the equation (3) the changes in the stiffness matrix using (TPC) is represented:
Where:
ΔKij: The changing matrix of set DOFs i and j.
ΔKii: The difference in coefficients of the K c matrix and K r matrix at position (1, 1).
ΔKij: The difference in coefficients of the K c matrix and K r matrix at position (1, 2).
ΔKji: The difference in coefficients of the K c matrix and K r matrix at position (2, 1).
ΔKjj: The difference in coefficients of the K c matrix and K r matrix at position (2, 2).
By comparing ΔKii with ΔKjj, it can indicate the location of the damage due to the large change. If the change in K ii is greater than the change of K jj then it means that the damage is located near to the node i.
For the first damage case, the global stiffness matrix reduced to DOFs v2, v4 to locate the damage in the section 4–4 see Fig. 5. The set of the DOFs v7, v9 selected for reduction to check the location of damage in the section 5–5 (see Figure). In addition, select the set of the DOFs v11, v12 to indicate the damage in which side 4–4 or 5–5. Table 1 shows the result of the differences between the reduced undamaged stiffness matrix and the damaged stiffness matrix for case 1.
The result of TPC technique for case 1
Considering the results in Table 2, the location of the sen4 is closer than the sen2 to damage location so that it can be explained why the large change occurs in coefficient kv4v4. The result of DOF’s v7, v9 shows the large changes concentrated in kv7v7 rather than kv9v9because the sen7 locates near to the damage location while the sen9 is far from the damage location. The first two results lead to the damage location on the left side of the bridge. The third result demonstrates that the damage locates on the section 4–4 rather than the section 5–5 because of the larger change in the coefficient kv11v11.
The indication of damage depends on the TPC technique for damage case 1

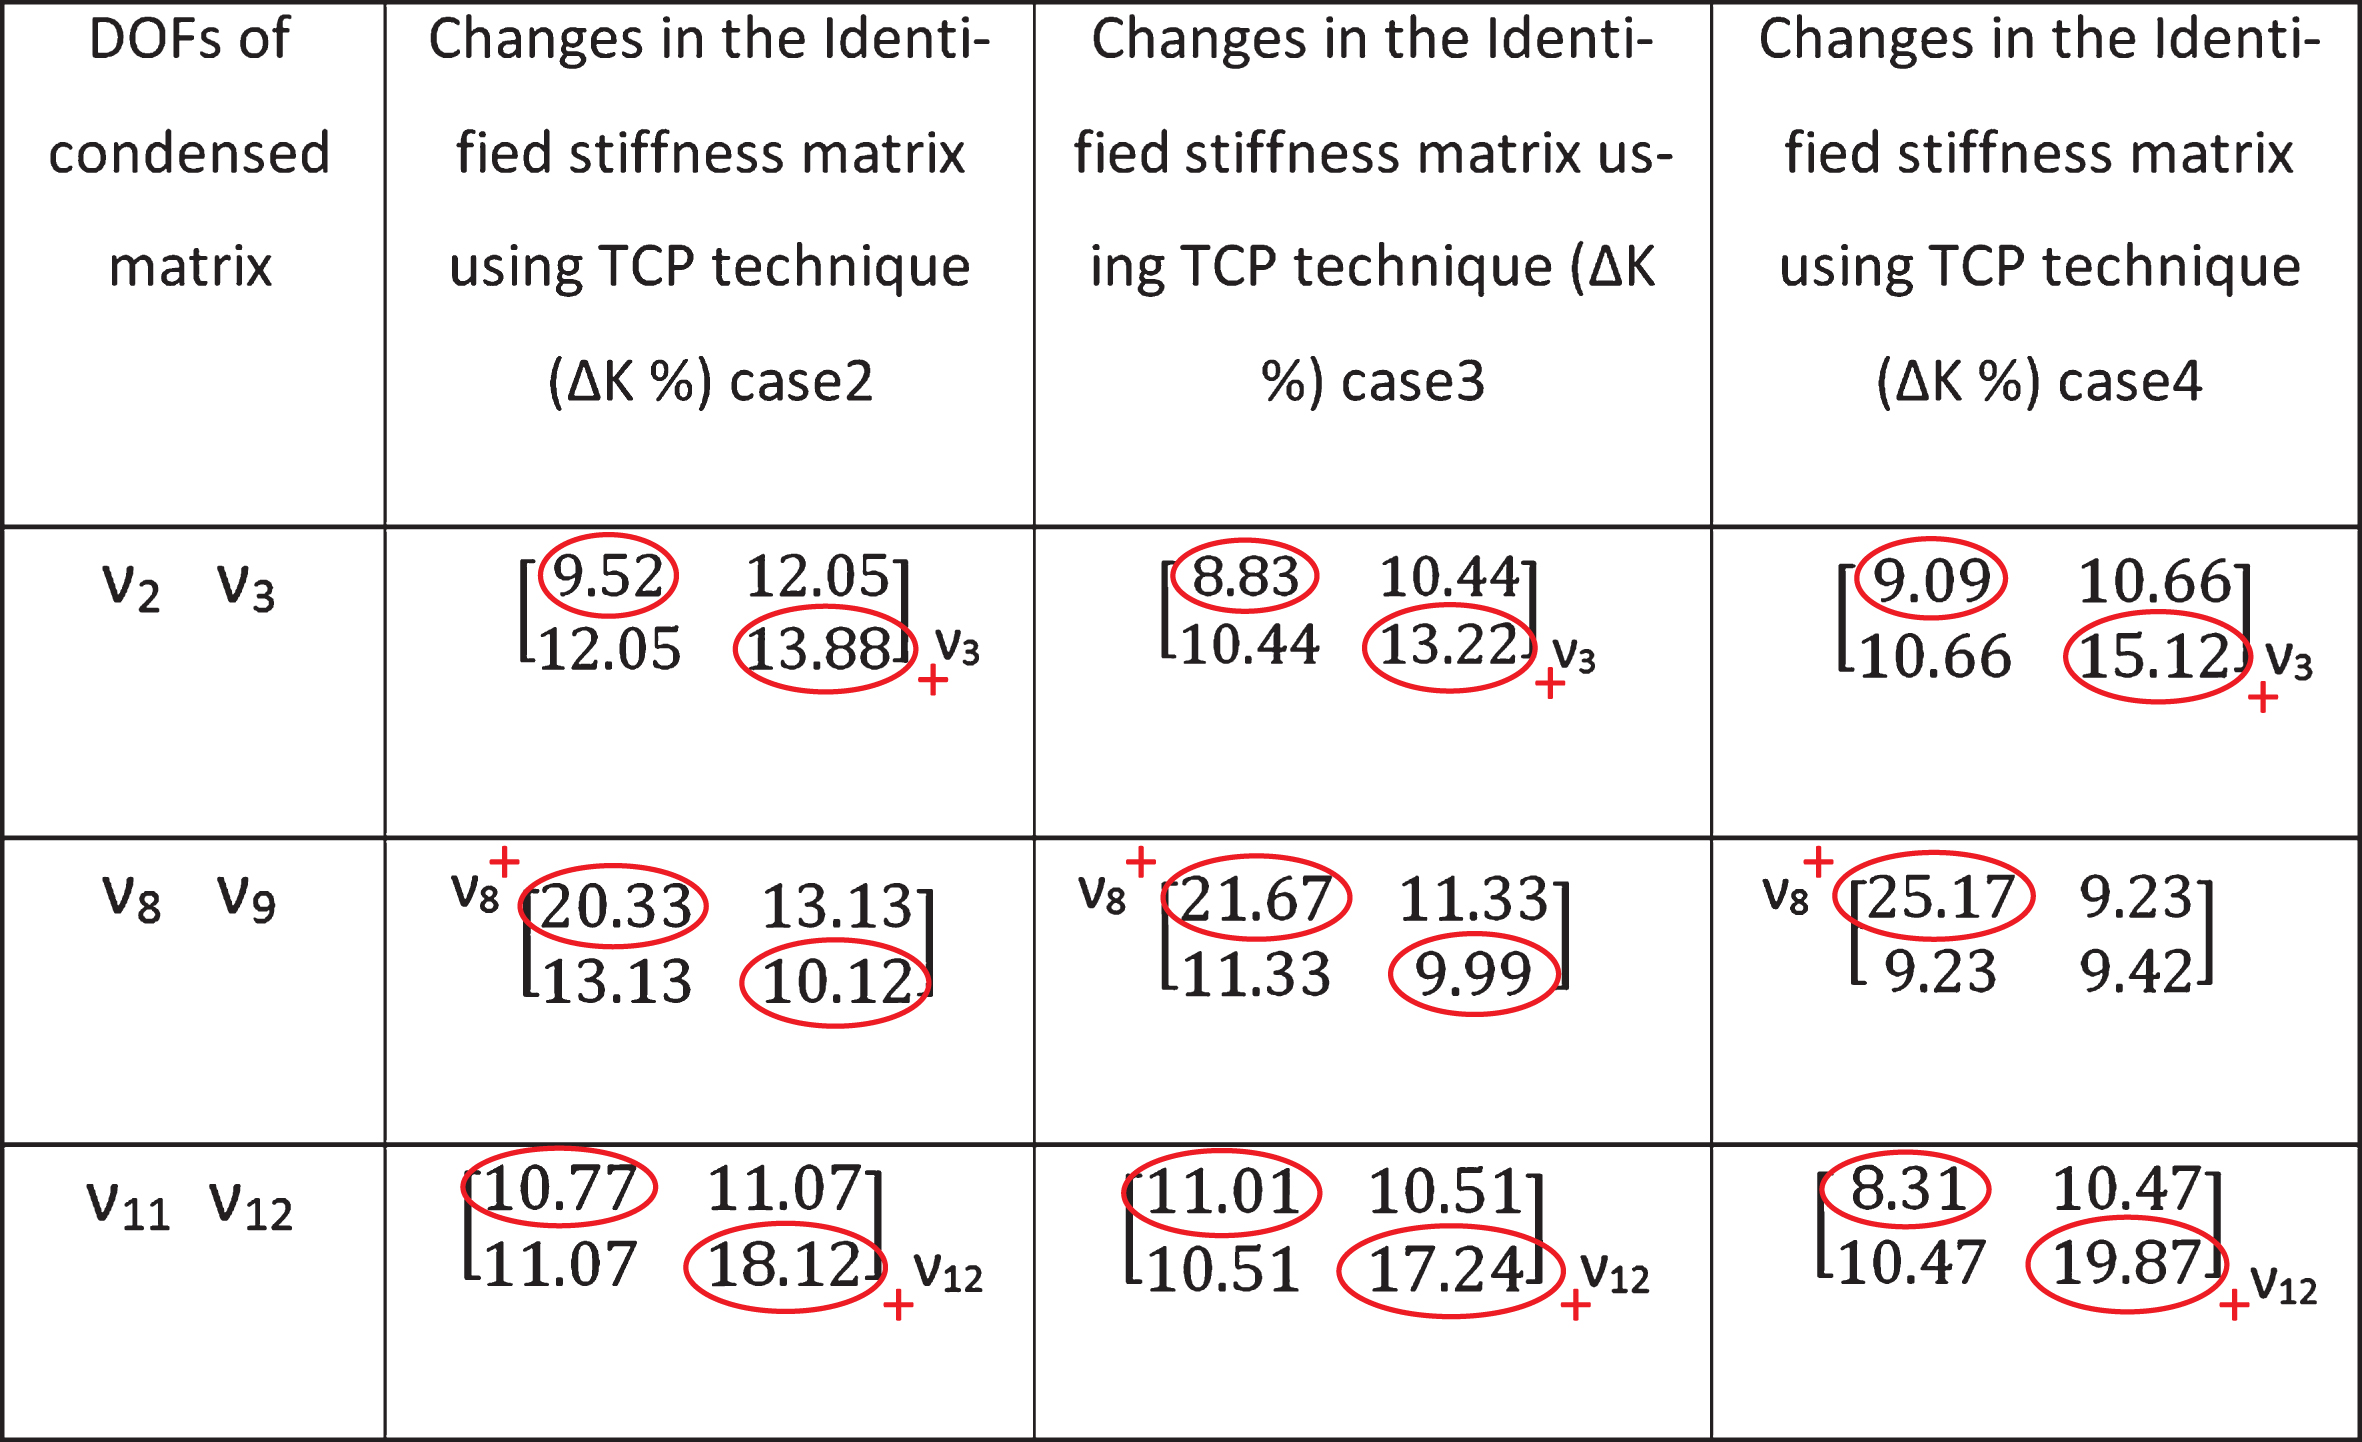
For the damage case 2, damage case 3 and damage case4, the sets DOFs v2, v3, v9, v8 and v11, v12 selected in TPC technique to indicate the damage. Table 3 shows the result of the TPC technique for the three cases.
The result of the TPC technique for damage case 2, damage case 3 and damage case 4
The analysis of the result can represent in Table 4. For damage cases 2, 3 and 4, the large changes in the identified stiffness matrix’s coefficients concentrated in coefficients that related to the nodes which located near to the damage location. Considering case 2, the removing of element LM produced a change in the stiffness matrix’s coefficient kv3v3 more than the change in the coefficient kv2v2.
Analysis the result of the TPC technique for damage case 2, damage case 3 and damage case 4
The TPC technique shows a good capability to find the location of the damage regardless the size of the damage. Since Table 4 included different damage levels it possible to realize that with increasing of damage size generate more change in the stiffness coefficients.
This paper proposes damage detection for a steel truss bridge. The vibration-based structural damage detection procedure is proposed based on time series analysis. A truss bridge structure is designed and fabricated in a laboratory for structural damage detection. The prototype tested in three levels of damage. The damage induces to the specimen by removing members. The TPC technique is used. The number of analytical DOFs is reduced to two DOFs and yet the modal sensitivity relationship to small physical changes of the structure is maintained. The SEREP reduction method is used for reduction instead of the static condensation method. Using SEREP method in TPC technique provides a good result for truss bridge. The illustrated results on the truss bridge show that most of the structural damages can be effectively identified by TPC procedure proposed here. The TPC technique shows the location of damage regardless the size of the damage. In addition, the results illustrate that changes in stiffness matrix can be a useful tool for continuous monitoring of structural safety using ambient vibration data.
The analytical and experimental representation of structural dynamic system does not always match to each other because there is a mismatch of selected number of degrees of freedom between them. This is the main problem to overcome. The concept of model reduction plays an important role in this view of point. By condensation, it is possible to compare large analytical set of DOF to the relatively small set of experimental DOF. Consequently, the set of tested DOF requires the large model to be reduced that much smaller size without missing any information that is dealing. On the other hand, rather than solving whole structure and compare the stiffness degradation it is more convenient to deal with much less DOF. TCP is a time domain method that means calculation time is always much more than frequency domain methods’. But dealing with 2 points, the programming becomes easier and in terms of programming, it becomes multicore or GPU (Graphical Processing unit) programmable subject which will help to overcome time-consuming calculation. This is the second step that is planned for the further work.