
Abstract
BACKGROUND:
There is an urgent need to improve the early diagnosis of breast cancer.
OBJECTIVE:
The present study applied spectral and beat-to-beat analyses to laser-Doppler (LDF) data sequences measured on the skin surface on the back of the right hands, with the aim of comparing the different peripheral microcirculatory-blood-flow (MBF) perfusion condition between breast-cancer and control subjects.
METHODS:
ECG and LDF signals were obtained simultaneously and noninvasively from 23 breast-cancer patients and 23 age-matched control subjects. Time-domain beat-to-beat indexes and their variability parameters were calculated. Spectral indexes were calculated using the Morlet wavelet transform.
RESULTS:
The beat-to-beat LDF pulse width and its variability were significantly smaller in cancer patients than in the controls. The energy contributions of endothelial-, neural-, and myogenic-related frequency bands were also significantly smaller in cancer patients.
CONCLUSIONS:
The present study has revealed significant differences in the beat-to-beat and spectral indexes of skin-surface-acquired LDF signals between control subjects and breast-cancer patients. This illustrates that LDF indexes may be useful for monitoring the changes in the MBF perfusion condition induced by breast cancer. Since the breast-cancer patients were at TNM stages 0– 2, the present findings may aid the development of indexes for detecting breast cancer.
Introduction
Cancer is the leading cause of death in developed countries, with breast cancer being the leading cause of cancer deaths among women worldwide. There is an urgent need to improve the early diagnosis of breast cancer.
Blood flow is an important factor influencing the metabolism and oxygenation of tumor tissue. Tumor blood vessels reportedly exhibit abnormal morphology [1]; they may have irregular diameters and can be fragile, leaky, and hence be characterized by abnormal blood flow [2]. The induced chaotic pattern of blood flow may alter the shape, size, and differentiation of the endothelium, perhaps via the aberrant expression of flow-mediated transcription factors [3]. Detecting abnormalities in the microcirculatory blood flow (MBF) in the vascular beds of tumor tissue may therefore aid the development of an index for detecting and monitoring tumor growth.
Various new techniques have been developed for measuring the blood flow in tumors for facilitating evaluations of morphological abnormalities of the vascular tree. For example, the blood flow in breast cancer has been quantified clinically using positron-emission tomography [4], magnetic resonance imaging [5], and Doppler ultrasonography [6]. Contrast-enhanced ultrasound has been suggested to be a useful and objective method in predicting pathological prognostic factors in breast invasive ductal carcinomas [7]. Conventional ultrasound and acoustic radiation force impulse have been revealed to be useful in predicting cancer [8, 9]. Optical techniques have also been used to provide functional information for breast-cancer applications. For example, it has been suggested that the blood flow is a useful and readily measurable hemodynamic biomarker that can be used to differentiate malignant tumors from healthy tissue via noninvasive diffuse optical methods [7].
Laser-Doppler flowmetry (LDF) is a technique that is widely used to monitor MBF responses, and its advantages include noninvasive and real-time measurements. LDF has made it possible to monitor the microregional blood flow in tumors, and it has also been used to successfully provide real-time spatial flow mapping of the microregional erythrocyte flux within tumors [11]. The MBF can be driven into the capillaries through arteriolar openings (AO) by the propelling force of the pulse pressure generated by the heartbeat and transmitted along the artery. Therefore, beat-to-beat parameters calculated from the time-domain LDF waveform may facilitate evaluations of the opening condition of AO, and thus may allow evaluation of the MBF perfusion condition of the microvascular beds [12]. Time-domain beat-to-beat waveform analysis has been applied to LDF signals acquired on the skin surface to study the MBF characteristics in patients with various types of disease, including diabetes [12] and stroke [13, 14]. In the frequency domain, spectral analysis has been applied to LDF signals to study the activities of various regulatory mechanisms (e.g., endothelial function and myogenic response) at local vascular beds in diseases [15–18] or following various types of stimulation [19–22].
The present study performed skin-surface LDF measurements on the back of the right hand. Spectral and beat-to-beat analyses were applied to the acquired LDF data sequences with the aim of comparing differences in the peripheral MBF perfusion condition between breast-cancer patients and control subjects. The present findings may aid the development of detection indexes for breast cancer.
Methods
Patient recruitment was coordinated by the Department of Surgery of the RenAi Branch of Taipei City Hospital. After receiving approval from the Review Board of Taipei City Hospital (TCHIRB_10502120), informed consent was obtained from the study participants or their legal designates. The occurrence of breast cancer was confirmed by a doctor in the Department of Surgery with the aid of mammography and/or breast ultrasound. To ensure data reproducibility, all measurements on the included subjects were performed at around 3 : 00 p.m. on the day before the day of surgical tumor removal.
Experiments were performed on 23 cancer patients and 23 age-matched control subjects. Their characteristics are listed in Table 1. The subjects were all native Taiwanese, were lightly clothed, supine, and were allowed to stabilize for at least 20 min before commencing the recording. The variation of the environmental temperature during the entire measuring period was <1°C. Tea, coffee, alcohol and smoking were forbidden on the experiment day.
Fundamental physiological parameters (quantity or mean ± standard deviation values) of
the study subjects
Fundamental physiological parameters (quantity or mean ± standard deviation values) of the study subjects
“*” indicates p < 0.05 between the groups.
ECG and LDF signals were obtained simultaneously and noninvasively. ECG signals were measured by surface electrodes, and acquired by a preamplifier (lead II, RA-LL; 6600-series, Gould, USA). Moor VMS-LDF (VP1 probe; MBF3, Moor Instruments, UK) was used to measure the nearby skin-surface temperature and the MBF flux with a time constant of 0.001 s, a cut-off frequency of 14.9 kHz, and a sampling frequency of 40 Hz. The measuring sites of the LDF probe were located between the thumb and the index finger on the back of the hand, between the 1st and 2nd metacarpal bones, in the middle of the 2nd metacarpal bone on the radial side (typical waveforms shown in Fig. 1) [18]. In each trial for cancer subjects, the measurement site on the same side as the breast tumor was designated as Site 1, and that on the contralateral side was designated as Site 2. The LDF probe was placed at the right side for control subjects. The laser operating wavelength and output power were 400–700 nm and 6 mW, respectively. Subjects were asked to sit on a chair, lean the back to the chair back, put both arms on the chair armrests, keep both feet on the ground, and to relax and breathe naturally throughout the measurement period so as to avoid motion artifacts. The signals were connected to an analog-to-digital converter card (PCI-9111DG, Adlink Technology, Taiwan) operating at a sampling rate of 1024 Hz.
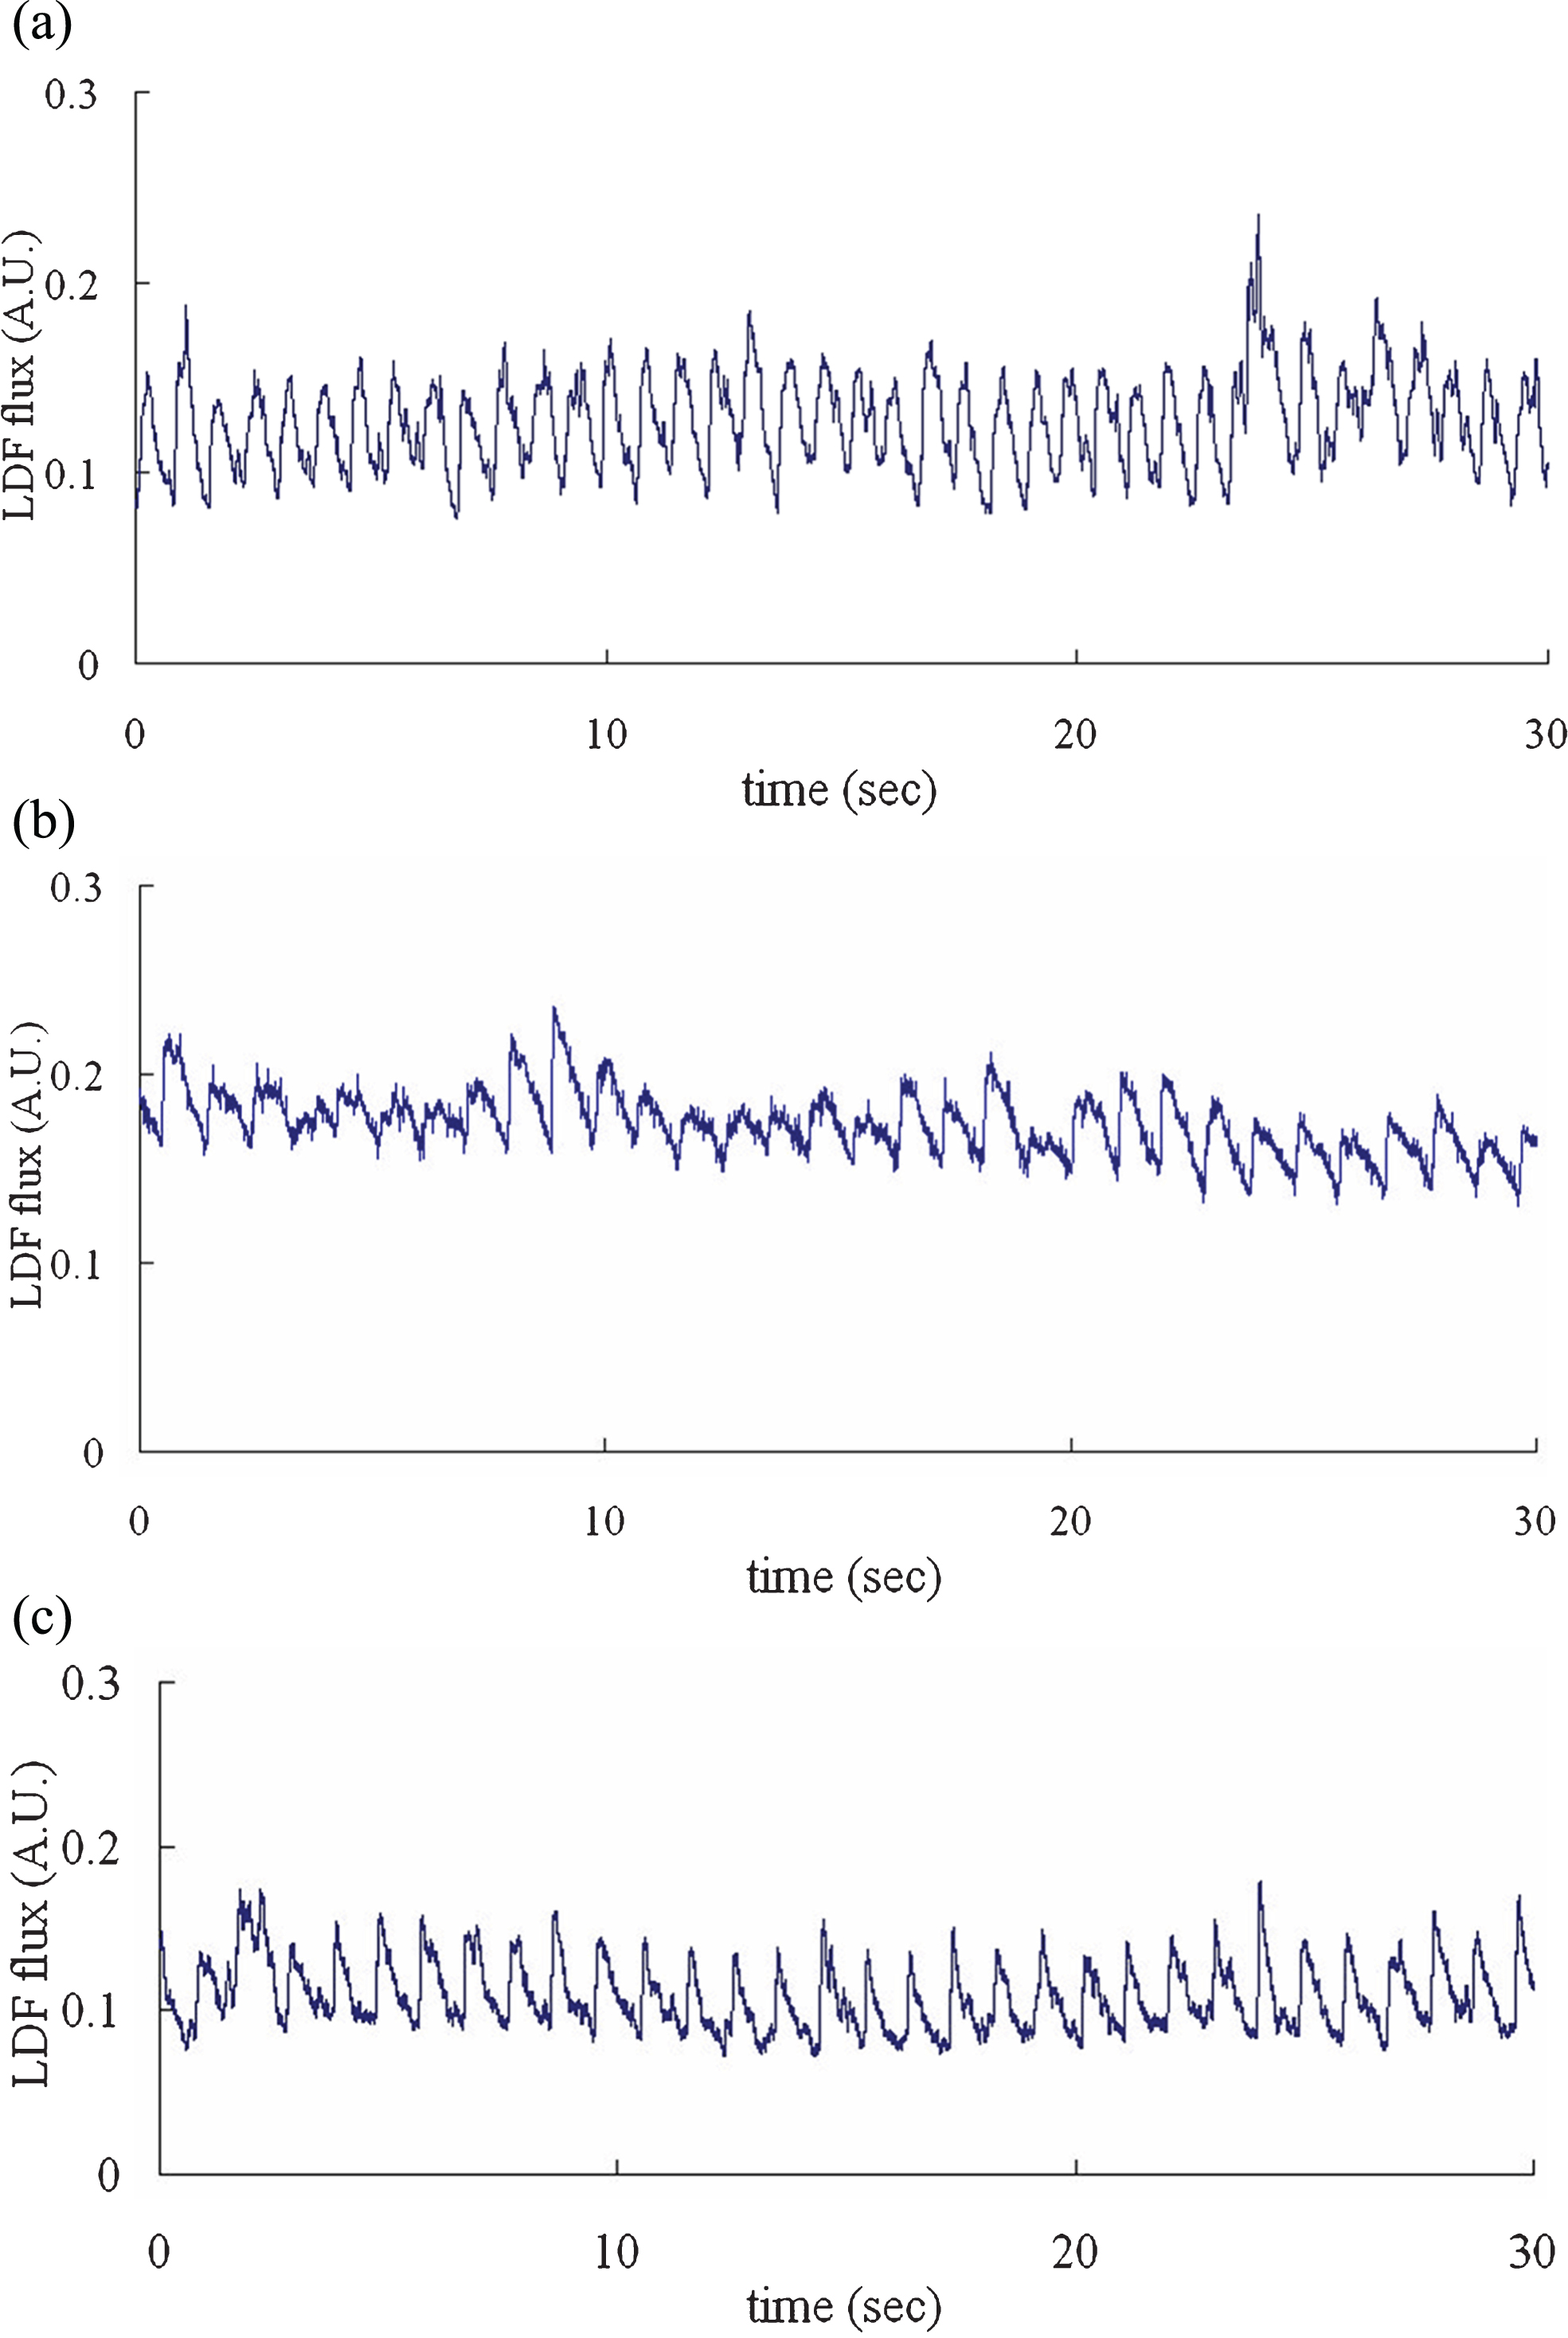
Typical LDF waveforms. (a) Group Cancer; Site 1. (b) Group Cancer; Site 2. (c) Group Control.
Each assessment involved a 20-min recording. Before the LDF measurement, we measured fundamental physiological parameters of the subject, including the heart rate (HR), brachial systolic blood pressure (BP) and diastolic BP using a sphygmomanometer (MG150f, Rossmax). To avoid the interference effects, the skin-surface temperature was also monitored by the same LDF probe. The skin-surface temperature stability during the baseline period was considered acceptable when the variation was less than 1.0°C.
To determine the beat-to-beat LDF waveform, the two neighboring minimal points were used to identify the cut points in the LDF flux signal to define each pulse. Mean microcirculatory blood flow (DC) was defined as average of mean value for all the pulses in the 20-minute sequence. The foot delay time (FDT) was defined as the average time interval between each ECG R-peak point and the corresponding LDF foot point. The pulse width (PW) was defined as the time interval between the points at which the flux value was 80% of the pulse peak on the rising and falling edges, respectively [13]. Values of the coefficient of variance of DC, PW, and FDT for all the pulses within a 20-minute LDF data sequence were then calculated to evaluate the beat-to-beat MBFV parameters (DC_CV, PW_CV, and FDT_CV, respectively).
In the present spectral analysis, wavelet transform with Morlet mother wavelet was applied to the measured LDF signals to improve the low-frequency resolution. The average values of all LDF signals were removed before further analysis. In the LDF spectrum of human subjects, periodic oscillations with five characteristic frequency peaks can be noted within 0.0095–1.6 Hz, with the positions of these peaks falling within the following frequency bands: 0.0095–0.02, 0.02–0.06, 0.06–0.15, 0.15–0.4, and 0.4–1.6 Hz (defined as FR1-FR5, respectively; each frequency band was uniformly divided into ten scales for wavelets). These five bands are suggested to be influenced by the endothelial activity of the vessel wall, the neurogenic activity of the vessel wall, the intrinsic myogenic activity of vascular smooth muscle, the respiration, and the heartbeat, respectively [18, 20]. The energy density within each frequency band (from FR1 to FR5) was calculated, and the relative energy contribution (REC) was defined as the ratio between the total energy density within each band and the total energy density of the entire spectrum from 0.0095 to 1.6 Hz.
Statistics
All signal processing was performed with MATLAB (MathWorks, Natick, MA, USA). All statistical analyses were carried out using SPSS, version 13.0. The differences in the fundamental physiological and LDF parameters were tested with the Kruskal–Wallis test (nonparametric ANOVA). Post hoc multiple comparisons tests were made by Dunn’s test. The level of significance was defined as p < 0.05; all p-values were two-sided hypotheses.
Results
The subject characteristics are listed in Table 1. The only variable that differed significantly between the groups was the diastolic BP.
The comparison of LDF beat-to-beat parameters in Fig. 2 reveals that the FDT at Site 1 was marginally smaller than the control value. PW and PW_CV at Sites 1 and 2 were significantly smaller than those in Group Control. DC was marginally smaller at Site 1 than in Group Control.
The comparison of LDF spectral parameters in Fig. 3 reveals that the RECs of FR1–FR3 were significantly smaller and that of FR5 was significantly larger at Site 1 than in Group Control, while the REC of FR2 was marginally smaller and that of FR5 was marginally larger at Site 2 than in Group Control. There were no significant differences in the REC of FR4.

Comparison of LDF beat-to-beat parameters. Solid and dashed lines “”
indicate p < 0.05 and 0.05 < p<0.1, respectively. FDT and DC
were marginally smaller at Site 1 than in Group Control, and PW and PW_CV were
significantly smaller at Sites 1 and 2 than in Group Control.
Comparison of LDF spectral parameters. Solid and dashed lines
“” indicate p < 0.05 and
0.05 < p < 0.1, respectively. Compared with Group Control,
there were significant differences in the RECs of FR1, FR2, FR3, and FR5 at Site 1, but
there were no significant differences in the REC of FR4.
The results of data normality test (by Shapiro-Wilk test) of LDF indices were listed in Table 2. Power analysis revealed that the power of the present analysis in PW, PW_CV, FR1, FR2, FR3 and FR5 were all larger than 0.8.
This study found significant differences in the beat-to-beat and spectral indexes of the skin-surface-acquired LDF signals between breast-cancer patients and control subjects. As conjectured below, these differences could be at least partly attributable to changes in the MBF supply condition and the microcirculatory regulatory activities accompanied with the induced changes in hemodynamics associated with breast cancer. Moreover, they may be helpful to understanding the changes in the underlying microcirculatory regulatory mechanisms induced by the development of tumor tissue.
For the time-domain beat-to-beat LDF indexes, Fig. 2 reveals that PW was significantly smaller and DC was marginally smaller in Group Cancer than in Group Control. According to Poiseuille’s equation, AO with a smaller diameter allow less blood to flow through, and a shorter PW might correspond to a shorter proportion of time that larger-diameter AO are open. The present changes in DC and PW can be related to the induced skin-surface changes in the MBF supply condition, and thus illustrate that DC and PW can be used to aid the noninvasive evaluation of the blood-flow efficiency of AO. Table 1 indicates that DBP was increased in Group Cancer while the skin-surface MBF supply was decreased, which implies a worse MBF perfusion efficiency. This illustrates that a tumor may affect the skin-surface MBF supply condition, or may change the microcirculatory regulatory activities to adjust the local MBF perfusion condition.
Figure 2 reveals that FDT was marginally smaller at Site 1 than in Group Control. FDT is related to the transmission time for the pressure pulse between its cardiac injection and its arrival at the vascular beds [18]. The present finding of a decrease in FDT can therefore be at least partly attributed to faster propagation of the arterial pulse, and thus to an increase in the arterial elastic modulus or increase in BP (a significant increase in DBP in Group Cancer is reported in Table 1). It has been suggested that the risk of cancer is slightly but significantly increased in hypertensive patients [23], although some previous studies revealed no such significant association with breast cancer in hypertensive patients [24]. Hypertension and anti-hypertensive drugs were noted to be able to influence the cancer cells [25]. For example, nifedipine was noted to be able to promote the proliferation and migration of breast cancer [26]. Several possible underlying mechanisms have been suggested; for example, an increased BP may increase apoptosis, and a link between BP and cancer could also be mediated via proliferative abnormalities in vascular smooth-muscle cells [27–29]. Some biological abnormalities in cancer are also involved in hypertension, which is often considered as part of a cardiovascular proliferative disorder [23]. It has been suggested that hypertension is related to shortening of telomeres, leading to cell senescence and complications, including atherosclerosis and cancer [27]. During the period of hypertension development, perhaps as a response to increments of blood pressure, apoptosis and proliferation can be increased, resulting in enhanced cell turnover [23].
Results of data normality test (p values, by Shapiro-Wilk test)
Results of data normality test (p values, by Shapiro-Wilk test)
Beat-to-beat cardiovascular variability parameters (e.g., HR variability and BP variability) are widely used to monitor cardiovascular regulatory activity. Similarly, since beat-to-beat LDF parameters can be used in evaluations of the opening condition of AO, it has been suggested that their variations can be attributed to various regulatory mechanisms acting on the on-off tuning activities of AO, and thus might be suitable for monitoring the microcirculatory regulatory activities at local vascular beds [12]. Significant differences in MBF variability parameters have been revealed between normal control subjects and patients with various types of diseases such as stroke and diabetes [12, 16].
The present study found that while there were no significant differences in the MBF variability parameters of DC_CV and FDT_CV, PW_CV was significantly smaller at Site 1 than in Group Control. Changes in MBF variability parameters have been suggested to be related to the adjustment effort of the cardiovascular system when it is stimulated in different ways [12–14]. It is possible that a decreased MBF supply to the skin-surface vascular beds impairs some of the microcirculatory regulatory rhythms and thus lead to the decreases in MBFV parameters observed in Group Cancer. It can also be partly attributed to changes in the microcirculatory regulatory activities as detected by the spectral analysis of LDF signals.
A possible explanation for the only significant difference being observed in PW_CV is that PW relates to the opening condition of AO, whereas DC is related to the mean MBF perfusion condition and FDT is related to the arterial pulse transmission. PW_CV may therefore be affected more by the local microcirculatory regulatory activities that change the elastic or morphological properties of the AO.
Figure 3 reveals that the RECs of FR1–FR3 were significantly smaller in Group Cancer than in Group Control. It has been suggested that the REC of FR1 is associated with the endothelial activity in microcirculatory regulation. The observed decrease in the REC of FR1 might be attributable to the vascular endothelial dysfunction induced by tumor cells. The endothelium performs several critical functions such as regulating the passage of nutrients, oxygen, and other solutes from the bloodstream into tissues, and regulating the flow of blood by maintaining a nonthrombogenic surface [2]. The migration of endothelial cells is an essential component of angiogenesis, and the underlying processes require the integration of signals elicited by chemotactic, haptotactic, and mechanotactic stimuli, and they are associated with the activation of intracellular pathways that result in cytoskeleton remodeling [30]. Endothelial dysfunction that occurs in the initial step of the pathogenesis of cancer [30] may decrease the microcirculatory regulatory activities of endothelial cells and thus lead to the significant decreases in the REC of FR1 observed in the present study at Site 1.
The RECs of FR2 and FR3 have been suggested to be associated with the microcirculatory regulatory activity of the neural and myogenic functions, respectively [18]. Tumor vessels are structurally different from vessels in normal tissues, exhibiting features such as immature vessel walls with a lack of muscle cells, missing adrenergic innervation and lymphatic drainage, and having a discontinuous endothelial lining and sinusoidal vessel plexuses [31]. It is possible that abnormal innervation decreases the neural activity of microcirculatory regulatory mechanisms and thereby lead to the significant decreases in the REC of FR2 observed in the present study at Site 1. Similarly, a lack of muscle cells in vessel walls may decrease the myogenic activity of microcirculatory regulatory mechanisms and thus lead to the significant decreases in the REC of FR3 observed in the present study at Site 1. Another possible explanation for the change in the REC of FR3 is local vessels being stretched more by the higher diastolic BP found in Group Cancer. When the pressure pulse passes through a vascular bed, local vessels with stiffer walls will be deformed less. This could decrease the myogenic response, which could at least partly explain the decrease in the REC of FR3 in Group Cancer.
The present findings for Group Cancer illustrate that cancer can exert significant effects on the present indexes of skin-surface-acquired LDF signals. This could be explained by dynamic interactions between cancer cells and the host micro-environment that support the growth and spread of cancer cells. For example, for the successful establishment of a metastatic tumor, cancer cells from the primary tumor first gain access to the circulatory system [2, 32], typically aided by angiogenesis and remodeling of the basement membrane [33]. Detachment and embolization of single tumor cells or aggregates occurs next. The intravasated cancer cells must then survive the shear forces of circulation so that they can home to distant metastatic sites [34]. Upon reaching their metastatic sites, cancer cells adhere to the endothelial cells and negotiate their way through the basement membrane and undergo extravasation. The cancer cells invade the secondary tissue, establish a microenvironment, induce proliferation or angiogenesis, and finally reestablish organizational growth as a solid secondary tumor. The secondary nodules formed at distant sites within the body typically resemble the primary tumor phenotype [2]. This implies that tumor cells may induce an MBF response at a site other than at the tumor site itself [17]. Such a re-establishment procedure can explain why changes in the LDF spectral index are detected at a distant site (as in the present measurements).
Comparisons between the results for Sites 1 and 2 revealed that although some differences were not significant, several present LDF indexes showed progressive decreases (e.g., FDT, PW, DC, PW_CV, and the RECs of FR1–FR3 in Figs. 2 and 3). This illustrates that the present LDF indexes may be used to discriminate between the disease-affected and contralateral sides of breast-cancer patients, and hence aid the detection of the position of tumors during their early development.
The present study found significant differences in the beat-to-beat and spectral indexes of the skin-surface-acquired LDF signals between control subjects and breast-cancer patients. The findings indicate that LDF indexes may be useful in monitoring the changes in the MBF perfusion condition induced by breast cancer. Since the breast-cancer patients included in this study were at TNM stages 0–2, the present findings may aid the development of indexes for detecting breast cancer.
Footnotes
Acknowledgments
Taipei City Hospital and Ministry of Science and Technology for partial support of this work.
There are no conflicts of interest for all authors.
Grant supports: Ministry of Science and Technology (MOST 104-2221-E-011-170-MY3); Taipei City Hospital.