
Abstract
This study performed beat-to-beat and spectral analyses of 20-minute skin-surface laser-Doppler-flowmetry (LDF) and radial blood-pressure-waveform (BPW) signals in order to compare the blood-flow perfusion condition and regulatory mechanisms between essential-hypertension (EHT) patients and aged-matched control subjects. Beat-to-beat LDF analyses yielded the pulse width (PW), AC-to-DC ratio (AD), and their corresponding variability indices (coefficients of variation [CVs]). The relative energy contributions (RECs) of five characteristic frequency peaks (defined as FR1–FR5) were also calculated. Spectral BPW analysis obtained the amplitude proportion (C n ) and phase angle (P n ) of each harmonic component n. PW, AD, AD_CV, and REC of FR2 were significantly smaller in the EHT group than in the control group. Regarding BPW indices, C1, C2, C4, and C5 were significantly larger and P2–P8 were significantly smaller in EHT patients than in controls. The present results indicate that BPW and LDF indices can be used to evaluate the blood-flow perfusion efficiency and microcirculatory regulatory activities in EHT. Sex differences were found, with the effects being more prominent in female patients. These findings may be partly attributable to impairment of endothelial and neural regulatory functions. The present findings might aid the development of new noninvasive methods for reducing the risk of EHT-induced damage.
Introduction
Arterial hypertension is a hemodynamic disease characterized by the blood pressure (BP) measured on the walls of the arteries, either equal or higher than 140 mm Hg for the systolic or 90 mm Hg for the diastolic pressure [1]. Essential hypertension (EHT) constitutes more than 95% of cases of hypertension [2]. EHT can be accompanied with changes in the vessel properties and blood flow perfusion. For the vessel properties, an overactive renin-angiotensin system (which may lead to vasoconstriction) and overactive sympathetic nervous system (which may lead to increased elasticity) have been suggested as factors related to the pathology. Regarding the blood flow distribution, both disturbed flow in peripheral arteries and abnormal responses in microvascular beds have been observed in EHT patients [3]. At the macrocirculatory level, the cushioning peripheral vascular functions are impaired in patients with EHT [3]. It is also well known that the arterial stiffness is increased in EHT patients, which portends an adverse prognosis [4]. At the microcirculatory level, EHT is a pathology associated with functional and structural changes in the microcirculation [5–8], such as attenuated cutaneous nitric-oxide-dependent vasodilation [9]. Endothelial dysfunction and altered regulation of arteriolar smooth-muscle tone in the endothelium in the microcirculation are also reportedly common features of hypertension [4, 10].
The propelling force of the BP pulse transmitted along an artery results in blood being pushed into the vascular beds via the arteriolar openings (AO). Analyzing the pulse waveform in the main artery can therefore be used to monitor the transmission condition of the arterial pulse and the blood flow perfusion condition [11, 12]. Many previous studies have used BP waveform (BPW) analysis to investigate the propagation condition of the arterial pulse waveform in various important cardiovascular diseases, such as hypertension [13], stroke [14], and metabolic syndrome [15].
At the microcirculatory level, it has been suggested that the skin microcirculation mirrors the microcirculation state of the vascular beds in other organs, and so its study could provide useful clinical data when evaluating the general microcirculatory impairment in different pathological conditions [4, 10]. Laser-Doppler flowmetry (LDF) is a noninvasive tool for assessing tissue microcirculation that provides the advantages of continuous measurement, ease of application, high safety, and equipment smallness. Studies of the human cutaneous circulation have provided extensive data for assessing microvascular function in various vascular disease states, such as hypertension, stroke, diabetes, and metabolic syndrome [5, 16–21].
The present study applied beat-to-beat and spectral analyses to skin-surface LDF signals, and spectral harmonic analysis to radial BPW signals with the aim of identifying differences in the blood-flow perfusion condition and regulatory mechanisms between EHT patients and control subjects. The application of spectral analysis to the BPW can provide information related to the transmission condition of the arterial pulse. In the time domain, beat-to-beat indices of LDF waveforms might be useful for monitoring of the opening condition of the AO and thus the microcirculatory-blood-flow (MBF) perfusion resistance [12, 20]. In the frequency domain, it has been suggested that certain spectral indices of LDF signals are correlated with the activities of various types of microcirculatory regulatory activities, such as endothelial and neural regulatory activities [19, 22–24]. The findings might aid the development of new noninvasive methods for reducing the risk of EHT-induced damage.
Methods
Patient recruitment was coordinated by the Division of Cardiology of Taipei Medical University Shuang-Ho Hospital. After receiving approval from the Review Board of Taipei Medical University (TMU-JIRB N201611021), written informed consent was obtained from study participants or their legal designates. All procedures performed in studies involving human participants were in accordance with the 1964 Helsinki declaration and its later amendments or comparable ethical standards.
The occurrence of EHT was confirmed by a doctor at the Division of Cardiology, Taipei Medical University Shuang-Ho Hospital. Experiments were performed on two groups of subjects (details see Table 1): Group EHT, comprising EHT patients; Group C, comprising age-matched control subjects. The subjects were all native Taiwanese, aged between 20–80 years old. The EHT subjects were between stages 1–3 hypertension [25]; they did not have any target organ damage, and did not use the anti-hypertensive drugs for at least 3 months before the experiment. The subjects were lightly clothed, supine, and were allowed to stabilize for at least 20 min before commencing the recording. Tea, coffee, alcohol and smoking were forbidden on the experiment day.
Fundamental physiological parameters (quantity or mean±standard-deviation values) of the study subjects. *,p < 0.05 between Group Control and Group EHT
Fundamental physiological parameters (quantity or mean±standard-deviation values) of the study subjects. *,p < 0.05 between Group Control and Group EHT
ECG, BPW and LDF signals were obtained simultaneously and noninvasively. ECG signals were acquired by a preamplifier (lead II, RA-LL; 6600-series, Gould, USA). The BPW signals were acquired by pressure transducers (KFG-2–120-D1–11, Kyowa), which were hold onto the skin surface above the radial artery 2 cm from the wrist [14, 26]. MoorVMS-LDF (VP1 probe; MBF3, Moor Instruments, UK) was used to measure the nearby skin-surface temperature and the MBF flux with a time constant of 0.001 s, a cut-off frequency of 14.9 kHz, and a sampling frequency of 40 Hz. The measuring sites of the LDF probe were located between the thumb and the index finger on the back of the left hand, between the 1st and 2nd metacarpal bones, in the middle of the 2nd metacarpal bone on the radial side [19, 27]. Subjects were asked to sit on a chair, lean the back to the chair back, put both arms on the chair armrests, keep both feet on the ground, and to relax and breathe naturally throughout the measurement period so as to avoid motion artifacts. The signals were connected to an analog-to-digital converter card (PCI-9111DG, Adlink Technology, Taiwan) operating at a sampling rate of 1024 Hz.
Each assessment involved a 20 min recording. Before the measurement, we measured fundamental physiological parameters of the subject, including the heart rate (HR), brachial systolic blood pressure (BP) and diastolic BP using a sphygmomanometer (MG150f, Rossmax). To avoid the interference effects, the skin-surface temperature was also monitored by the same LDF probe.
Data analysis
Spikes that deviated more than 50% from the mean flux value of the two adjacent data points were smoothed and replaced by their average value, since this implied the presence of obvious motion artifacts. When determining the pulsatile BPW and LDF waveform, the signals were filtered by a digital 11th-order high-pass Chebyshev filter with a cut-off frequency of 0.01 Hz to eliminate the baseline drift, to provides a steeper transition region to improve the filtering effects on lower-frequency interference (such as motion artifact). The two neighboring minimal points were used to identify the cut points in the BPW and LDF flux signals to define each pulse.
For the BPW signal, harmonic indices including amplitude proportion (C
n
) and phase angle (P
n
) were calculated by frequency-domain analysis. Each individual pulse (between foot points) can be represented by the following finite series [14, 26]:,
The Fourier coefficients (A n and B n ) of the pulse can be calculated by
Where ω is the angular frequency and t s is the sampling time interval.
The amplitude (Amp
n
) and phase angle (P
n
) of each harmonic of the pulse harmonic spectrum can then be calculated by
For the LDF signals, several beat-to-beat parameters were calculated to elucidate the possible microcirculatory effects between each group. AD was defined as average of (mean value)/(difference between the maximal and minimal value) for all the pulses in the 20-minute sequence. The foot delay time (FDT) was defined as the time interval between the ECG R-peak and the LDF foot point, the flow rising time (FRT) was defined as the time interval between the foot point and the maximal point of the LDF flux signal, and the pulse width (PW) was defined as the time interval between the points at which the flux value was 80% of the pulse peak on the rising and falling edges, respectively. These parameters were then used to calculate the MBF variability (MBFV) indices [CV (i.e., mean/SD) of AD (AD_CV), PW (PW_CV), FDT (FDT_CV) and FRT (FRT_CV) of all the pulses in the 20 min period] [18, 27].
Spectral analysis of LDF signals reveals that blood-flow oscillations at frequencies from 0.0095 to 1.6 Hz might reflect different physiological rhythms. Periodic oscillations with characteristic frequency peaks observed within the frequency bands of 0.0095–0.02, 0.02–0.06, 0.06–0.15, 0.15–0.4, and 0.4–1.6 Hz (defined as FR1–FR5) are suggested to be influenced by endothelial activity of the vessel wall, the neurogenic activity of the vessel wall, the intrinsic myogenic activity of vascular smooth muscle, the respiration, and the heartbeat, respectively [22–24, 28]. Calculating the relative spectral power of each frequency band may be helpful in studies of the underlying microcirculatory regulatory mechanisms. Wavelet transform with Morlet mother wavelet (ω0was set to be 5 rad/sec) was applied to the measured LDF signals to improve the low-frequency resolution [19, 27]. The average values of all LDF signals were removed before further analysis. 5-point time averaging was performed to smooth the data sequence, and then wavelet transforms of the LDF signal in time-frequency plane were averaged over time to get the spectrum. Each frequency band was uniformly divided into ten scales for wavelets. The energy density within each frequency band was calculated, and the relative energy contribution (REC) was defined as the ratio between the total energy density within each band and the total energy density of the entire spectrum from 0.0095 to 1.6 Hz.
All signal processing was performed with MATLAB (MathWorks, Natick, MA, USA). All statistical analyses were carried out using SPSS, version 13.0. The differences were tested with Kruskal–Wallis test (nonparametric ANOVA). The Dunn’s test was used for post-hoc analysis. The level of significance was defined as p < 0.05; all p-values were two-sided hypotheses.

Typical pulse waveform in one EHT subject.
The characteristics of the study subjects are listed in Table 1. The skin-surface temperatures before and after the LDF measurements were 26.0±1.5°C and 26.2±2.0°C, respectively (p > 0.2 by two-tailed paired t-test).
Figure 2 reveals that across both sexes, PW, AD, FRT_CV, and AD_CV were significantly smaller in Group EHT than in Group Control. In female subjects, PW, AD, and AD_CV were significantly smaller in Group EHT than in Group Control, while there were no significant intergroup differences in male subjects.
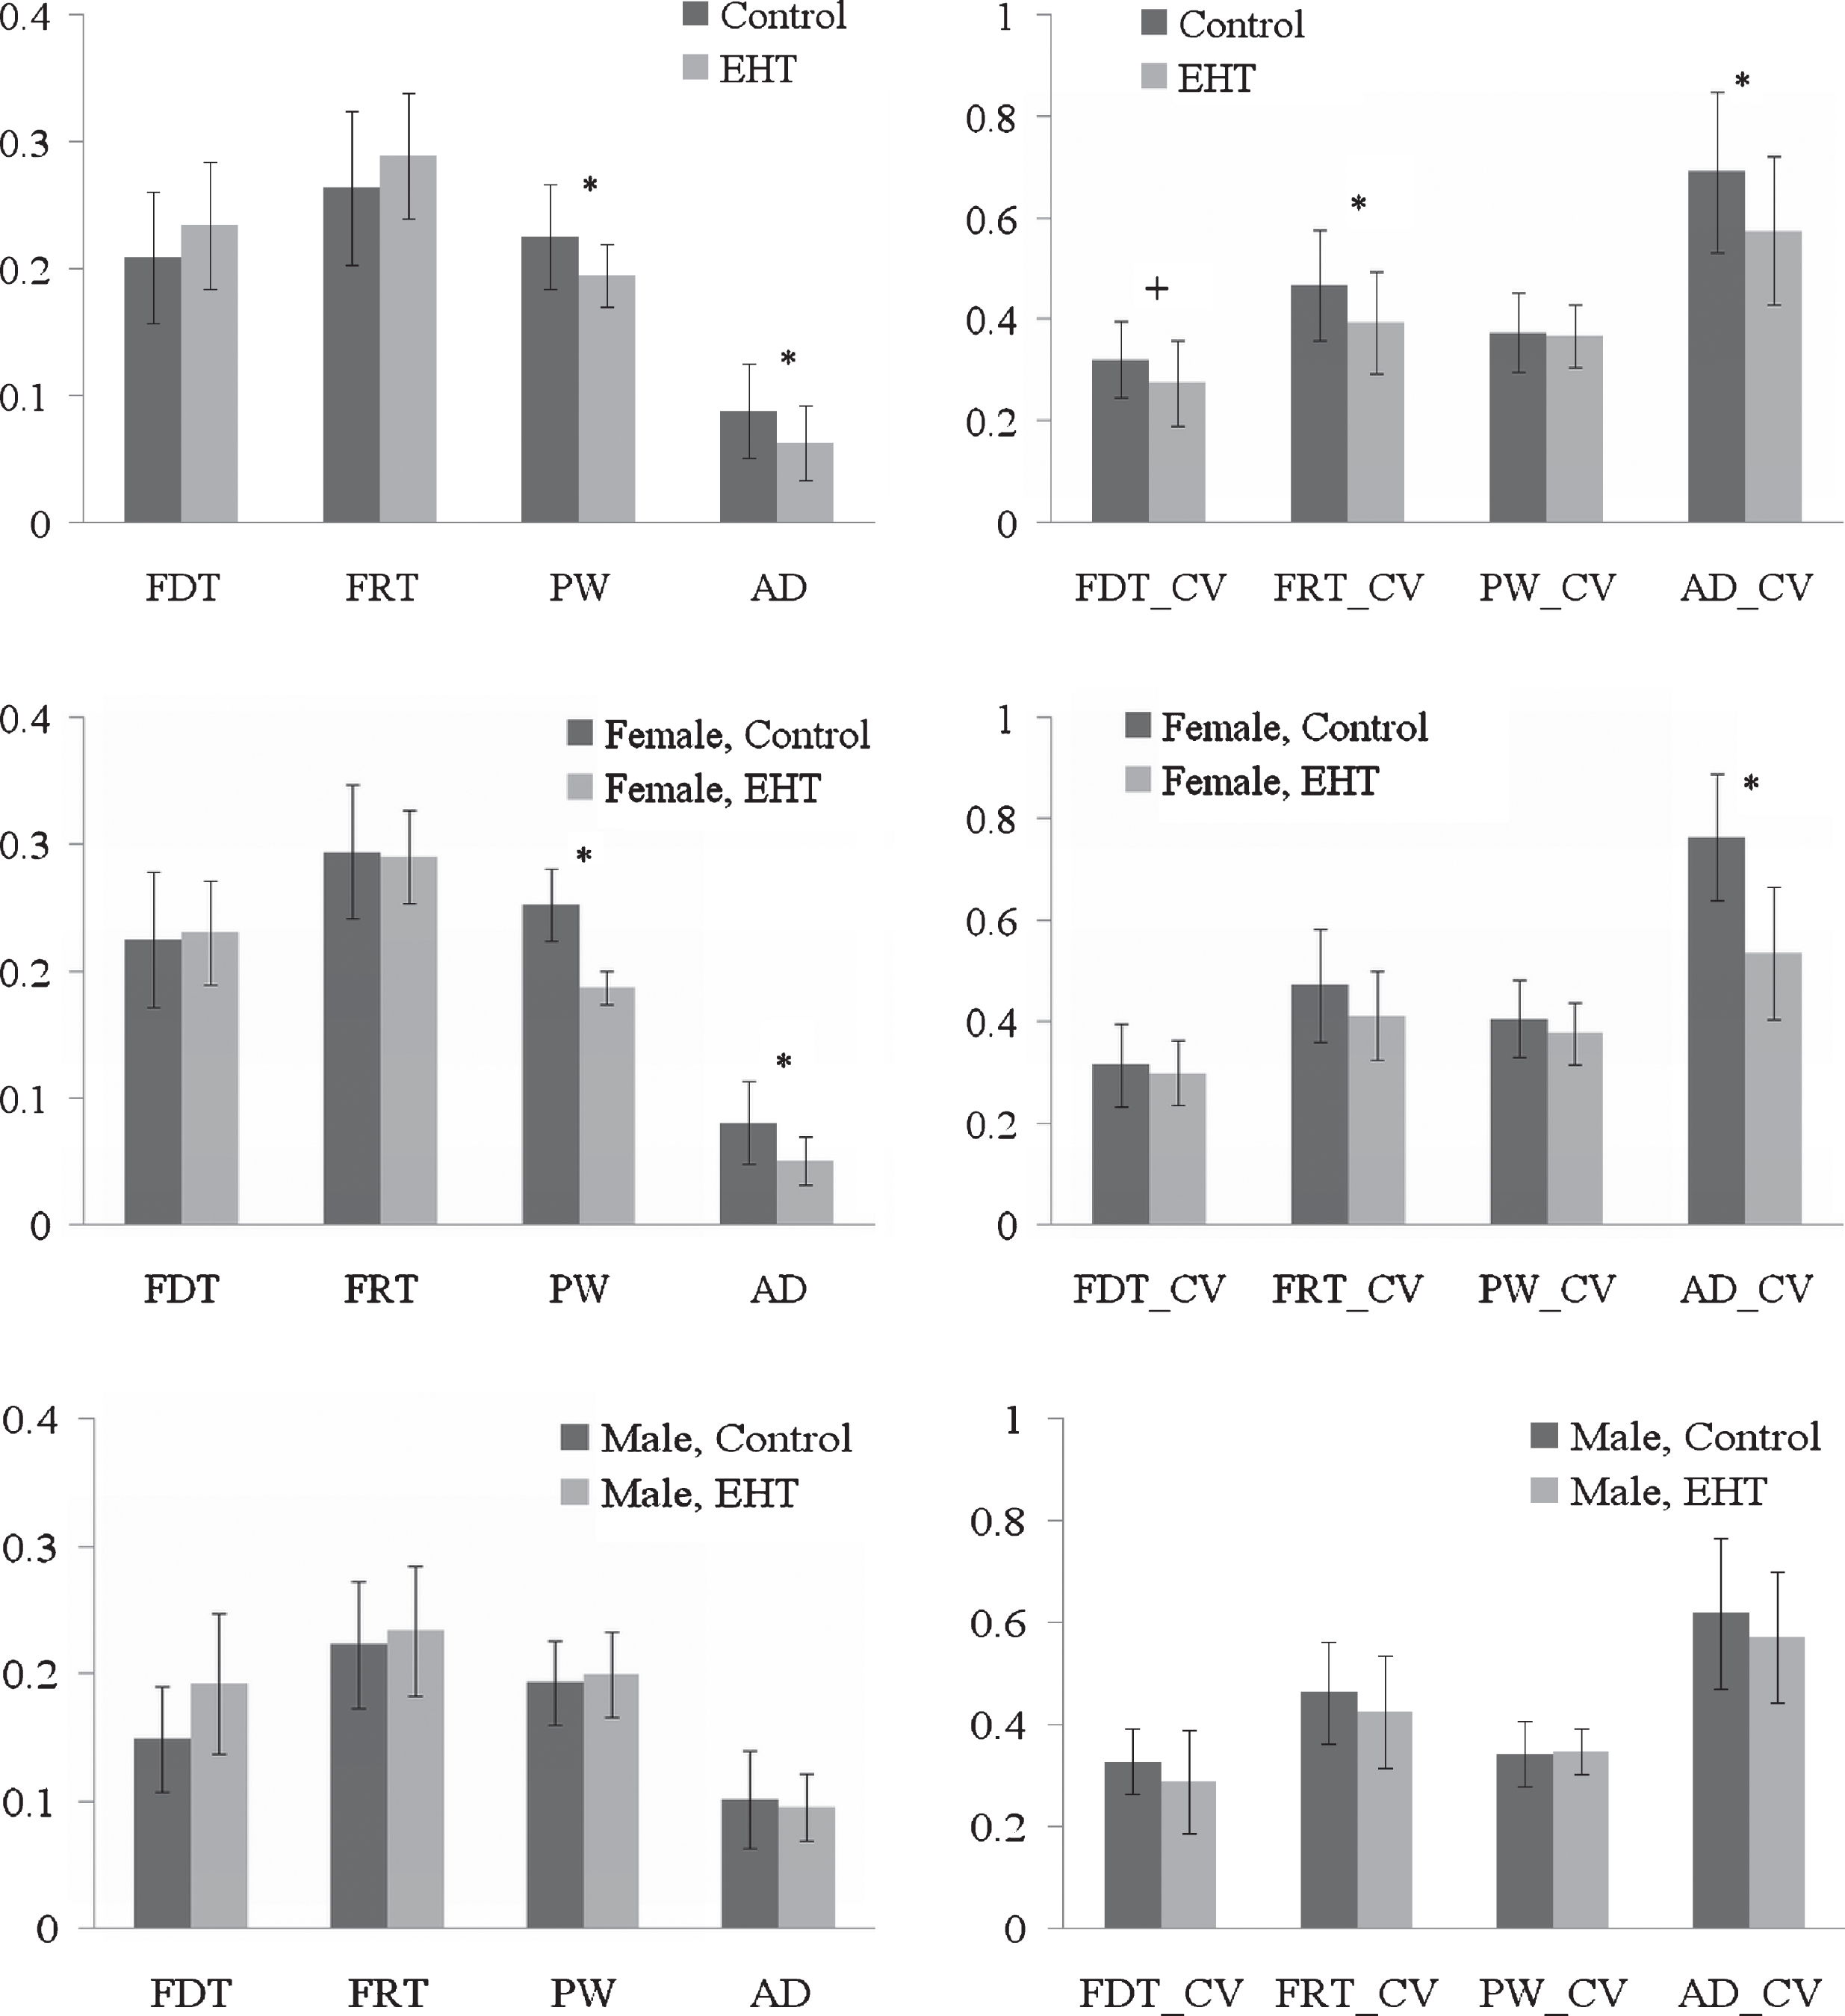
Comparison of LDF beat-to-beat parameters. Data are mean±standard-deviation values. *, p < 0.05 between the groups. Across both sexes, PW, AD, FRT_CV, and AD_CV were significantly smaller in Group EHT than in Group Control. In female subjects, PW, AD, and AD_CV were significantly smaller in Group EHT than in Group Control. There were no significant intergroup differences in male subjects.
Figure 3 reveals that across both sexes, the REC of FR2 was significantly smaller and that of FR5 was significantly larger in Group EHT than in Group Control. In female subjects, the RECs of FR1 and FR2 were significantly smaller, and that of FR5 was significantly larger in Group EHT than in Group Control, whereas there were no significant intergroup differences in male subjects.

Comparison of LDF spectral parameters. Data are mean±standard-deviation values. *, p < 0.05 between the groups. Across both subjects, the REC of FR2 was significantly smaller and that of FR5 was significantly larger in Group EHT than in Group Control. There were significant differences in the RECs of FR1, FR2, and FR5 between Group EHT and Group Control in female subjects, whereas there were no significant intergroup differences in male subjects.
Figure 4 compares the differences in spectral BPW indices. Across both sexes, C1, C2, C4, and C5 were significantly larger in Group EHT than in Group Control. The P2–P8 phase-angle indices were significantly smaller in Group EHT than in Group Control. Comparisons between the sexes revealed that the differences were more prominent in female than in male subjects.
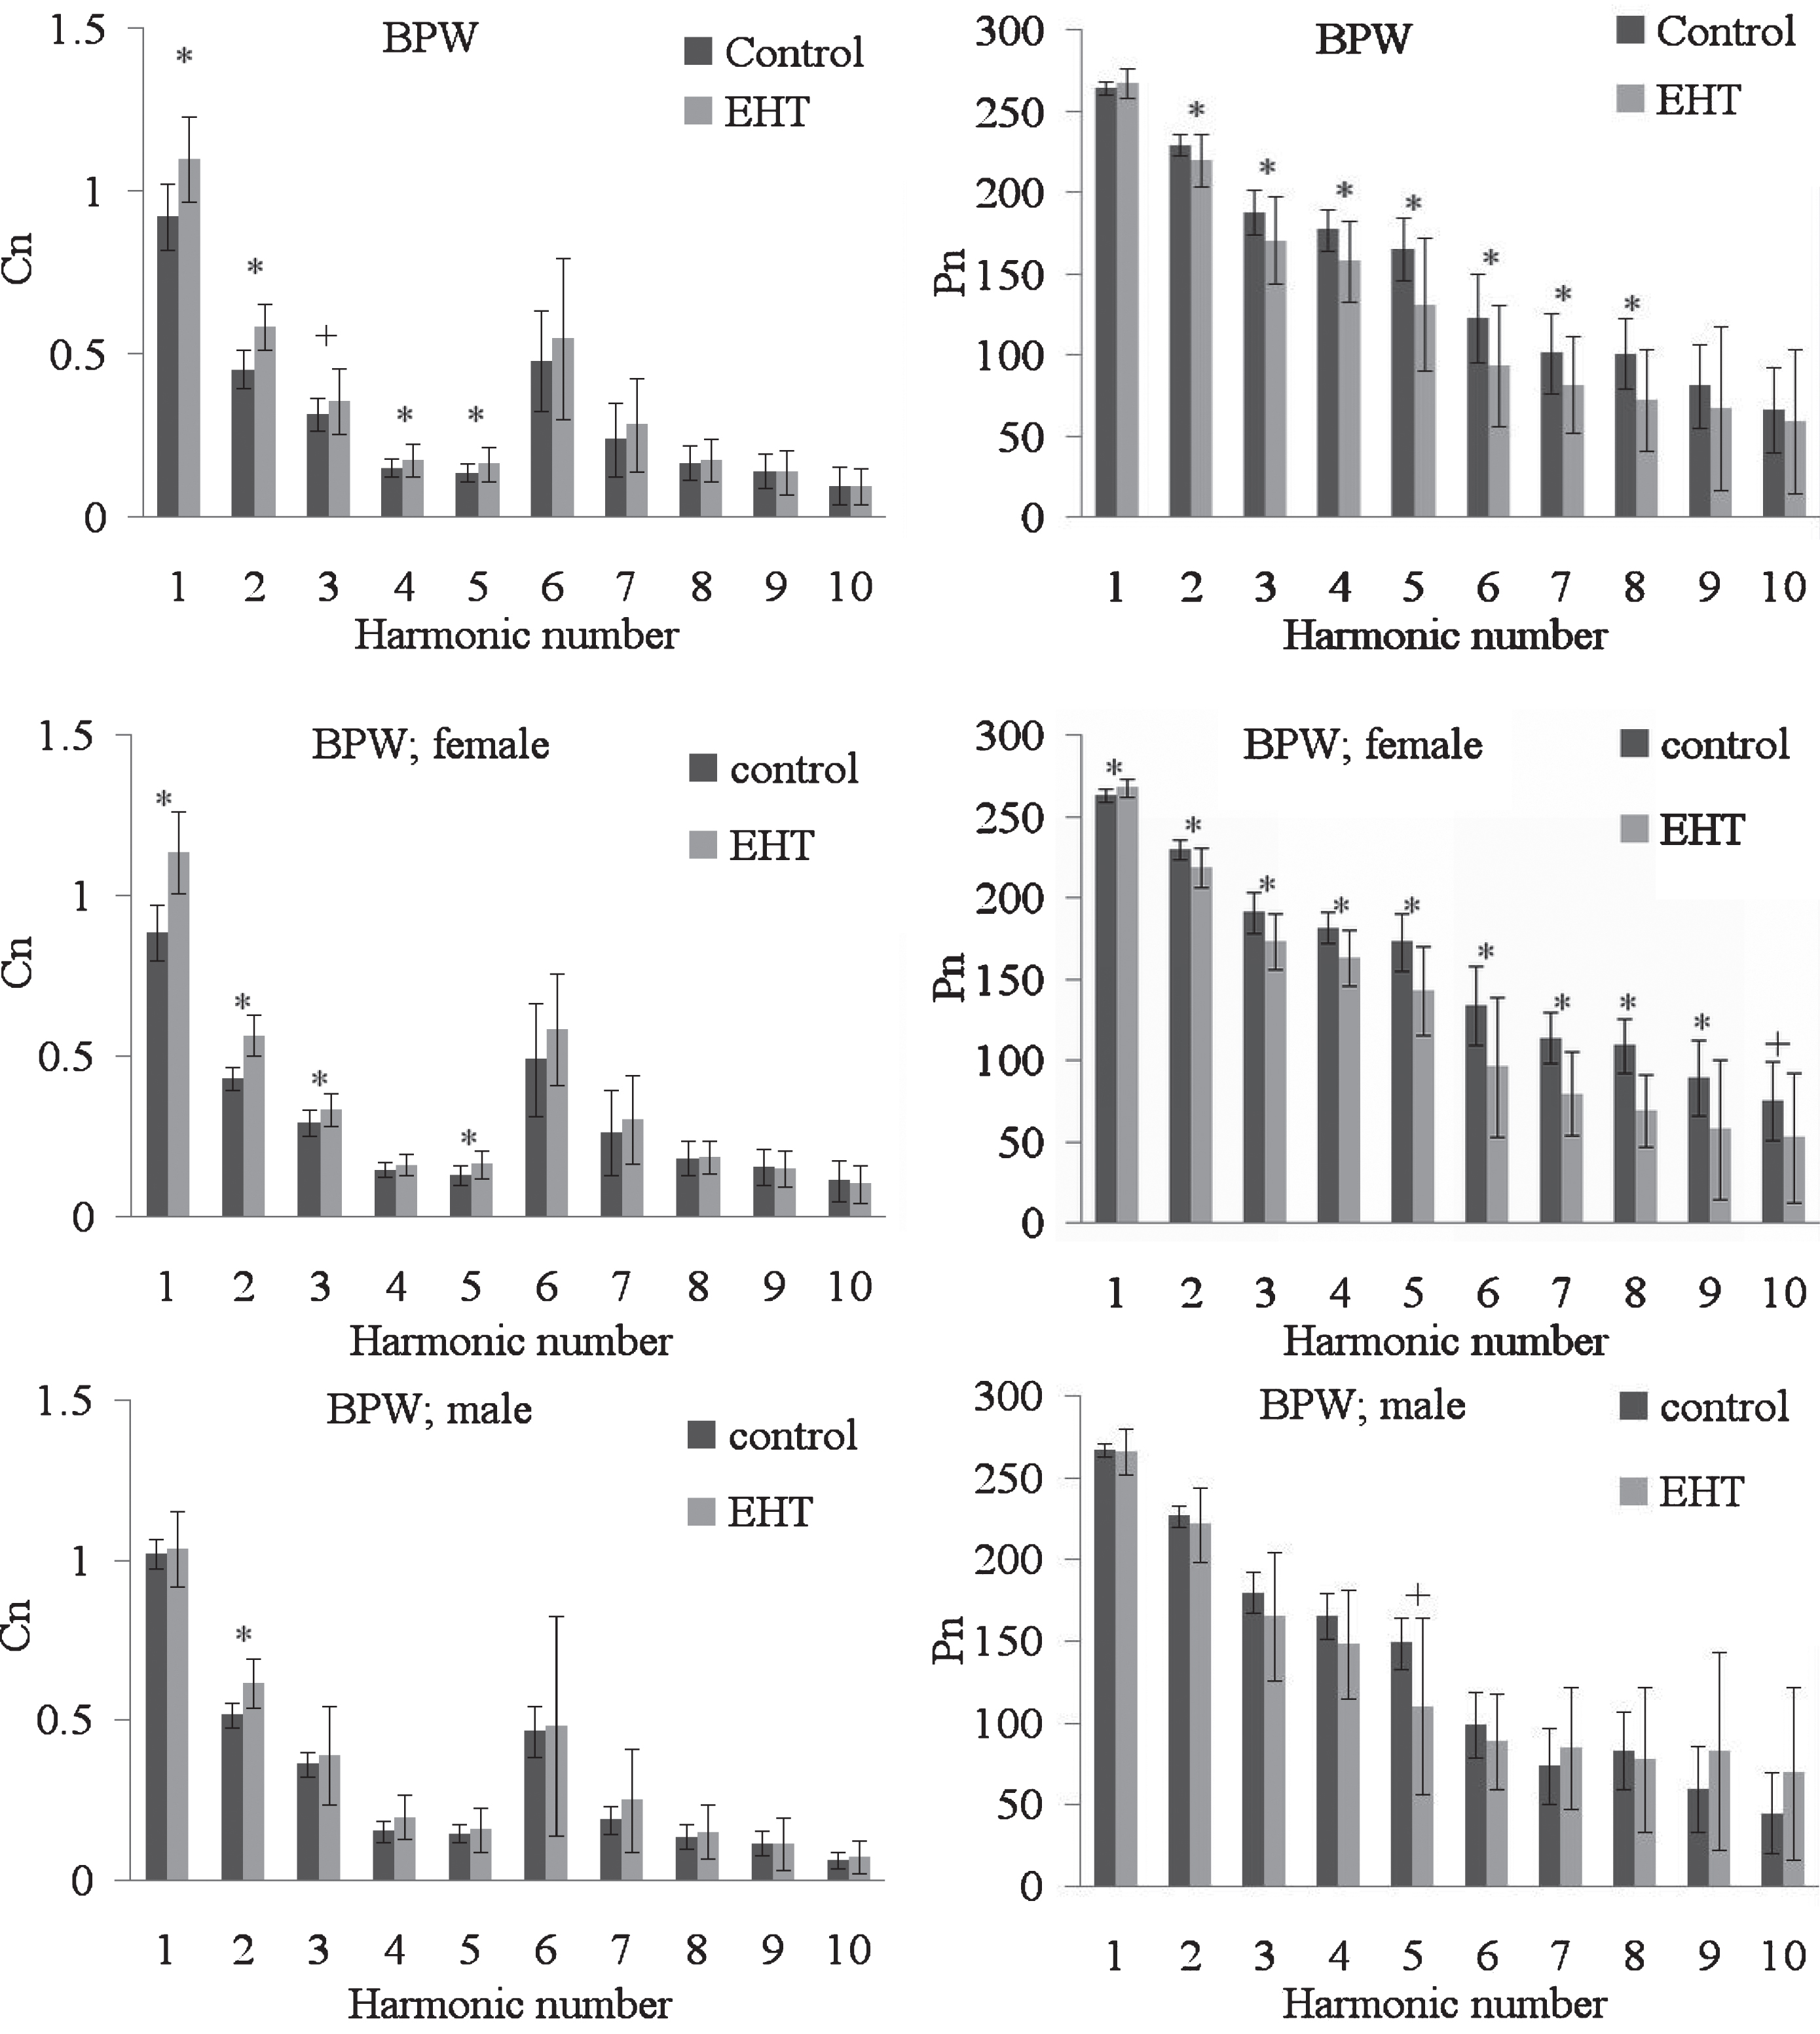
Comparison of harmonic indices [amplitude proportion (C n ) and phase angle (P n ) of each harmonic component n] of the BPW. C6–C10 values have been multiplied by 5 to make the differences clearer. *, p < 0.05; + 0.05 < p < 0.1. C1, C2, C4, and C5 were significantly larger in Group EHT than in Group Control. The P2–P8 phase-angle indices were significantly smaller in Group EHT than in Group Control. Comparison between the sexes revealed that the differences were more prominent in female than in male subjects. Data are mean±standard-deviation values.
Table 2 lists correlation coefficients for the correlations between DBP and LDF indices in EHT patients. There were significant corresponding changes with positive slopes for AD, FDT_CV, and FRT_CV in male EHT patients, whereas there were no significant corresponding changes in female EHT patients. Figure 5 illustrates the significant positive correlation between DBP and FRT_CV values in male EHT patients.
Correlation coefficients (R values) for the correlations between DBP and LDF indices in EHT patients (*, p < 0.05 by F-test). There were significant corresponding changes with positive slopes for AD, FDT_CV, and FRT_CV in male EHT patients, whereas there were no significant corresponding changes in female EHT patients
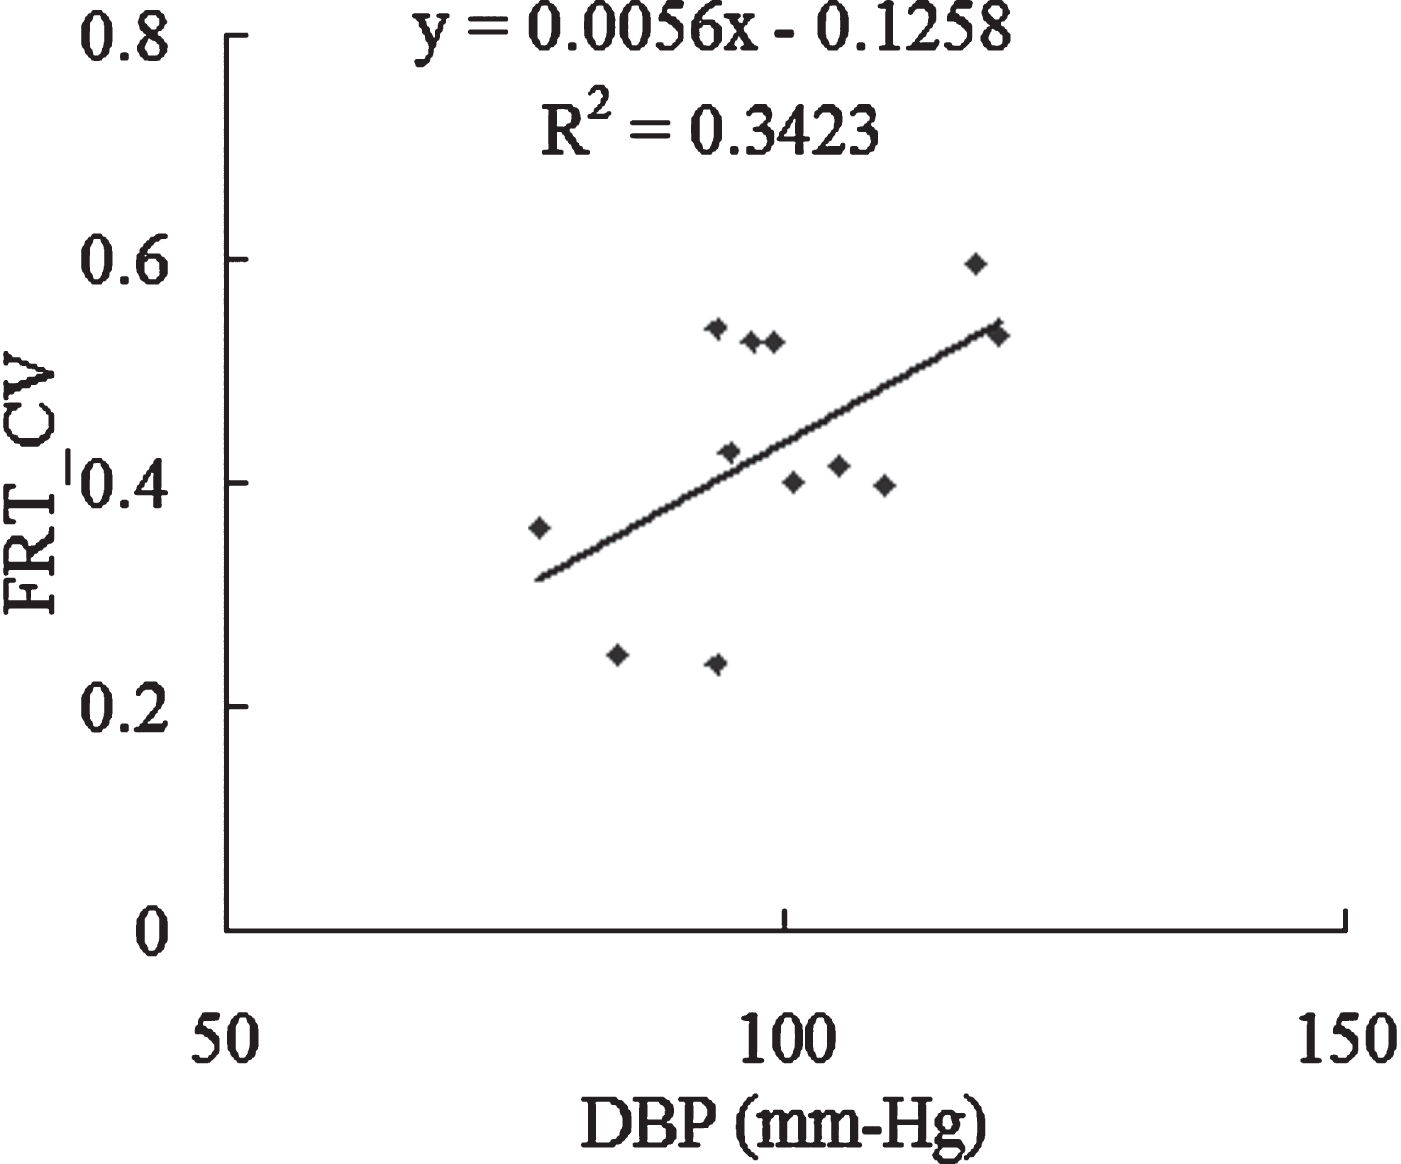
There was a significant positive correlation between DBP and FRT_CV in male EHT patients (p < 0.05).
This study found significant differences in various spectral indices of the radial BPW and in the beat-to-beat and spectral indices of skin-surface-acquired LDF signals between EHT and control groups. As conjectured below, these findings could be at least partly attributed to changes in the MBF supply condition and the microcirculatory regulatory activities that accompany the hemodynamic changes induced by EHT.
The following conjecture involving the cardiovascular regulatory activities of the blood flow distribution is based on the changes observed in the indices analyzed in this study. Pushed by the propelling force of the BP pulse generated by the heartbeat and transmitted along the artery, the MBF supply can be driven into the capillaries via the AO. During the adjustment process, the increased BP associated with EHT may change the vascular properties (e.g., stiffening of the vessel wall or enlargement of the vessel diameter) [29–31], thereby affecting the transmission condition of the arterial pulse and thus changing the pulse waveform. At the same time, there can also be accompanying changes in the local blood flow perfusion and its regulatory activities.
Time-domain beat-to-beat indices
For the time-domain beat-to-beat LDF indices, Fig. 2 reveals that PW and AD were significantly smaller in Group EHT than in Group Control. According to Poiseuille’s equation, smaller-diameter AO allow less blood to flow through them, and a shorter PW might correspond to a shorter proportion of time that AO are open with a larger diameter. Since AD refers to the ratio between AC and DC components of the LDF signals, it can be used to evaluate the efficiency of pushing blood through the AO at a certain mean flow rate. The present changes in AD and PW can therefore be related to the induced skin-surface changes in the MBF perfusion condition [18, 21]. Table 1 reveals that the SBP and DBP were increased in Group EHT. A larger propelling force and a worse MBF perfusion imply a worse perfusion efficiency of the skin-surface MBF supply. This illustrates that AD and PW can be used to aid noninvasive evaluations of the decreased blood-flow efficiency through AO induced by EHT.
Spectral BPW indices
Figure 4 reveals that the amplitude proportions of the lower-frequency components (C1–C5) that represented most of the BPW power were generally significant larger in Group EHT than in Group Control (with marginal difference for C3). Moreover, all of P2–P8 were significantly smaller in Group EHT than in Group Control. These findings illustrate that by performing future work with a greater number of subjects and centered to evaluate their diagnostic capacity, the spectral BPW indices could aid the discrimination between EHT patients and control subjects.
It has been noted that regulatory mechanisms in EHT may lose their stabilizing ability (leading to abnormal blood flow perfusion) when facing various conditions that may change the hemodynamics, such as vascular or even psychological factors. When the blood flow supply becomes abnormal, the BP can increase in order to increase the force pushing the blood into the tissues.
The mechanisms underlying the present findings for BPW indices can be partly attributed to efforts to restore the main frequency components, perhaps with the aim of maintaining the force driving blood through the AO. For example, the larger C1–C5 values may be the consequences of such compensation effects. Since these lower-frequency components represented most of the power within the arterial pulse, it is possible that increases in the amplitude proportions of these components can help to maintain the force driving the blood into the tissues in most parts of the body.
The phase-angle indices represent the time delays of individual frequency components within the arterial pulse waveform, and therefore can also be used to evaluate the transmission condition of the arterial pulse. A larger phase angle indicates a phase lead of the pulse-wave transmission, and therefore larger BPW phase angles might indicate better transmission efficiency for the arterial pulse. P1 was slightly increased whereas P2–P8 were significantly smaller in Group EHT compared to Group Control. The first frequency component represents the largest proportion of the BPW. It is possible that decreases in the amplitude proportions of the higher-frequency components can increase differences in phase angles and thus enhance the phase-lead condition between the first and the other frequency components; this may help to maintain the transmission efficiency of the main (first) frequency component of the arterial pulse.
The BPW and LDF indices can also be compared when evaluating the transmission efficiency of the vascular system. EHT patients had smaller AD and PW values (time-domain LDF indices) and increased amplitude proportions of the main components (C1–C5) of the spectral BPW indices. This illustrates that even if the EHT patients have a higher BP (the mean term of the perfusion driving force) and also larger amplitude proportions of the main frequency components (the pulsatile term of the perfusion driving force), their AD and PW can be smaller than those of control subjects. This implies that even though the driving force is larger in EHT patients, the blood flow perfusion is worse than in control subjects (what is in good agreement with earlier capillaroscopic studies [32, 33]); these findings indicate that the present measurements might be useful for evaluating the perfusion efficiency in EHT.
Peripheral target organ damage can be explained by the arterial stiffness gradient hypothesis [34]. Some indices, such as aortic-brachial PWV ratio, can also help to evaluate the changes in aortic stiffness and its central-peripheral mismatch, providing information regarding elastic and muscular arteries [35]. These indices can allow predicting the response of the entire arterial tree to the pathological condition of subjects with some specific cardiovascular disease, such as in end stage renal failure [35, 36]. Because both aortic and brachial stiffness are influenced in a similar manner with mean arterial BP, the aortic–brachial PWV ratio is independent of mean arterial BP and hence could be of additional value in clinical practice [34, 36]. According to the calculation definition, the present spectral pulse indices may have the similar advantage. For example, each C n were normalized to Amp0 to minimize the possible distortion effects of different pulse amplitude; calculation of P n was also irrelevant of the pulse amplitude. These indices can therefore be suitable as a BP-independent parameter of vascular aging induced by cardiovascular disease, such as in hypertension.
Beat-to-beat LDF variability indices
Since the beat-to-beat LDF parameters can help to evaluate the opening condition of the AO, it has been suggested that their variations can be attributed to various regulatory mechanisms acting on the on-off tuning activities of the AO, and thus could be suitable for monitoring the microcirculatory regulatory activities in the local vascular beds [18–20]. The present results indicated that the AD_CV and FRT_CV MBF variability parameters were significantly smaller in Group EHT than in Group Control. It is possible that when the cardiovascular system faces a decreased MBF supply induced by EHT, this reduces the degrees of freedom available for the microcirculatory regulatory activities, and thus leads to decreases in AD_CV and FRT_CV. It is also possible that the decreased MBF supply to the skin-surface vascular beds impairs some of the microcirculatory regulatory rhythms that also lead to decreases in AD_CV and FRT_CV in EHT patients. Therefore, changes in the microcirculatory regulatory activities can be further disclosed by the spectral analysis of LDF signals.
Hypertensive wall thickening has been suggested to be one of the main compensatory mechanisms to preserve circumferential wall stress; media thickening might be related to the smooth muscle alterations found in hypertension [37]. Local alterations of arterial elasticity can cause changes in the pulse pressure waveform. It is possible that during activation of these adaptations, the present pulse waveform can be affected by these adaptive mechanisms. It can be another factor to limit the degrees of freedom for the microcirculatory regulatory activities; it may also lead to decreases in LDF variability indices in EHT patients.
Spectral LDF indices
There is growing evidence that spectral analysis of the low-frequency periodic oscillations in LDF measurements can noninvasively provide mechanistic information about microvascular control mechanisms [9, 22–24]. One of the fundamental features of precapillary arterioles is their high vasomotor activity, which manifests in periodic changes in the tone and value of the lumen of microvessels; such so-called vasomotions at the level of precapillary arterioles regulate the delivery of blood to the exchange vessels [2]. Active mechanisms (endothelial, neurogenic, and myogenic) directly impact the microvascular smooth-muscle cells and, as a result of vasomotions and periodic changes in blood flow resistance, induce relevant oscillations in the blood flow [2]. The spectral analysis of LDF signals has been used as an additional noninvasive method to study the pathophysiology of local blood flow regulation in various disease states [3, 9]. For example, it has been suggested that local regulatory mechanisms in the volar and gaiter areas are impaired in EHT patients [5]. A lower scaling exponent in the basal condition was reported previously, which implies impaired local control of the skin blood flow in EHT patients [3].
The principal finding from the spectral analyses performed in the present study was that the REC of FR2 was significantly smaller in Group EHT than in Group Control. It has been suggested that the REC of FR2 is associated with the microcirculatory regulatory activity of neural functions. Neurogenic regulation of the skin blood flow involves activation of heat-sensitive afferent sensory nerves and sympathetic activity. EHT has been noted to reduce the neurogenic and total power contributing to skin vasomotion during local skin heating [9]. In the present study, the environmental and skin temperatures were kept stable throughout the measurement processes, and so the present changes in the REC of FR2 could be mainly attributed to the changes in the sympathetic activity induced by EHT. It is possible that the impaired innervation condition accompanying EHT decreases neural activity of the microcirculatory regulatory mechanisms, and thus leads to a significant decrease in the REC of FR2.
The REC of FR1 was significantly smaller in Group EHT than in Group Control among female subjects. It has been suggested that the REC of FR1 is associated with the role that the endothelium plays in microcirculatory regulation. The endothelium has been found to perform several critical functions, such as regulating the passage of nutrients, oxygen, and other solutes from the bloodstream into tissues, and regulating blood flow. Endothelial dysfunction is a known characteristic of patients with EHT [4], who reportedly exhibit attenuated cutaneous NO-dependent vasodilation [9]. The present finding of a decrease in the REC of FR1 could therefore be attributed to vascular endothelial dysfunction induced by EHT in females.
Sex differences in the results
The present results highlighted sex differences in the BPW and LDF responses. As listed in Figs. 2–4, there were significant differences in beat-to-beat, variability, and spectral LDF indices between female EHT patients and control subjects, whereas there were fewer significant differences among male subjects, with no significant differences in BPW phase-angle indices, beat-to-beat LDF indices, or spectral LDF indices.
Sex differences in the regulation of BP (which can in turn affect the MBF supply) have been noted in hypertension patients. For example, the loss of estrogens may be involved in the higher BP in females after menopause [38]. Estrogen has been shown to stimulate NO production, and it is possible that with the loss of estrogens at menopause, the unopposed effect of androgens in postmenopausal females contributes to their elevated BP [39, 40]. Androgens such as testosterone also play an important role in sex-associated differences in BP regulation [41]. Renin activity is higher in males than in females. Sex differences in aspects of the renin-angiotension system have been reported [42, 43], and they may play a role in mediating sex differences in BP regulation. Androgen-mediated increases in angiotension II could lead to a shift in the pressure–natriuresis relationship and renal vasoconstriction, both of which can affect BP [39].
Since most of the female subjects in the present study were postmenopausal, loss of estrogen secretion and thus possibly the decreased NO production may have decreased their MBF supply, and hence led to decreases in PW and AD in the female EHT patients. The changes in the skin MBF perfusion condition might increase regulatory activities to adjust the blood flow supply, and hence lead to the increased AD_CV in female EHT patients. Regarding the spectral indices, the decrease in the REC of FR1 in female EHT patients can be partly attributed to the decreased endothelial secretion of vasoactive substances, while the decrease in the REC of FR2 could be related to neural impairment accompanying a decreased MBF supply.
Figure 5 and Table 2 indicate that there were significant positive correlations between DBP and some of the LDF indices (AD, FDT_CV, and FRT_CV) in male EHT patients, whereas there were no significant correlations in female subjects. Facing the abnormal BP increases in male EHT patients, the cardiovascular system may increase the regulatory activity (perhaps with the aim of maintaining the homeostasis of BP values), possibly leading to increases in the LDF variability indices and hence also to a positive correlation between LDF variability indices and BP values in male EHT patients. In contrast, it is possible that the effects of the loss of estrogen in female EHT patients can reduce the degrees of freedom for the microcirculatory regulatory activities, hence making this correlation less prominent in female than in male EHT patients.
The present study was limited by its relatively small sample; therefore collecting more data is an important issue for future studies.
Conclusion
The following conclusions can be drawn from the present results: BP and LDF waveform analyses, such as of spectral BPW indices and beat-to-beat LDF indices, can aid noninvasive evaluations of the blood-flow perfusion efficiency in EHT. Spectral LDF indices can help to understand the changes in the microcirculatory regulatory activities induced by EHT. Sex differences are evident in spectral BPW indices, beat-to-beat LDF indices, spectral LDF indices, and the correlations between DBP and LDF indices in EHT patients.
Footnotes
Acknowledgments
The authors would like to thank the Ministry of Science and Technology (MOST 108-2221-E-011-112) and Taipei Medical University Shuang-Ho Hospital (105-TMU-SHH-25) for partial support of this work.
Conflicts of interest
The authors declare no conflict of interest.
Funding
This work was partly supported by Ministry of Science and Technology (MOST 107-2221-E-011 -014), and Taipei Medical University Shuang-Ho Hospital (105-TMU-SHH-25).
Informed consent
Informed consent was obtained from all individual participants included in the study.