
Abstract
BACKGROUND:
Savitzky-Golay filter is a digital filter used in data smoothing, we introduced a contrast-enhanced ultrasound (CEUS) quantification software based on the filter (SGCQ).
OBJECTIVE:
To explore the methodology of analyzing hepatic tumors hemodynamics applying SGCQ software and the correlation between SGCQ parameters and hepatocellular carcinoma (HCC) angiogenesis.
METHODS:
Nighty-seven right-lobe located hepatic mass cases (15 females and 82 males, mean age 58±10y, mean lesion size: 39.9±11.6 mm) underwent CEUS scan preoperatively and had a final diagnosis of HCC (n = 52) or colorectal cancer metastatic liver tumors (MLT, n = 45) were included. CEUS was carried out using a 1–5 MHz convex probe. The CEUS clips were recorded and analyzed off-line to obtain the parameters. The parameters were analyzed by 3 observers separately to investigate inter-observer variability. Parameters were compared between tumor and adjacent liver and between different tumors. Immunohistochemistry was used to evaluate the microvessel density (MVD) of HCC, and the correlation between the parameters and MVD was analyzed.
RESULTS:
Intraclass correlation coefficient (ICC) of all parameters were greater than 0.75 except wash-in slope (a3) and time to peak (TTP) of adjacent liver. The parameters of a3, wash-out slope (a2), perfusion time (PT) and area under the curve (AUC) were significantly different between HCC and liver. The a2, a3, AUC, PT and enhanced intensity (EI) were significantly different between MLT and liver. AUC, a2, a3, da1 and dPI were significantly different between HCC and MLT. AUC, a2 and EI correlated with MVD.
CONCLUSION:
SGCQ software quantification have good consistency among three observers, the parameters of SGCQ can display the hemodynamics of HCC and MLT and the difference between them. AUC and EI can serve as useful biomarkers in tumor angiogenesis evaluation.
Keywords
Introduction
Savitzky-Golay filter was first popularized by Savitzky A and Golay M in 1964 [1], it is a digital filter that can be applied to a set of data points to smooth the data, after that improvement was made to extend the application of the filter, now it has been widely used in many fields, the process was achieved by the method of linear least squares. The predominate advantage of this filter is that while signal-to-noise ratio is increased, the signal is not greatly distorted and the width of the signal remains unchanged during the procedure [2].
The clinical practice of contrast-enhanced ultrasound (CEUS) allows for the acquisition of integrated dynamic perfusion data of organs and focal lesions, two-dimensional data sets of time and acoustic intensity of different perfusion phases are successively obtained through the recording of the examination. During the examination, respiration, circulation and digestion of the subject may lead to motion of the target organ to varying degrees, the inclination and transposition of the transducer may also move the region of interest (ROI) out of the observing plane, the out of ROI frames are the noise in the data sets. Here we introduced a Savitzky-Golay filter based CEUS quantification (SGCQ) software, by applying the theory in data smoothing, the relative maximum, minimum and the width of the data were reserved, therefore, we expect the software to reserve important perfusion characteristics while obtaining a smooth time-intensity curve (TIC). Hepatocellular carcinoma (HCC) is the most common primary malignant hepatic tumor [3]. Fifteen to twenty percent of colorectal cancer (CRC) patients present synchronous liver metastasis at the time of diagnosis, approximately 50% of CRC patients ultimately develop liver metastasis [4, 5]. This study quantitatively analyzed the perfusion of HCC and colorectal cancer metastatic liver tumor (MLT) applying SGCQ software, aiming at verifying the consistency of the software and investigating the preliminary results of the analysis.
Methods
The study was approved by our Institutional Ethics Committee, and written informed consent was obtained from every patient at enrollment.
Subjects
A total of 97 hepatic mass cases underwent CEUS scan preoperatively and had a final diagnosis of HCC or CRC metastatic liver tumor were included in our study over a 24-month period. All hepatic lesions conformed to following conditions: located at the right lobe, the longest diameter of tumors between 2 to 6 cm, depth (the distance from the surface of the probe to the center of the lesion) between 3 to 8 cm. After 8 tumors were excluded due to motion and artifacts which impeded the right fitting of time-intensity curve, we eventually included 50 HCC tumors of 49 cases (9 women and 40 men; age range, 27–77 years; mean age 57 years), lesion size ranged from 2 to 6 cm (mean±standard deviation, 3.84±1.13 cm), lesion depth ranged from 2.2 to 7.7 cm (mean±standard deviation, 4.8±1.4 cm), 44 MLT tumors of 40 cases (6 women and 34 men; age range, 27–84 years; mean age 60 years), lesion size ranged from 2.3 to 6.0 cm (mean±standard deviation, 4.2±1.2 cm), lesion depth ranged from 3 to 8 cm (mean±standard deviation, 5.3±1.5 cm). Diagnostic confirmation of the 94 tumors was all made at resection.
Image acquisition and quantification analysis
US scans were obtained by one radiologist with over 5 years of contrast-enhanced ultrasound experience, imaging equipment was Philips iU22 system (Philips, Amsterdam, Holland) with a C5-1 convex probe (1–5 MHz). A routine US scan was performed to locate the lesion and the best plane to observe it, then a 20-gauge syringe was used for a bolus injection of 2.4 mL SonoVue (SonoVue; Bracco, Milan, Italy) through antecubital vein, followed by 5 mL saline flush. Dynamic scanning of the lesion and adjacent liver parenchyma was continuously performed of at least 150 sec to observe the dynamic enhancement, and the clip was saved as DICOM format.
Quantification analysis was performed offline on SGCQ software platform (Fig. 1a, 1b). A motion compensation calibrating region with enough gray-scale contrast was drawn on the baseline conventional screen of dual image, then motion compensation was automatically performed. The region of interest (ROI) of the lesion was defined on the frame of highest enhanced intensity in arterial phase, and another ROI was drawn on adjacent liver, avoiding artifacts, major vessel and gallbladder. Time intensity curve (TIC) was automatically fitted by the software, and the parameters and the goodness of fitting index (GOF) were presented in the form of excel, a fitting of a GOF less than 0.6 was excluded.
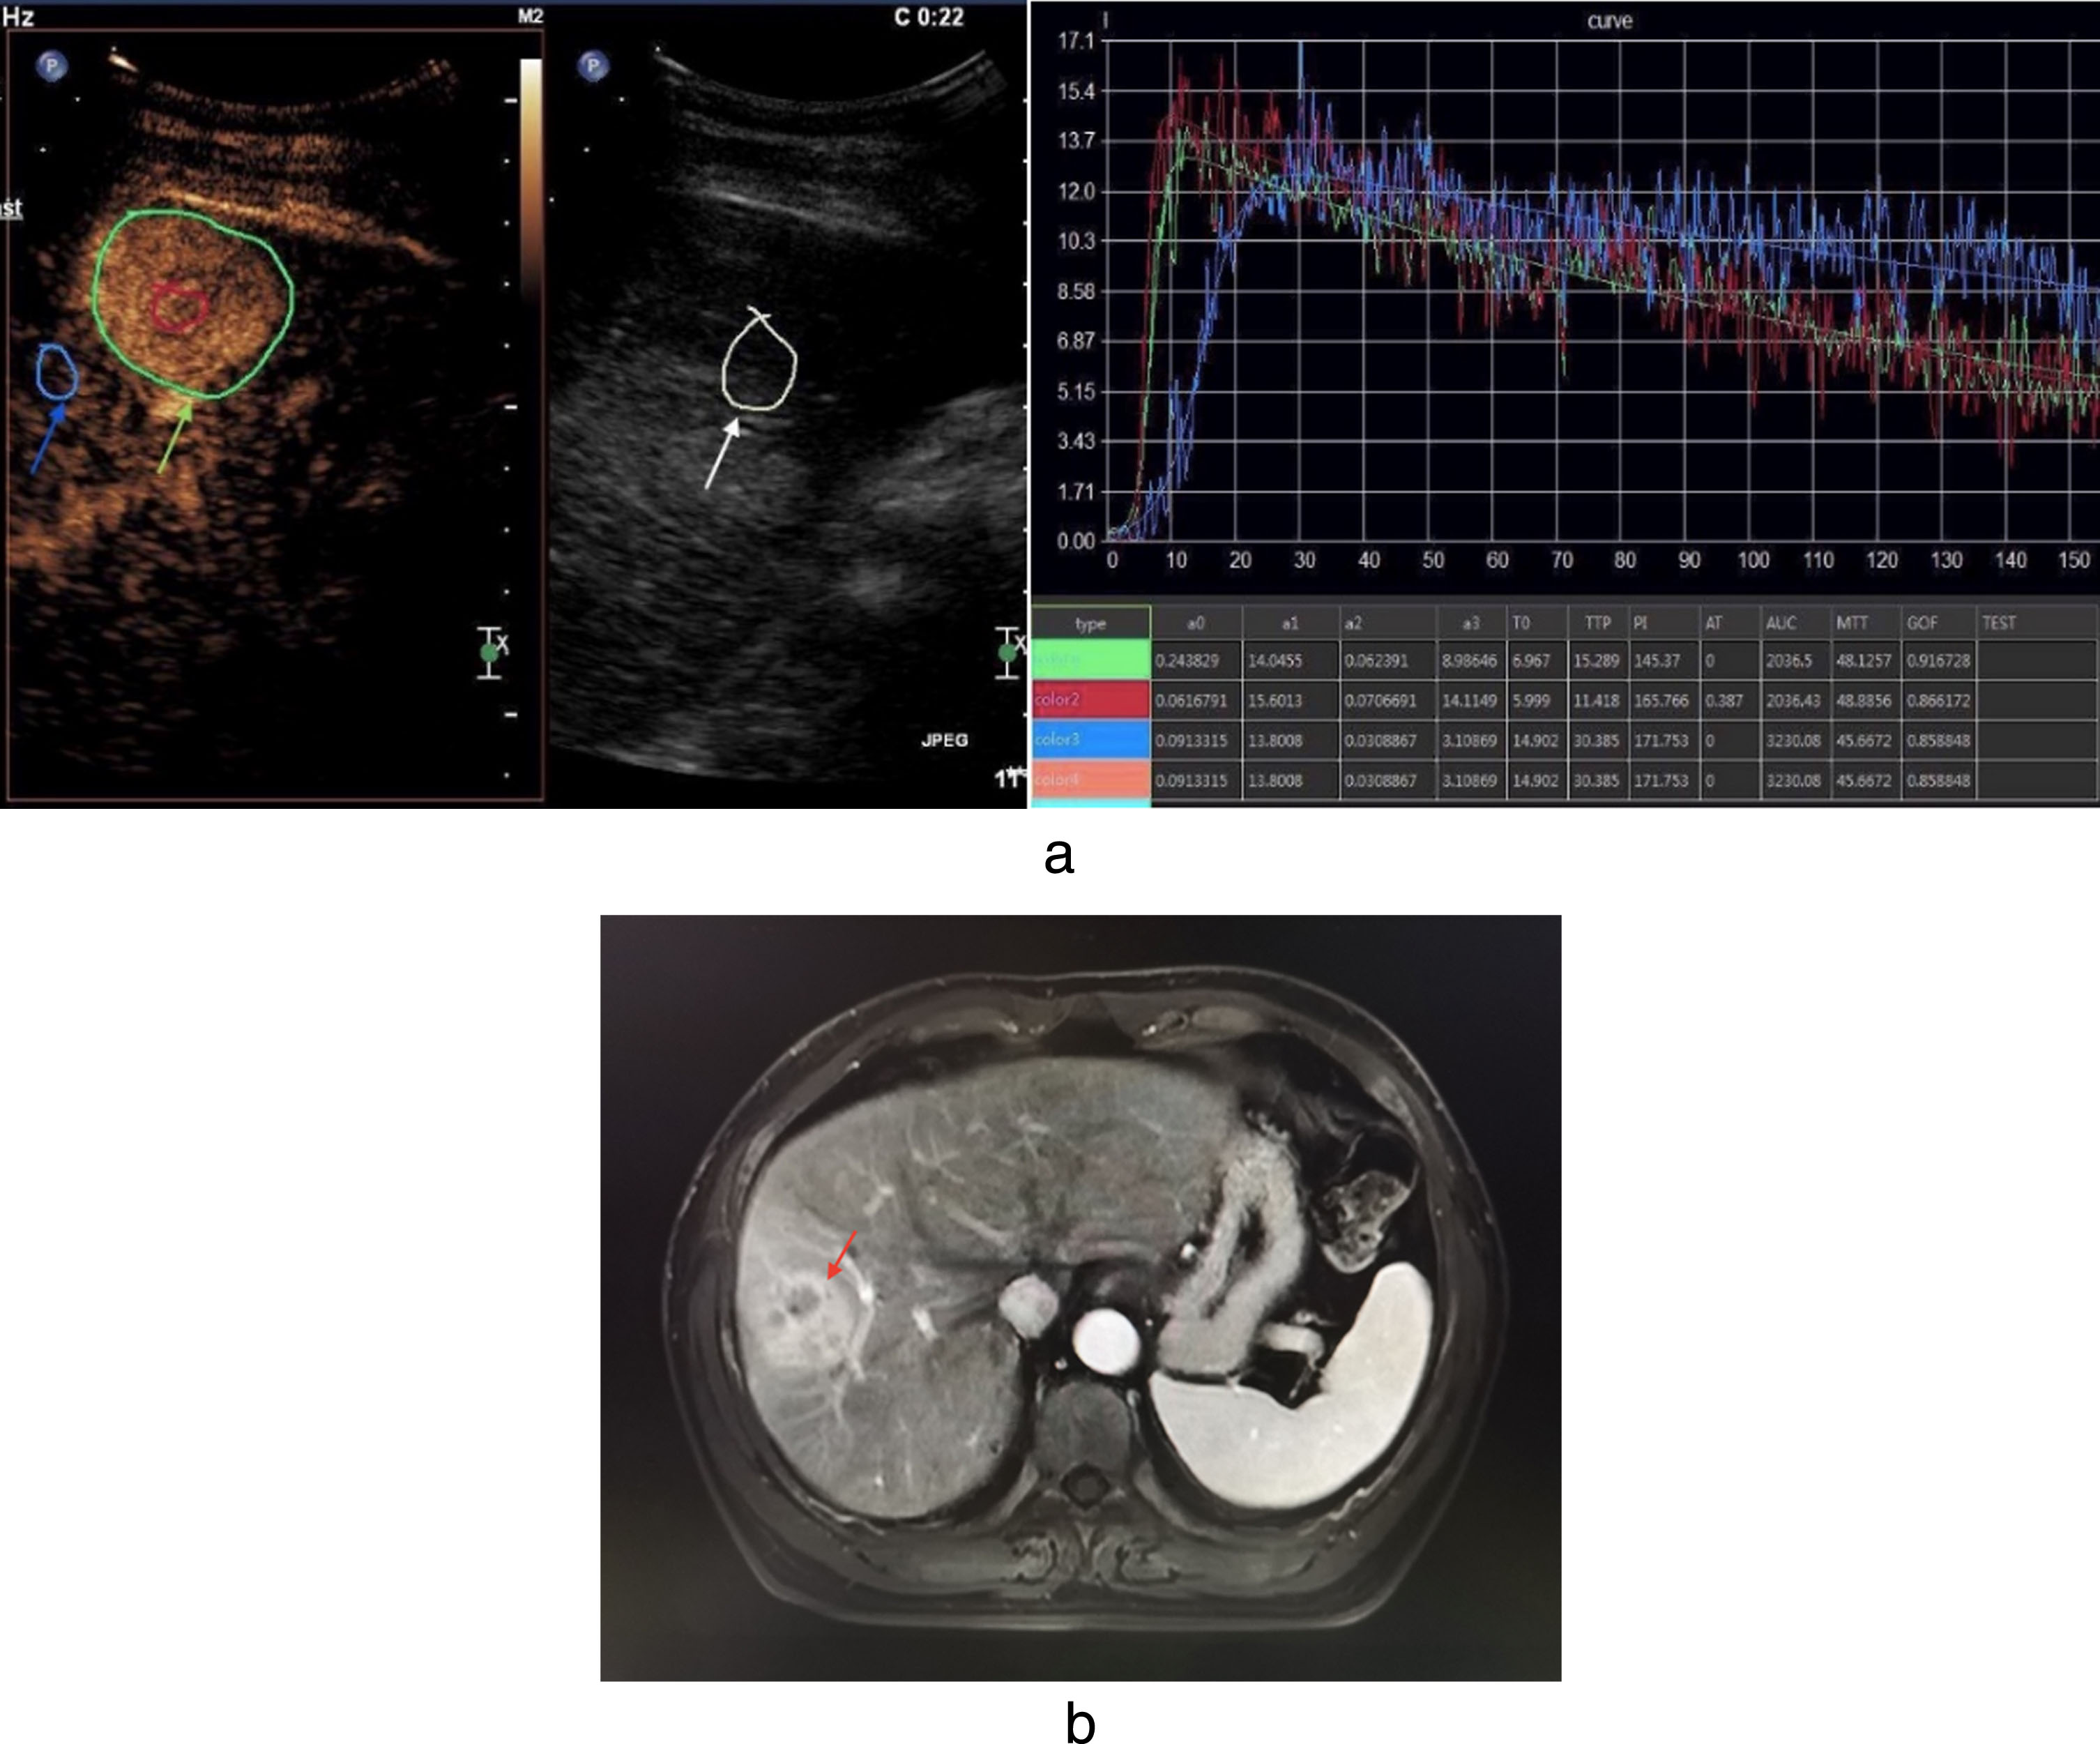
a. The interface of SGCQ software shows a HCC case, female, 47y. White arrow: motion compensation calibrating region; green arrow: ROI of the tumor; blue arrow: ROI of adjacent liver area. b. The arterial phase MRI image of the same patient. Red arrow: lesion.
Twenty-one tumors from 21 cases (2 women, 19 men; 5 HCC, 16 MLT) were randomly selected for consistency analysis and the quantification analysis was performed by three researchers separately, each was blind of other results. The quantification of the rest cases was performed by one of the three researchers.
Data processing
SGCQ software provides a total of 10 perfusion parameters (Table 1), to avoid the difference of the speed of bolus injection and the structure of the circulation system between patients and to simplify the following research at the same time, we investigated two methods. Firstly, we defined two parameters, perfusion time, time to peak (TTP) subtracts arrival time (AT), and enhanced intensity, peak intensity (PI) subtracts a0, then we selected a few commonly used parameters [6], wash-in slope a3, wash-out slope a2, area under the curve (AUC) and mean transit time (MTT), secondly, we used the parameters of the adjacent liver area to standardize the parameters of the tumor by subtraction, for example dAUC = (AUC of the tumor) - (AUC of the adjacent liver area). We used both methods in the comparison between HCC and MLT.
Parameters provided by the software
Parameters provided by the software
Thirty-seven HCC tumors with high-quality postoperative CD34 antibody staining tumor sections were included in MVD count, due to the retrospective character of our study, the cases without a CD34 antibody staining (n = 10) and those with poor staining (n = 3) were excluded in this part. A researcher blind of all quantification results accomplished the MVD count, the postoperative tumor section of CD34 antibody staining was examined, 5 areas of highest MVD at low power (100×magnification) were selected and an image was taken at high power (400×magnification) of the selected area and saved as TIFF format for further analysis. ImagePro Plus 6.0 (Media Cybernetics, Rockville, USA) was used in image processing and the count. Any brown-staining endothelial cell or endothelial cluster that was clearly separate from adjacent microvessels, tumor cells and other connective tissue elements was considered as a single countable microvessel, vessel lumina did not have to be present, even those distinct clusters of stained endothelial cells which might be from the same vessel snaking in and out of the section were considered distinct and countable as separate microvessels. Macrovessels, characterized by thick muscular walls or with lumina greater than eight red blood cells in diameter were excluded from the count [7]. The average of the five areas was recorded as the MVD level of the tumor (Fig. 2).
Statistical analysis
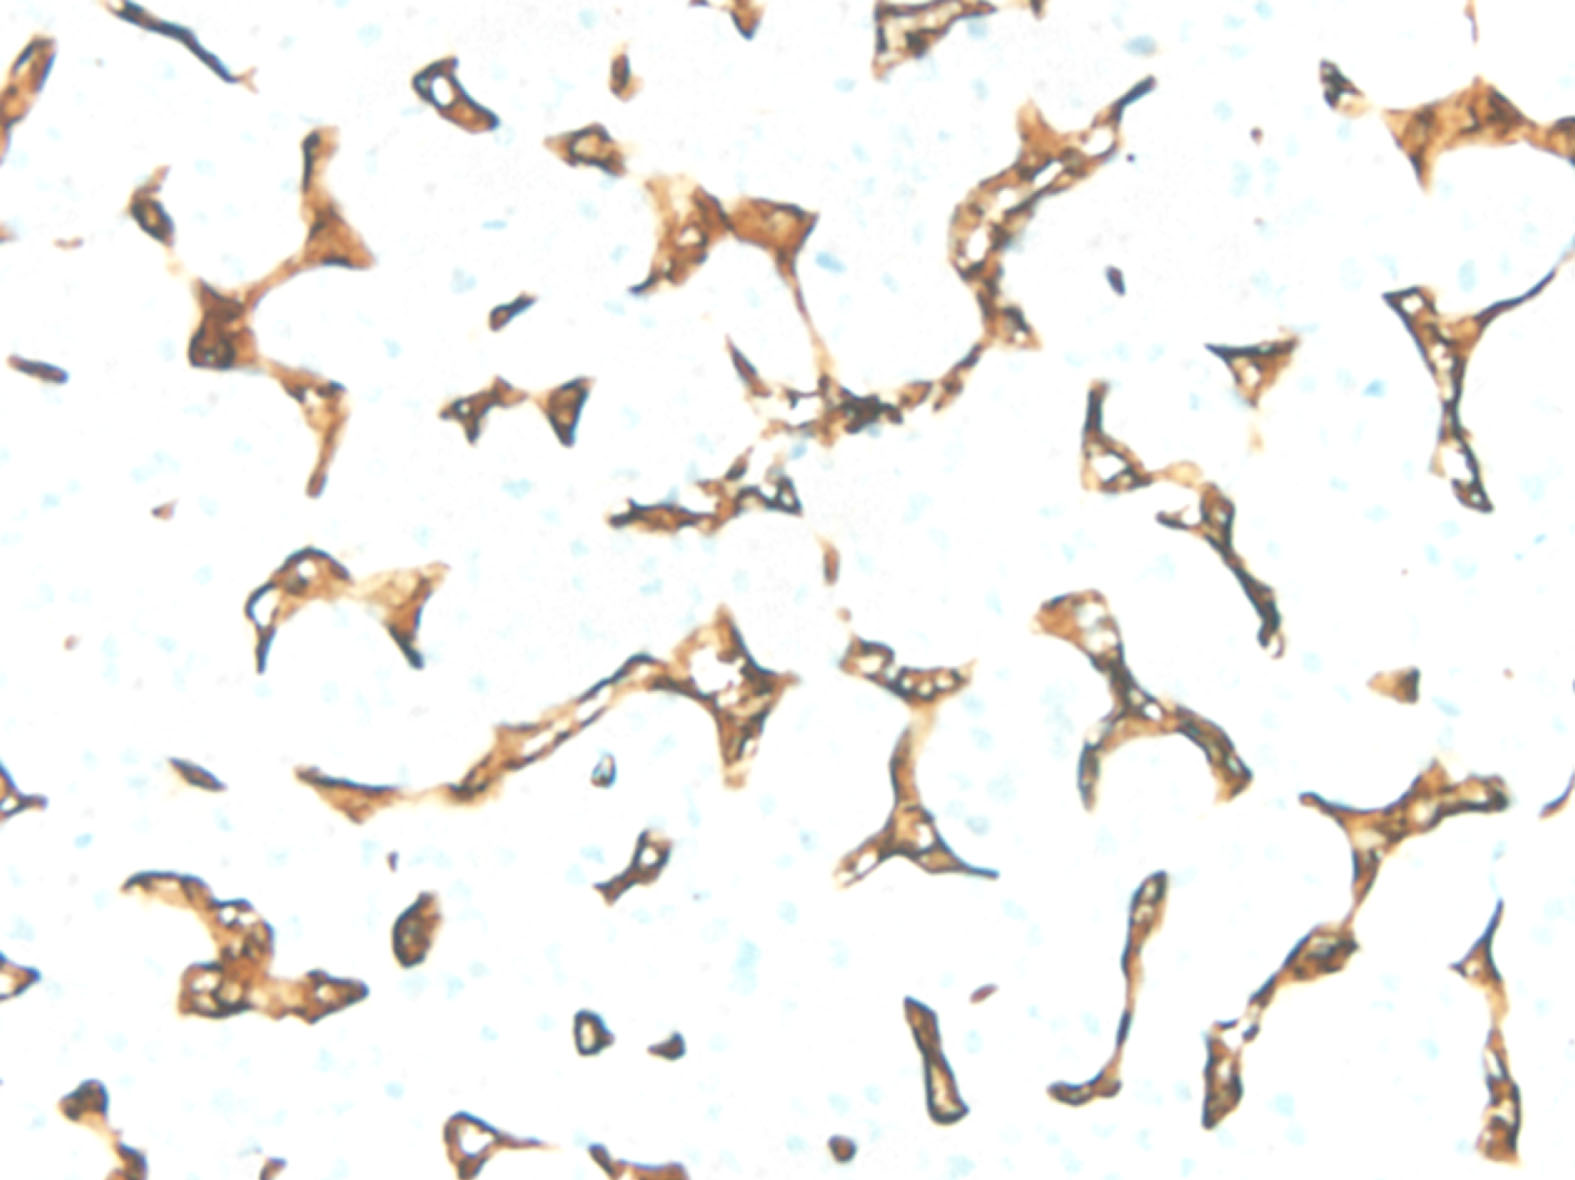
Female, 47y, HCC. The image of CD34 antibody immunohistochemical staining section (400×magnification).
All data was presented as mean±standard deviation, t test was used to compare between two parameters in line with normal distribution and variance homogeneity, otherwise Mann-Whitney test and Satterthwaite test were used. Further diagnostic performance was evaluated for significantly different parameters. In the consistency analysis part, two-way ANOVA was used to compare the analysis of three different researchers and intraclass correlation coefficient (ICC) was calculated. Spearman correlation was used to compare the parameters with MVD count. P < 0.05 was considered to indicate a significant difference. All statistcal analysis were performed on Stata/SE 14.0 for Mac (StataCorp, Lakeway, USA).
Consistency analysis
For the 21 tumors studied in our research, the ICC of all parameters provided by the software were greater than 0.75, the ICC of T0 among three tests is the highest (0.99), and AT the lowest (0.82), and for the 21 adjacent liver areas, the ICC of all parameters provided by the software were greater than 0.75 except for a3 and TTP, the ICC of AT is the highest (0.97), and a3 the lowest (0.64). F test was run to test the significance of ICC, and the F value of all parameters were greater than 1.84 (F0.05, 20, 40 = 1.84), all P value were less than 0.05 (Tables 2–3).
Consistency analysis of tumor
Consistency analysis of tumor
*Test1-3: quantification analysis performed by 3 researchers separately; ICC: intraclass correlation coefficient; F value: F0.05, 20, 40 = 1.84.
Consistency analysis of adjacent liver parenchyma
*Test1-3: quantification analysis performed by 3 researchers separately; ICC: intraclass correlation coefficient; F value: F0.05, 20, 40 = 1.84.
All selected parameters except for MTT and EI were significantly different between HCC tumor and adjacent liver, wash-in slope a3, wash-out slope a2 of the tumor was greater than that of adjacent liver (P = 0.0001, 0.0022, separately), PT and AUC of the tumor was less than that of liver (P = 0.0006, 0.0000, separately). Among the significantly different parameters, area under the receiver operating characteristic curve (AUROC) of a2, a3 and PT were greater than 0.7 (Table 4, Fig. 3).
Comparison between the tumor and adjacent liver of HCC and MLT
Comparison between the tumor and adjacent liver of HCC and MLT
*t value was calculated by using t test or Satterthwaite test; AUROC: area under ROC curve; 95% CI: 95% credential interval of AUROC.

ROC of PT in HCC analysis.
All parameters except for MTT were significantly different between MLT tumor and adjacent liver, wash-in slope a3, wash-out slope a2 of the tumor was greater than that of adjacent liver (P = 0.0000, 0.0000, separately), EI, PT and AUC of the tumor was less than that of liver (P = 0.0181, 0.0000, 0.0000, separately). Among the significantly different parameters, AUROC of a2, a3, AUC and PT were greater than 0.7 (Table 4, Fig. 4).
Comparison between HCC and MLT
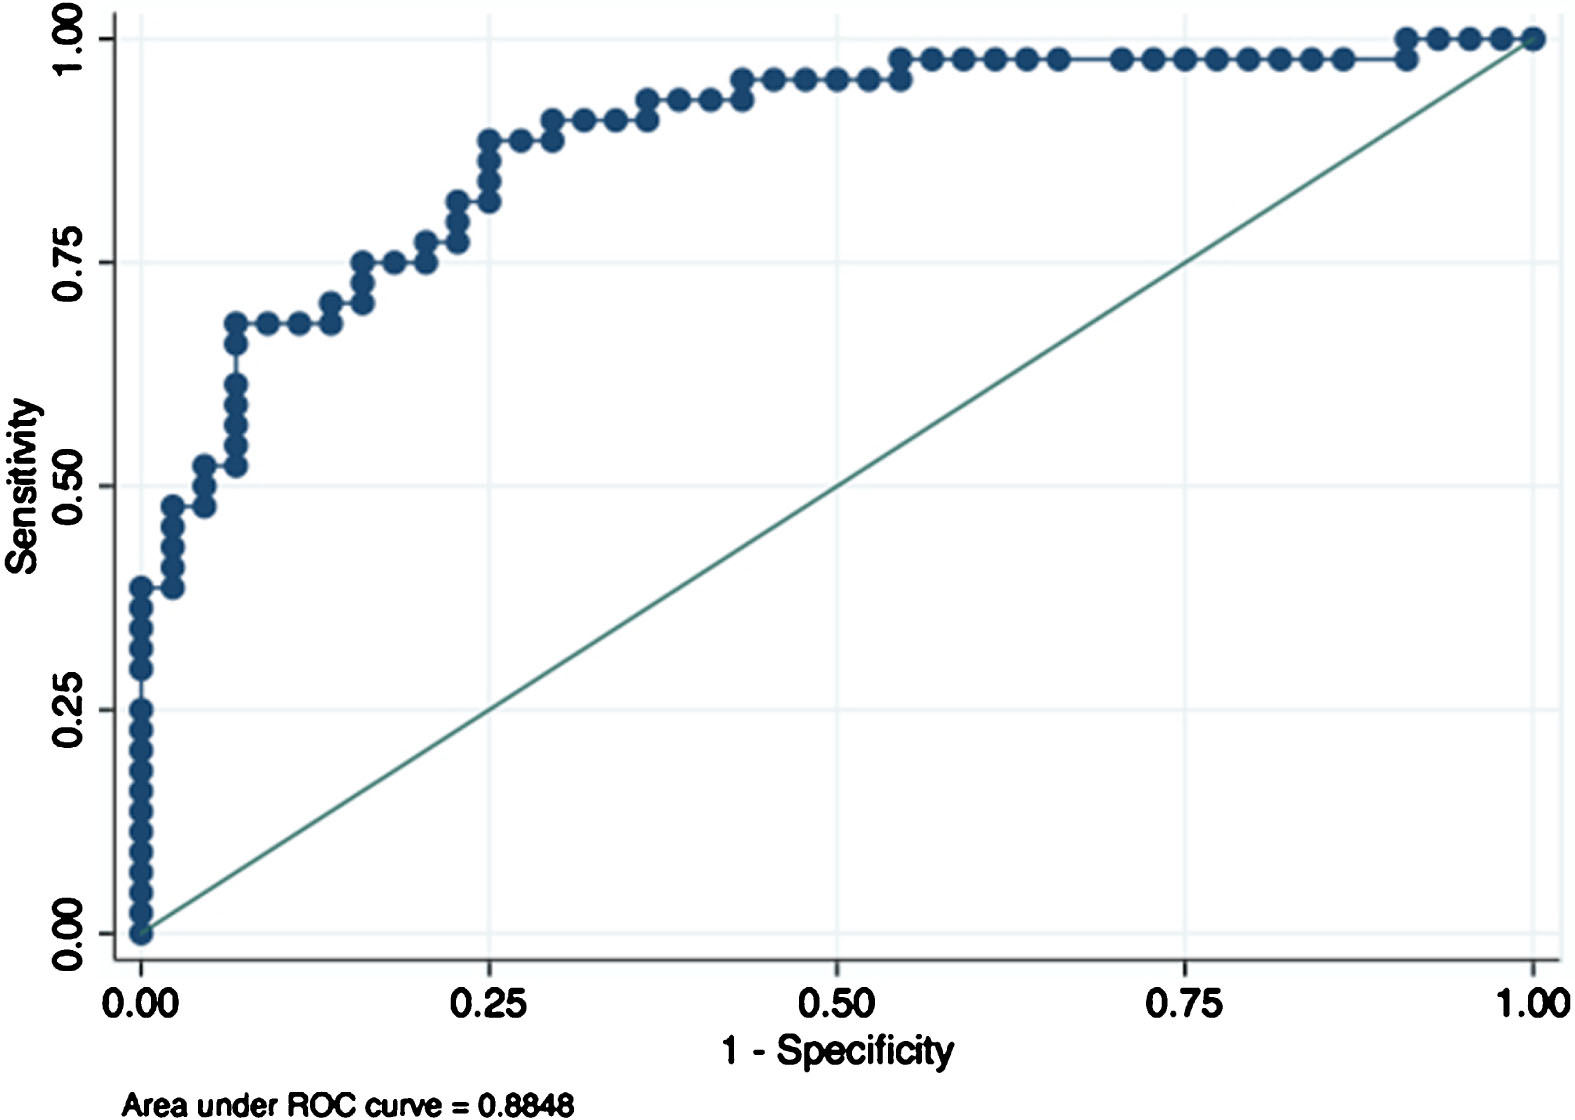
ROC of AUC in MLT analysis.
AUC, a2 and a3 were significantly different between HCC and MLT tumors, a3 and a2 of HCC tumor was greater than that of MLT tumor (P = 0.0030, 0.0005, separately), AUC of HCC tumor was less than that of MLT tumor (P = 0.0001), MTT, EI and PT had no significant difference between the tumors. Among the significantly different parameters, AUROC of parameter AUC and were greater than 0.7 (Table 5).
Comparison between HCC and MLT tumors
*t value was calculated by using t test or Satterthwaite test; AUROC: area under ROC curve; 95% CI: 95% credential interval of AUROC.
For the subtracted parameters da1, dPI, and dMTT were significantly different between HCC and MLT tumors, dPI and da1of HCC tumor was greater than that of MLT tumor (P = 0.0000, 0.0378, separately), dMTT of HCC tumor was less than that of MLT tumor (P = 0.0241), AUROC of dPI was 0.73 (Table 6. Fig. 5).
Comparison between HCC and MLT tumors
*t value was calculated by using t test or Satterthwaite test; AUROC: area under ROC curve; 95% CI: 95% credential interval of AUROC.

ROC of dPI in comparison of HCC and MLT.
The mean MVD count of 37 HCC tumors is 41±21, the Spearman correlation index between parameters and MVD count for a2, AUC and EI were r = –0.49 P = 0.0019, r = 0.72, P = 0.0000, r = 0.66, P = 0.0000, separately, a3, MTT and PT were not significantly correlated with MVD count.
Discussion
CEUS is a major development in the history of ultrasonography and is now widely used in the detection and characterization of focal liver lesions [6, 8–11]. Unlike CT and MRI, the contrast agents of ultrasound remain intravascular, and at the concentrations used in clinical scenario, the backscatter acoustic intensity of microbubbles is linearly correlates with the concentration [12, 13] and therefore reflects local vessel density. Furthermore, ultrasound contrast agent is nonnephrotoxic and with no long-term risk. The imaging process is nonradioactive, and the perfusion can be observed dynamically. The characterization of the lesions is usually made by radiologists by reviewing the exam clip, which is highly dependent on the experience they possessed in the field. Quantification software provides a more objective way to compare the hemodynamics between different lesions. SGCQ software have similar function as commercially available softwares like Sonoliver® and Vuebox®. For the study of focal liver lesions, respiratory motion affects the fitting of time-intensity curve, methods like respiratory gating, rejection of out-of-plane frames [14, 15] are used in some software to minimize the effect, requesting preprocessing of the data and risking possible loss of information. SGCQ software applied respiratory calibration ROI method to track the motion of ROI, allowing the analysis of integrate data, due to the algorithm of the S-G filter, the software requests relatively small program with no requirement of advanced random access memory and data processing capability of the hardware [1, 2]. The interface of the software presents both TIC curve and the parameters, including GOF (Fig. 1a), analysis could be performed multiple times of the same lesion to get a satisfying GOF. In data smoothing, the width, relative maximum and minimum of the data remain unchanged, theoretically leads to a better fitting of the curve and more precise parameters.
In the consistency analysis part, ICCs of all parameters from the tumor were greater than 0.8, indicating high retest reliability among 3 tests, ICCs of all parameters from liver areas were greater than 0.8 except for a3 and TTP. The tumor ROI was defined in arterial phase when the hypervascular pattern of the majority of the nodules [16] was obvious and the edge of the tumor was sharp, however, the ROIs of the tumor among three tests were more likely to be positioned identically among 3 researchers.
The quantification of 50 HCC tumors and adjacent liver areas showed that wash-in slope a3 and wash-out slope a2 were greater in the tumor than in the adjacent liver, suggesting that the contrast agents flowed into and out of HCC tumor faster than liver parenchyma, T0, TTP, PT of the tumor were less than that of liver parenchyma,the intensity parameters a1, PI and EI had no significant difference between the two ROIs, AUC of the tumor were less than of liver parenchyma, suggesting the total amount of contrast agents perfused into the tumor was smaller than into liver parenchyma, possibly due to the lack of portal blood supply. MTT had no significant difference between the ROIs. Diagnostic performance of the significantly different parameters a2, a3, T0 and TTP all showed an area under the receiver operating characteristic curve(AUROC) greater than 0.7, indicating intermediate diagnostic efficacy.
The quantification of 44 MLT tumors and adjacent liver areas showed that similar to HCC, a3 and a2 were greater in the tumor than in the adjacent liver, and T0, TTP, PT, AUC of the tumor were less than that of liver parenchyma and MTT had no significant difference between the ROIs. Unlike HCC, a1, PI and EI of the tumor were less than of liver parenchyma, suggesting a relatively sparse vessel density of MLT. AUROC of a2, a3, T0, TTP and AUC was greater than 0.7, indicating intermediate diagnostic efficacy.
The comparison between the two lesions showed that a3 and a2 of HCC tumor were less than of MLT tumors. AUC of HCC tumors were less than that of MLT tumors, suggesting that HCC tumors had better blood supply than MLT nudules. AUROC of AUC was greater than 0.7, indicating intermediate diagnostic efficacy. EI and PT had no significant difference between the lesions.
The processed parameters da1, dPI, and dMTT had significant difference between two lesions, dMTT of HCC was less than of MLT, da1 and dPI of HCC were greater than of MLT, AUROC of da1 and dPI were greater than 0.7.
The data simplification method was reliable in the comparison of tumors and adjacent liver areas, but in the comparison between two lesions, enhanced intensity had no significant difference while da1 and dPI were significantly different and had intermediate differential value between the lesions, suggesting that in terms of acoustic intensity parameters, the difference standardized method was more useful in the comparison between two lesions.
Among the SCGQ parameters, AUC correlated best with MVD and the correlation coefficient r = 0.72, suggesting the total amount of perfusion correlated well with the vessel density of tumor, and AUC may serve as a possible biomarker of tumor neovascularization. Wash-out slope a2 was negatively correlated with MVD (r = –0.49, P = 0.0019), the correlation was possibly due to the tortuous shape and dysfunction of tumor neovascularization, the contrast agents were detained in the microcirculation of the tumor, causing a flatter wash-out slope, the result were not proved in similar research [17], possibly relates to the dosage of contrast agent. EI was positively correlated with MVD (r = 0.66, P = 0.0000), tumors with higher MVD contains more vessel lumen in each voxel and at the time of peak intensity the voxel would contain more contrast agents, and EI may serve as a possible biomarker of tumor neovascularization, too.
Despite that a2, EI, AUC were significantly correlated with MVD, all correlation coefficients were less than 0.8, this was possibly due to the MVD count include staining units like endothelial cell or endothelial cluster, these units are not functional vessels, the perfusion and clearance of contrast agents depend on functional vessels. A study showed that MVD was not linearly correlated with the blood supply of HCC, many factors could contribute to the degree of angiographic tumor enhancement, but generally, the hypervascular type defined by angiography have greater MVD counts than the isovascular type and hypovascular type [18]. Based on the discussion above, we believed that the parameters are relevant with MVD.
Angiogenesis is a key step in tumor growth and is highly relevant with prognosis, antiangiogenetic agents like Sorafenib were often used in unresectable HCC cases [19]. MVD is a widely used marker to evaluate tumor angiogenesis and estimate prognosis [20]. In noninvasive evaluation of antiangiogenic therapy, there was no widely accept imaging biomarkers, the mechanisms of the agents are not inconsistent with response evaluation criteria of solid tumors (RECIST) [21, 22]. Zhuang et al reported that the preoperative quantification parameters, TTP, PI, AUC and wash-out time were associated with the 1-,3- and 5-years disease free survival rate [23]. Frampas et al reported that after Sorafenib treatment, a decrease in AUC of more than 40% at month 1 predicted no-progression at month 2 [24]. Studies on in vivo models also proved antiangiogenetic effect could be evaluated by quantitative CEUS [25–29]. CEUS is an ideal imaging modality for follow-ups of advanced stage HCC patients receiving both systemic therapy and locoregional therapy [30, 31], quantification parameters are obtained after simple off-line analysis, with some parameters correlate with tumor neovascularization, we expect SGCQ software to have a role in noninvasive response evaluation of antiangiogenetic therapy in HCC.
One limitation of our research is that lesions smaller than 15 mm are excluded to minimize the influence of the paratumor parenchyma perfusion to that of the tumor, another limitation is that considered the actual clinical scenario, we included tumors of depth range between 3 cm to 8 cm and inevitably included some TIC of less goodness of fitting.
In conclusion, SGCQ software shows good inter-observer consistency, wash-in slope a3 and wash-out slope a2, perfusion time are the parameters of the most diagnostic value for both HCC and MLT, AUC is useful in the analysis of MLT as well. In the comparison between HCC and MLT, AUC, da1 and dPI are of the most differential diagnostic value. Parameter a2, enhanced intensity EI and AUC correlates with tumor MVD counts, among them AUC has the maximum correlation coefficient and possibly reflects tumor angiogenesis.
Footnotes
Acknowledgments
The paper is supported by the National Natural Science Foundation of China (Grant No. 81571675 and 81873897).