
Abstract
OBJECTIVE:
The use of a standardized dynamic contrast enhanced ultrasound (CEUS) protocol to determine perfusion of hepatocellular carcinomas (HCC) using quantitative analysis.
METHODS:
Retrospective analysis of 27 patients with hepatocellular carcinoma examined by a standardized protocol (bolus injection of 2.4 ml sulphur hexafluoride microbubbles, arterial phase to portal venous phase using continuous CINE-loops over 1 minute, short CINE-loops after 2, 3, 4, 5 and 6 minutes and additional single images for B-mode, CCDS). The examination was performed by an experienced sonographer with a high resolution, multi-frequency transducer (1–6 MHz). The reading of the reference imaging (contrast enhanced CT and MRI) and histopathology, if necessary, was performed independently. Retrospective analysis of the CEUS DICOM loops was done using time intensity curve analysis (TIC) with evaluation of the time to peak (TTP) and the area under the curve (AUC).
RESULTS:
All tumor lesions were characterized by CEUS, based on typical contrast patterns for HCC lesions with arterial enhancement and wash out in the late phase, corresponding to MRI with liver specific contrast agent or contrast enhanced CT. Mean TTP (SD) in the tumor centre (C) was 19.93 (11.31), in the periphery (P) 22.94 (9.44) and in the normal liver tissue (LT) 28.19 (11.34) with significant differences between all zones C/P (p = 0.013), C/LT (p = 0.005) and P/LT (p = 0.022). AUC mean (SD) in the tumor centre (C) was 660.03 (292.64), in the periphery (P) 586.04 (237.01) and in the normal liver tissue (LT) 484.20 (236.99), also with significant differences between all zones C/P (p = 0.001), C/LT (p < 0.001) and P/LT (p < 0.001).
CONCLUSION:
TIC-analysis is an easy-to-use tool for the dynamic evaluation of microvascularization in hepatocellular carcinoma and allows a fast and cost-efficient quantitative analysis.
Abbreviations
hepatocellular carcinoma
magnetic resonance imaging
computed tomography
contrast enhanced ultrasound
time intensity curve
time to peak
area under the curve
seconds
Introduction
As a result of numerous multi-centre evaluations, CEUS has meanwhile acquired a high diagnostic significance in the imaging assessment of hepatocellular carcinoma (HCC) [1–7]. The EFSUMB guidelines [8] and the LI-RADS classification [9–12] define the main criteria for HCC as arterial hypervascularization, a wash-out in the late phase and the predominant development of tumors in cirrhotic liver tissue. The greatest challenge for ultrasound and CEUS is the use of standardized and objective protocols. Only standardization with diagnostic image storage in PACS can strengthen the significance of CEUS in multimodal tumor imaging compared to CT and MRI [13].
Protocols with multi-center evaluation are specified by DEGUM, for instance [14]. The aim is to use modern CEUS technology with contrast harmonic imaging at low energy (low-MI < 0.2), usually using sulphur hexafluoride microbubbles (SonoVue®/Bracco, Italy) to map the dynamic microvascularization of HCC lesions down to capillary level. Continuous CINE loops following bolus injection after 10–15 s extend into the portal venous phase and should accurately document tumor localization and vascularization. Shorter CINE loops can detect a wash-out, beginning at the portal venous phase (>1 min) up to late phase of 6 min.. The contrast enhanced CT and MRI cross-sectional imaging methods are complex to quantify via TIC analysis, since special examination techniques are required with serial imaging for each lesion.
The aim of the present study was to investigate the arterial and portal venous phase of HCC-typical lesions, to evaluate standard protocols and to define tumor characteristics with a device-integrated software using “time to peak” and “area under the curve”.
Materials and methods
Study design and participant selection
A total of 27 patients with HCC were retrospectively included in the study, who had CEUS between November 2018 and June 2019. Inclusion requirement was a contrast-enhanced CT or MRI or a histopathology as gold standard. Exclusion criteria were the patient’s refusal to participate in the study as well as acute heart- or lung-failure as contraindications for ultrasound contrast agent. The examination was performed by an ultrasound experienced radiologist (more than 3000 examinations over more than 20 years) with a high resolution multifrequency transducer (1–6 MHz). We ensured independent reading of the reference imaging (CT and MRI, Fig. 1 and 2) and histopathology, if necessary. Retrospective analysis was performed using time intensity curve analysis (TIC) by the integrated software of the high-end ultrasound machine.
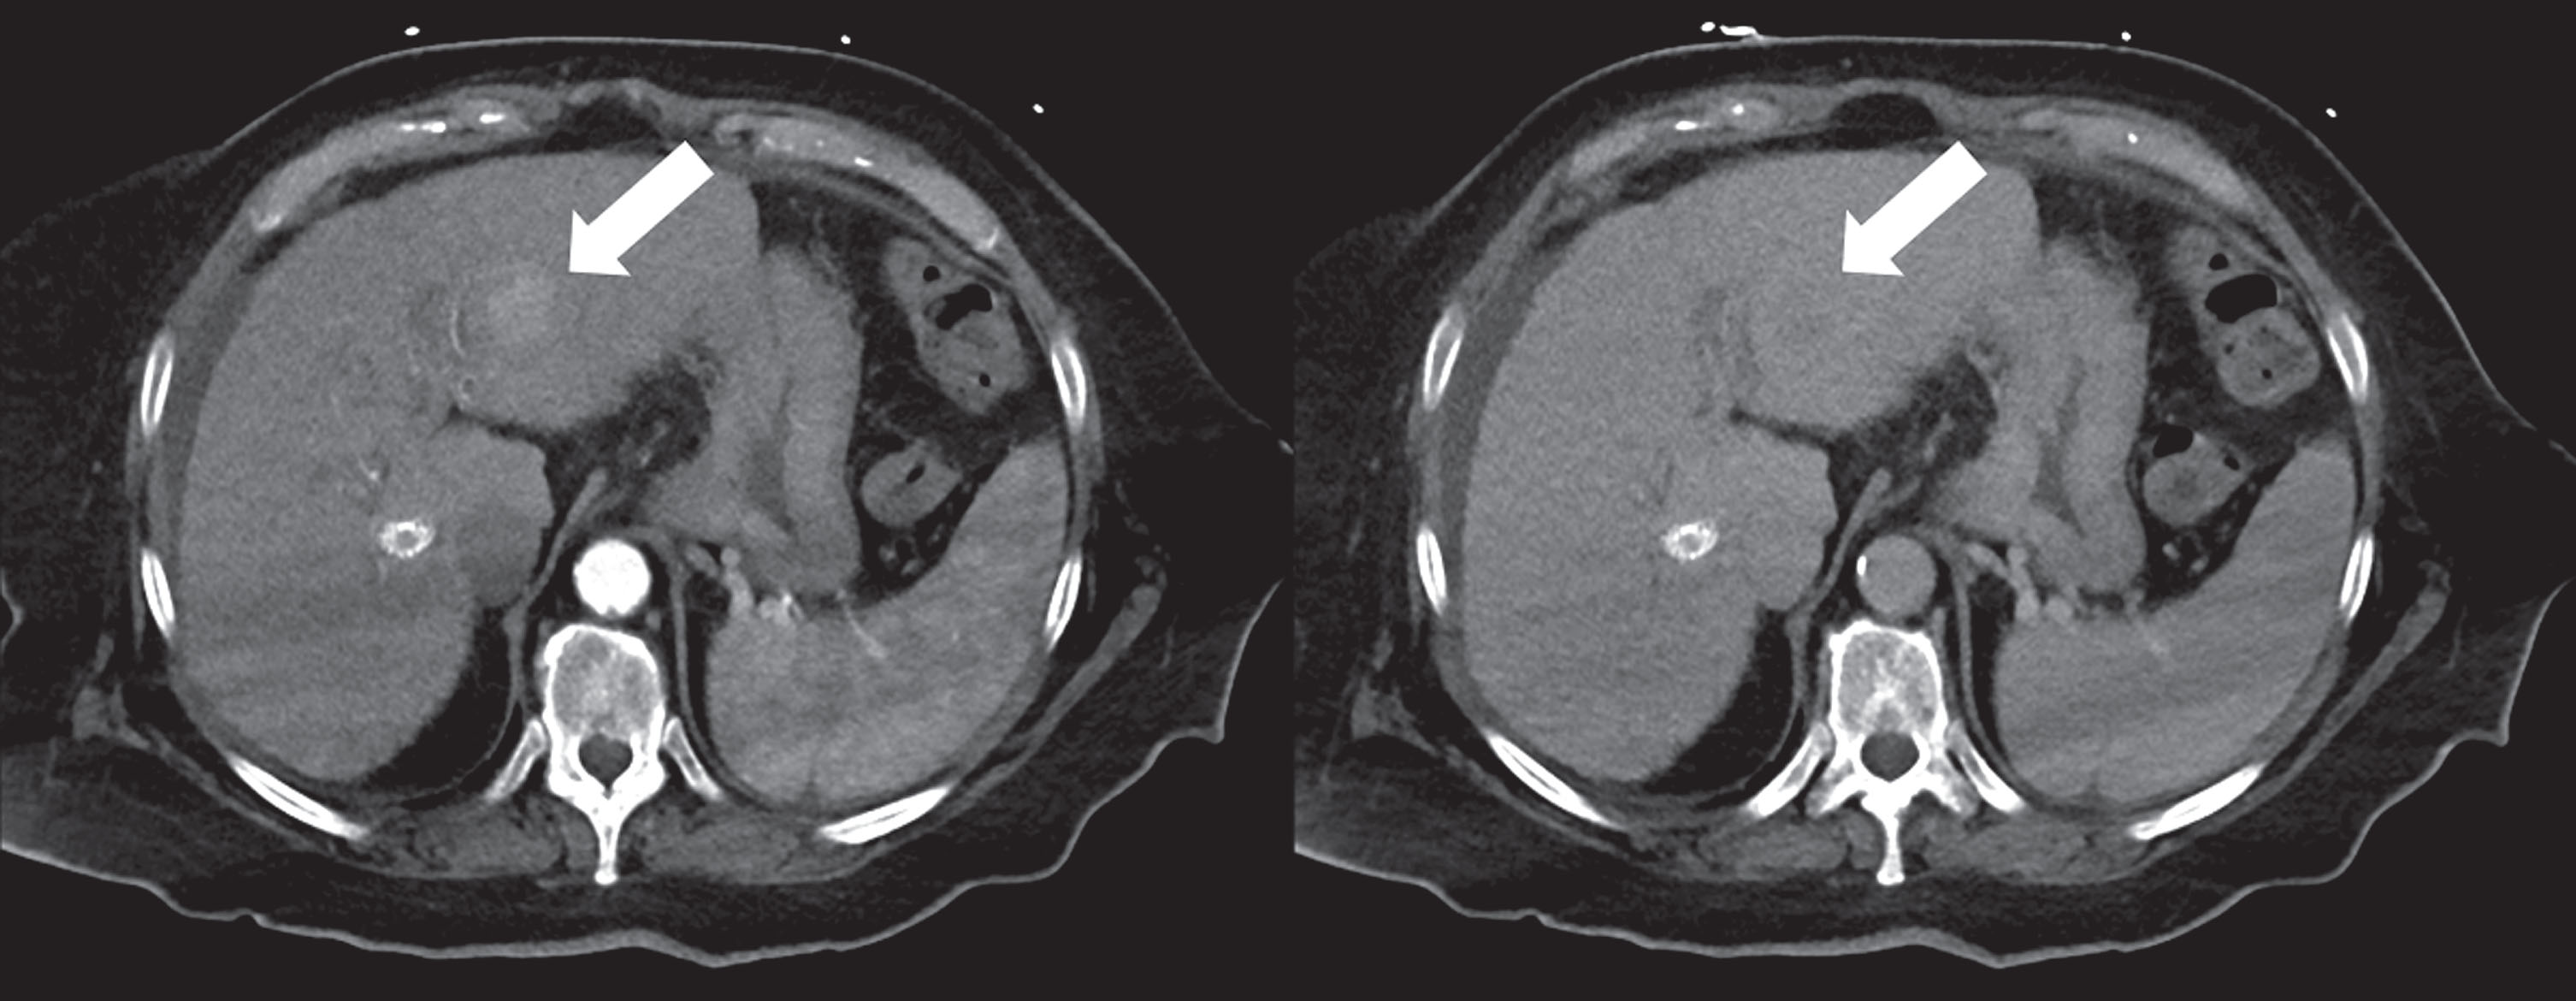
Contrast enhanced CT shows a 3 cm HCC at the segment border II/III/IV, arterially hypervascularized with portalvenous wash-out (white arrow).
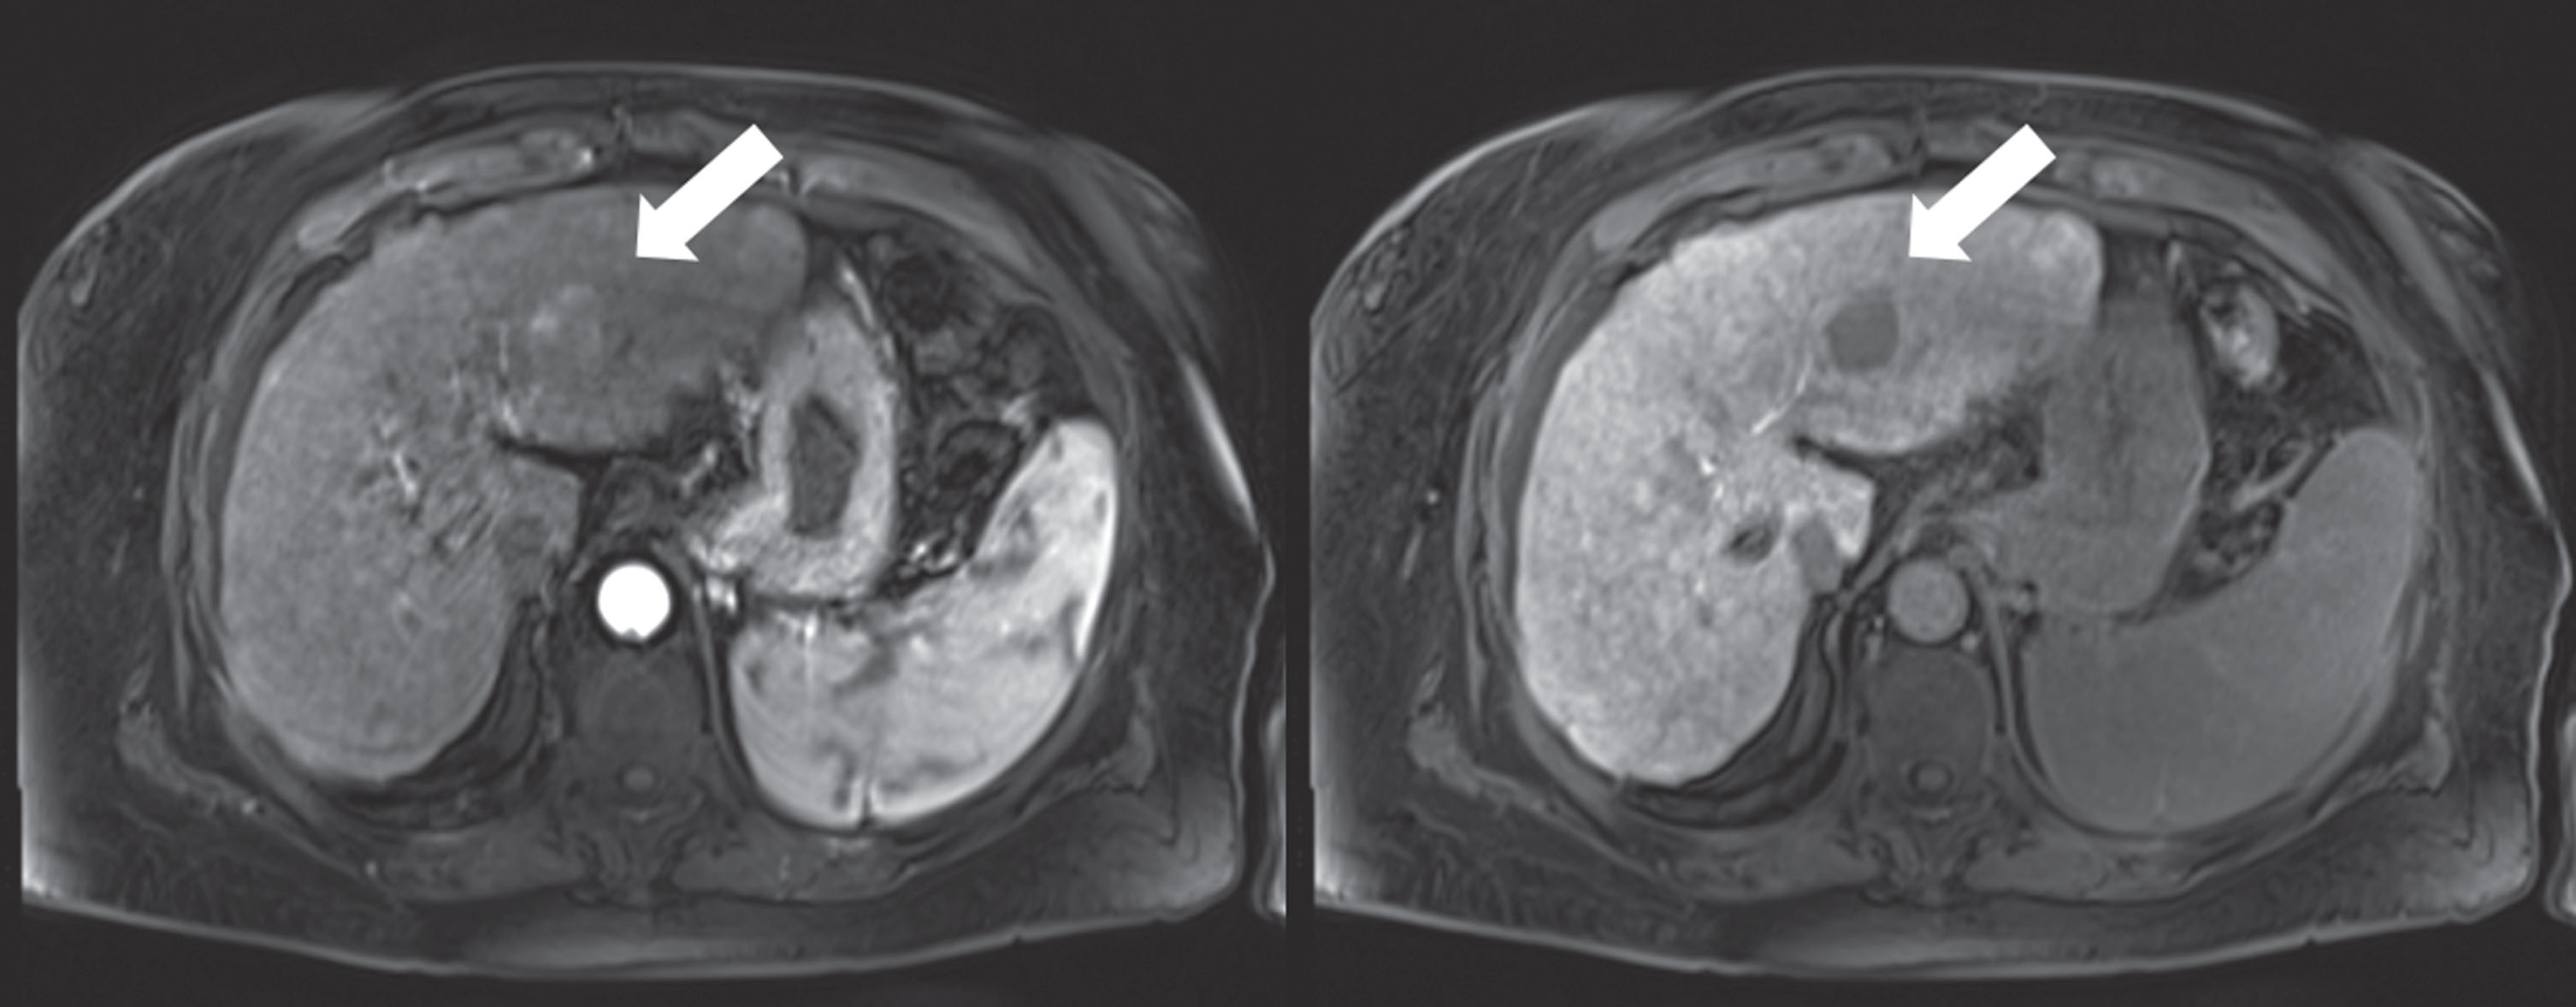
Dynamic MRI confirms the findings of an HCC with arterial hypervascularization and wash-out in the hepatobiliary late phase (white arrow).
The retrospective independent analysis of the CEUS and the perfusion analysis were approved by the local ethics committee. Patients gave consent to use their imaging and clinical data for research purposes before the examination.
The examinations were performed according to the EFSUMB guidelines [8] and the DEGUM multicenter study [3, 14]. CEUS was performed with a high-end ultrasound machine (LOGIQ E9, GE, Chalfont, UK) by an experienced examiner using a 1–6 MHz curved probe. First, the whole liver was scanned in B-mode and the lesion was identified (Fig. 3). CCDS and power doppler were then performed. Afterwards, a bolus of 1–2.4ml contrast media was applied followed by a bolus of NaCl.
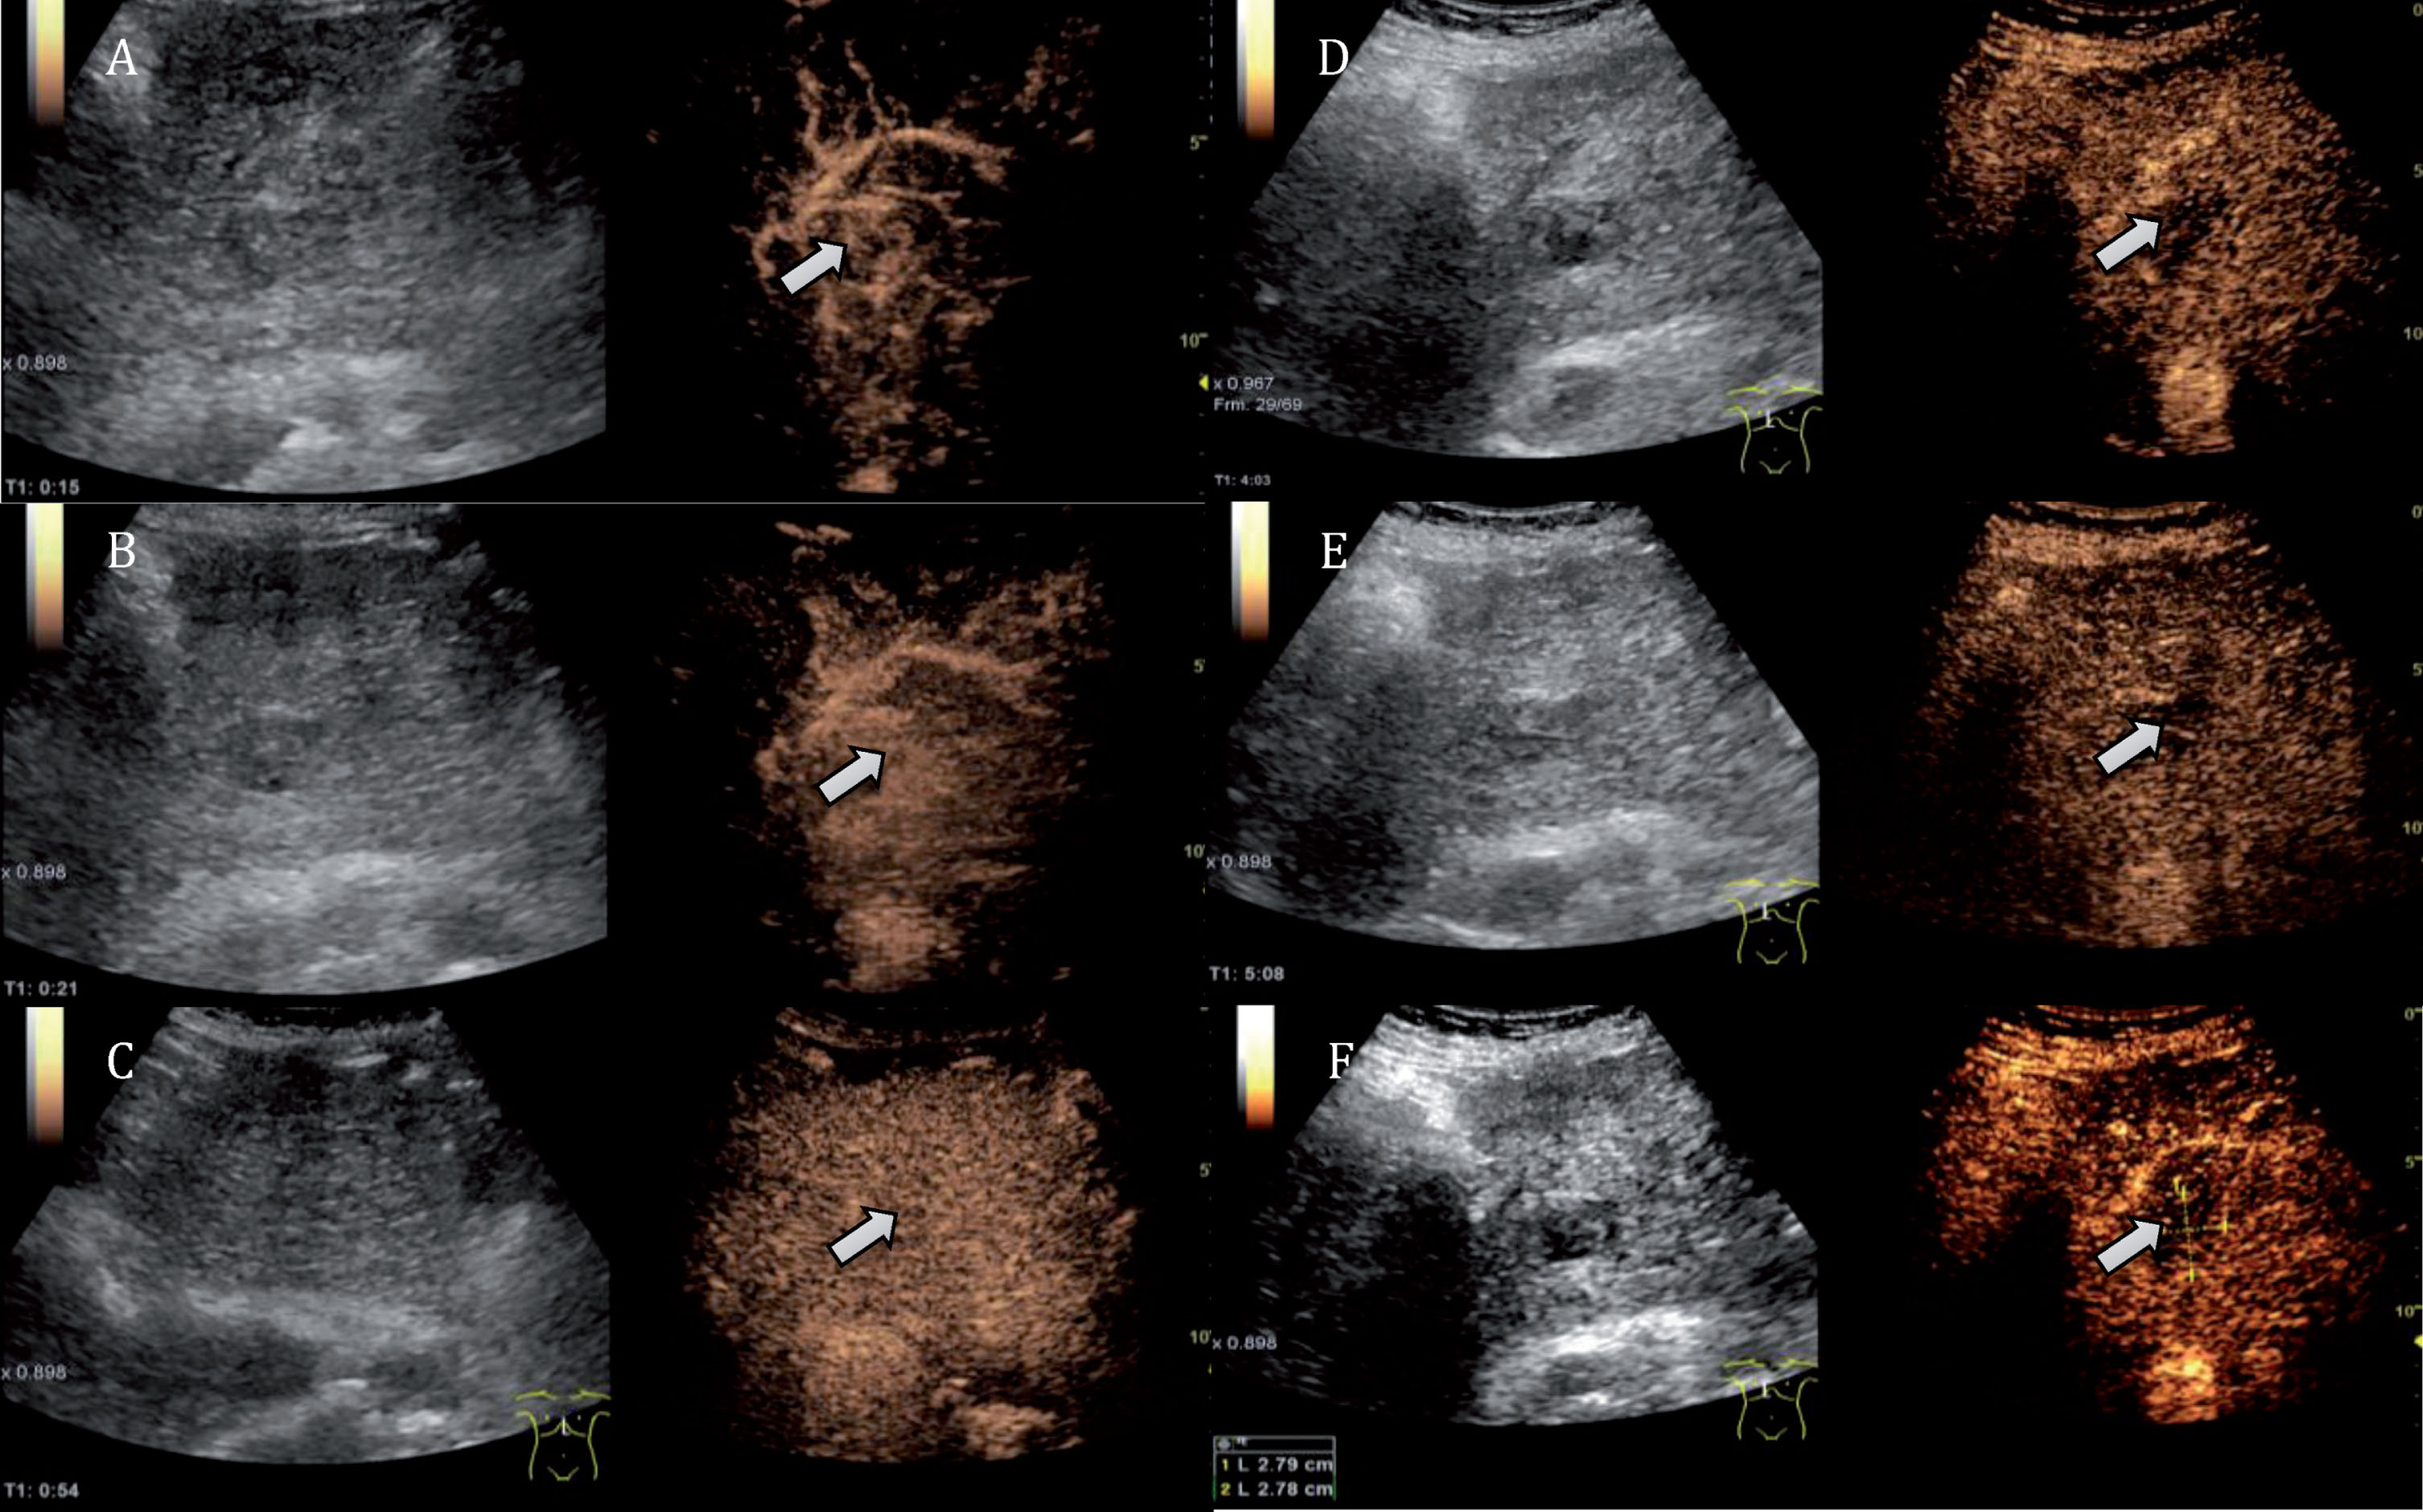
The HCC (white arrows) must be set artifact-free for 6 minutes for the CEUS examination. Only then, a quantitative evaluation is possible. The continuous imaging shows the contrast agent behavior of the tumor: In the arterial phase (A, B) the tumor shows a strong contrast agent uptake. In the portal venous phase, the tumor is only weakly distinguishable (C). In the late phases, the tumor clearly appears after more than 4 minutes (D) and more than 5 minutes (E) with a strong wash-out. The final image after 6 minutes (F) shows a tumor size of 2.8 cm.
SonoVue® (Bracco, Milan, Italy) was used in all examinations. SonoVue® is a second-generation contrast agent. The sulfur hexafluoride microbubbles have a phospholipid coating, which makes them soluble in blood. They have an average diameter of 2–10μm and thus pass easily through the capillary bed. The boundary surface between sulfur hexafluoride gas and blood reflects the ultrasound waves, resulting in an increase in the contrast between tissue and blood. Ultrasound contrast agent (SonoVue®) is a purely intravascular contrast agent unlike liver-specific MRI contrast agent that diffuses through membranes and is therefore considered an intracellular contrast agent.
HCC were characterized by the following criteria: The hyper-enhancement of a lesion in relation to the surrounding liver in the arterial phase (10–35 s after injection), the wash-out in the portal venous phase (starting 45–60 s after injection) and the late phase (>120 s up to 5 min. after injection).
Digital DICOM loops of the HCC were stored in the PACS with short sequences of 5–10 s after 2, 3, 4, 5 and 6 minutes. The TIC-analysis of the HCC tumor reference lesion with ROI (region of interest) of 5–10 mm size was then performed by an independent reader. In each case 8 ROI were defined: 2 centrally in the tumor, 4 at 3, 6, 9 and 12 o’clock in the peripheral region of the tumor and two in the non-vascular part of the liver (Fig. 4).
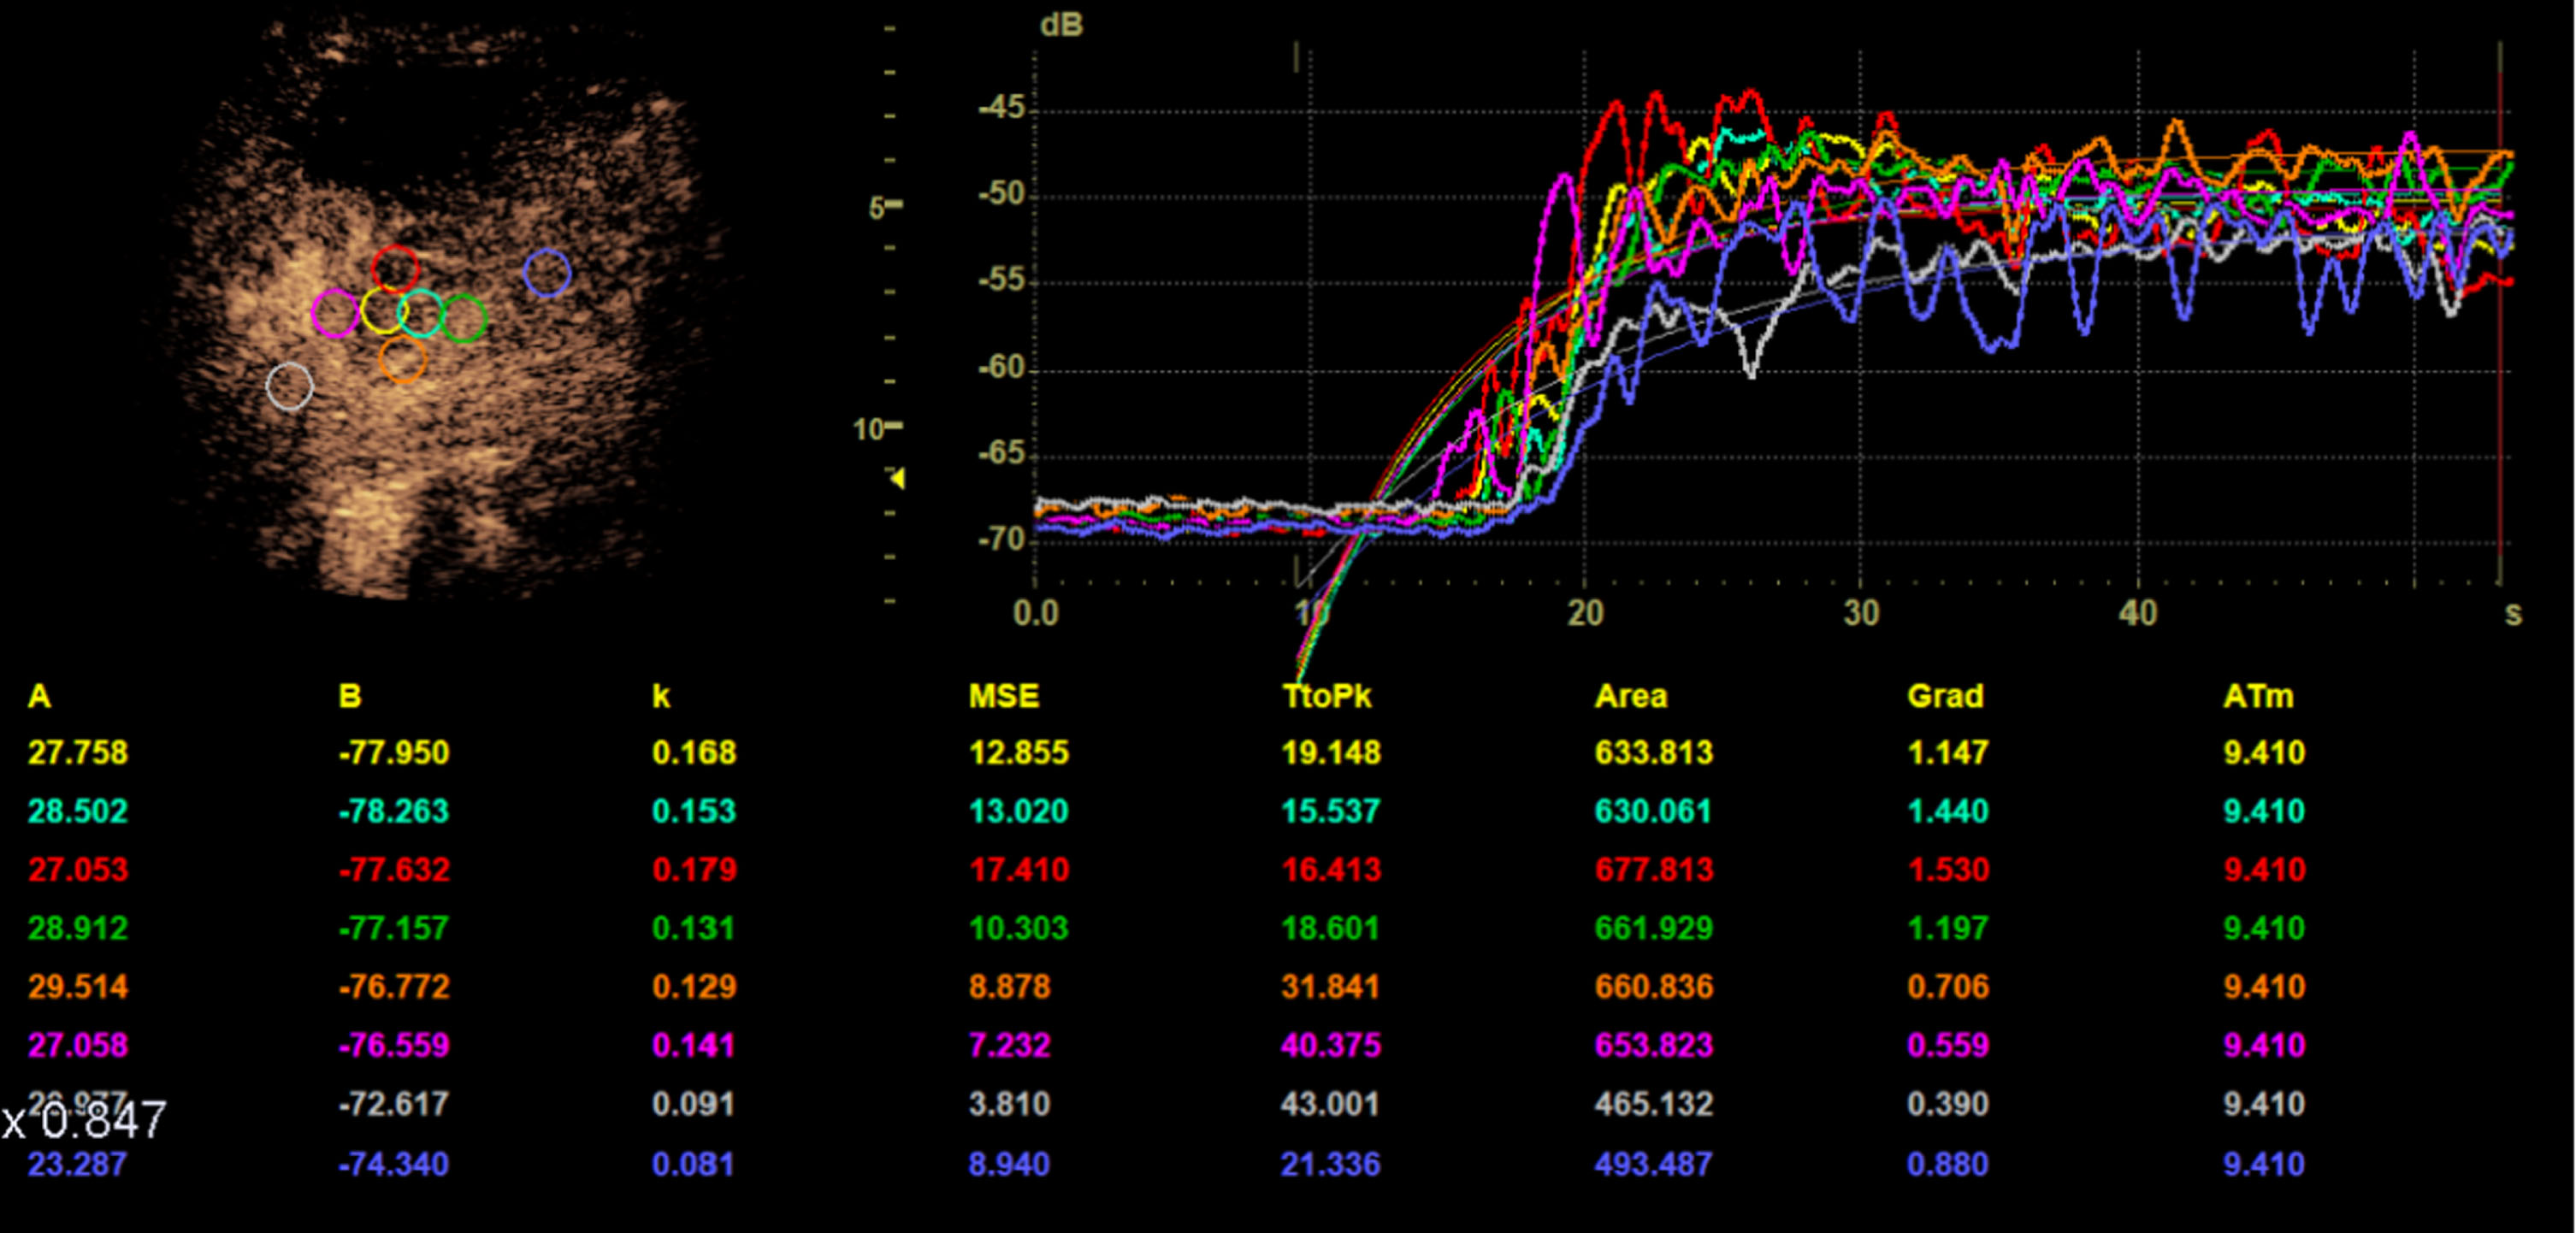
The time intensity curve analysis (TIC) of the HCC tumor reference lesion with ROI (region of interest) of 5–10 mm size was performed by an independent reader. In each case 8 ROI were defined: 2 centrally in the tumor (yellow, cyan), 4 at 3 (green), 6 (orange), 9 (pink) and 12 (red) o’clock in the peripheral region of the tumor and two in the healthy liver tissue (grey, blue).
The independent evaluation of TTP and AUC, as measures of the flow volume, were performed independently with relative units of measurement (rU), as this was manual bolus kinetic. The aim of the evaluation was the dynamic characterization of the wash-in-kinetics in the tumor center and in the peripheral region, in comparison to the surrounding liver and the evaluation of the wash-out in the early portalvenous phase or prolonged in the late phase.
All MRI examinations were performed on a 3.0 T MRI unit (Siemens Skyra, Siemens AG Healthcare, Erlangen, Germany) (Fig. 2). The pre-contrast protocol consisted of the following sequences: axial T2-weighted HASTE, T2-weighted BLADE, Diffusion/ADC, T1-weighted FLASH in- and opposed-phase and T1-weighted VIBE 3 D. Dynamic axial T1-weighted VIBE scans were obtained 20, 40 and 120 s after the injection of contrast agent. The hepatobiliary phase sequences were acquired 20 minutes after injection of contrast agent (axial T1-weighted VIBE).
Arterial, portal venous and late phase helical CT scans with a slice thickness of 1 mm were acquired (SOMATOM Definition® Egde or SOMATOM Definition® Flash, Siemens Healthcare, Forchheim, Germany) (Fig. 1). The intravenous injection of 120 ml of contrast agent (Accupaque 350, GE Healthcare Buchler, Braunschweig, Germany) was performed with a flow rate of 4 ml/s followed by an injection of 40 ml of NaCl. Acquisition in the arterial phase was performed via bolus tracking (CARE Bolus, Siemens Healthcare, Forchheim, Germany) in the aorta with a threshold of 100 HU and a delay of 17 seconds.
Using SOMATOM Definition® Flash, all CT scans were acquired in dual-energy mode with tube voltages of 80 kV and 140 kV. To reduce the radiation dose, the manufacturer’s own automatic tube current modulation (CareDOSE 4D, Siemens Medical Solutions, Forchheim, Germany) was activated.
Results
Patient and tumor characteristics
The average age of the patients was 65 years with a range of 43–81 years. 24 patients were male (89%), 3 female (11%). 25 (93%) of the patients suffered from liver cirrhosis. The tumor entities were HCC in all cases n = 27 (100%). The patient and tumor characteristics are shown in Table 1.
Patient and tumor characteristics
Patient and tumor characteristics
In the TIC analysis, TTP was shortest in the tumor center with 19.9 (SD 11.3) s. TTP was longest in the healthy liver tissue with 28.2 (SD 11.3) s. TTP of the peripheral zone was 22.9 (SD 9.4) s. In the AUC analysis, the highest values were measured in the central zone with 660.03 (SD 292.64) rU, followed by the peripheral zone with 586.04 (SD 237.01) rU and lastly the healthy liver tissue with 484.21 (SD 236.99) rU.
A significant difference of TTP was found between all three areas, the center and periphery C/P, the center and the normal liver tissue C/LT and the periphery and the normal liver tissue P/LT with p = 0.013, p < 0.001and p = 0.022, respectively, as shown in Table 2 and Fig. 5.
Mean and standard deviations (SD) of TIC analysis. TTP was measured in seconds (s) and AUC in relative units (rU). C = center, P = periphery, LT = surrounding liver tissue
Mean and standard deviations (SD) of TIC analysis. TTP was measured in seconds (s) and AUC in relative units (rU). C = center, P = periphery, LT = surrounding liver tissue
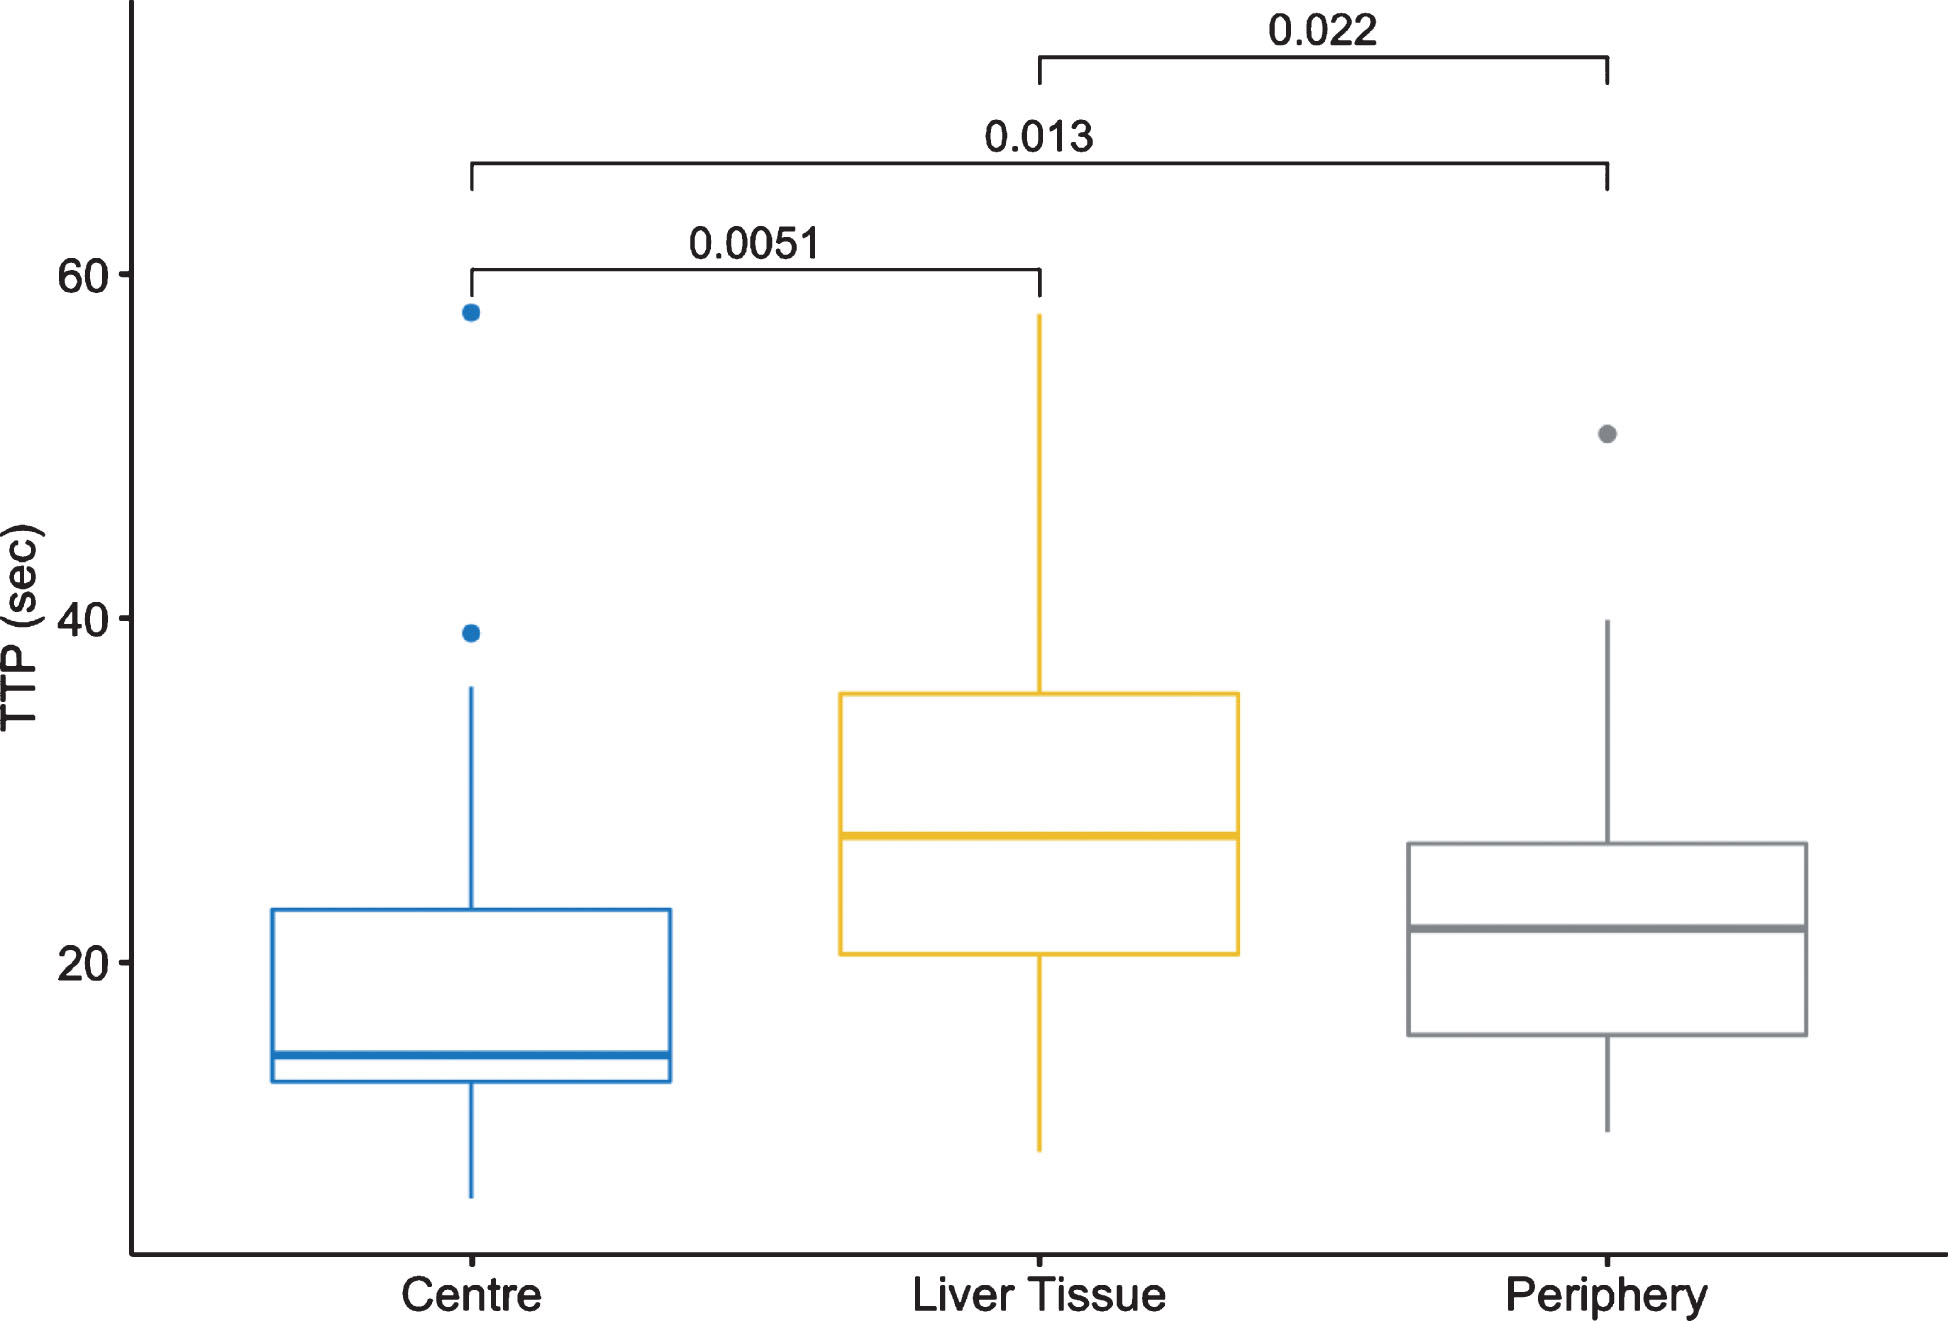
Boxplots of the time to peak (TTP; measured in seconds) for central tumor zone, peripheral tumor zone and healthy liver tissue.
A significant difference of AUC was also found between all three areas C/P, C/LT and P/LT with p = 0.001, p = 4e-06 and p = 5.4e-05, respectively, as shown in Table 2 and Fig. 6.
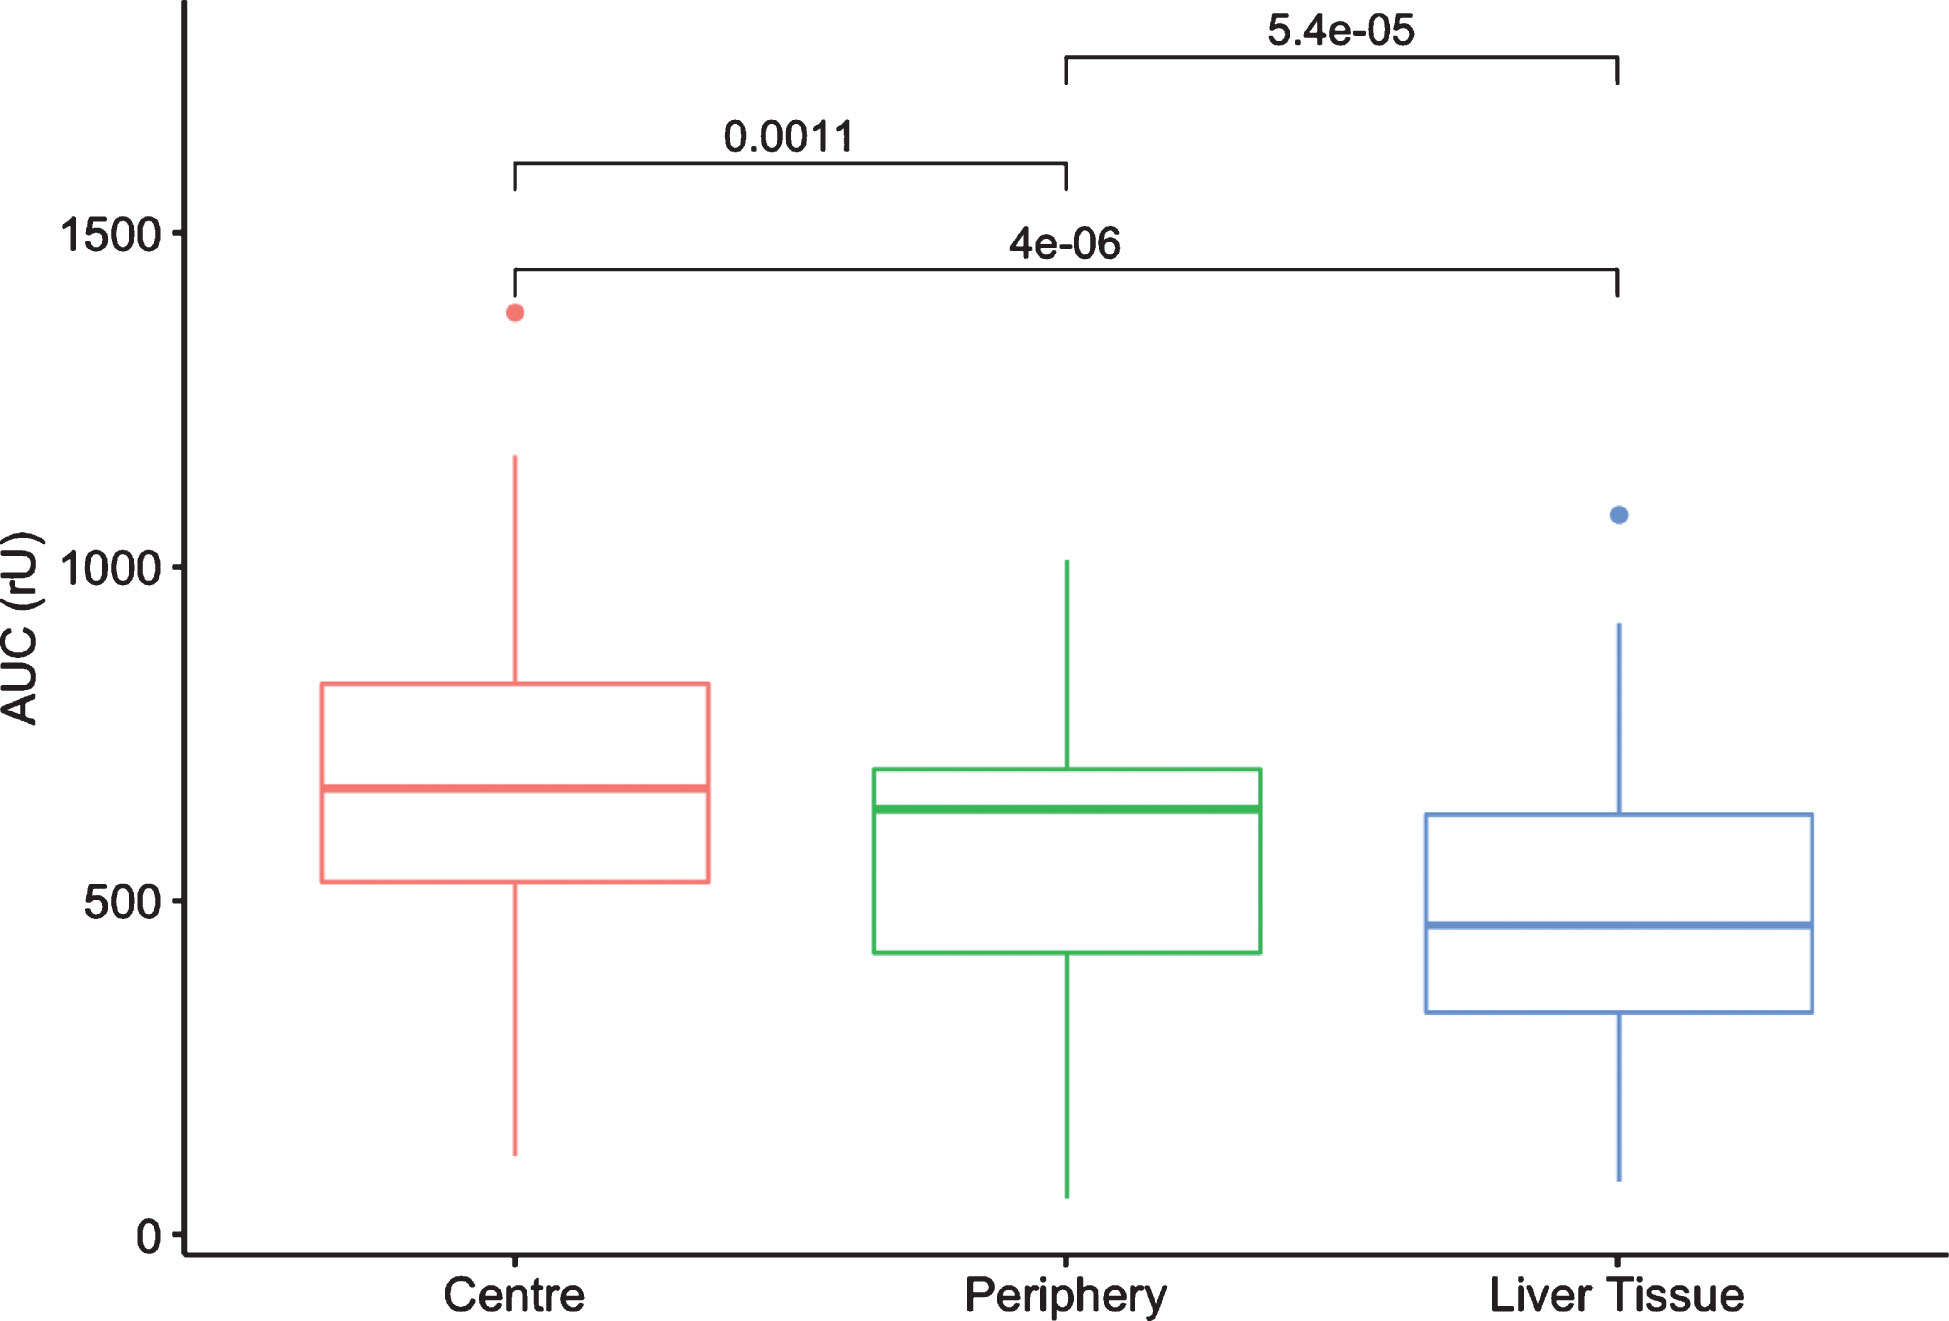
Boxplots of the area under the curve (AUC; measured in rU) for central tumor zone, peripheral tumor zone and healthy liver tissue.
The purpose of this study was to evaluate a time optimized quantification of a CEUS perfusion of HCC-typical liver lesions using TIC analysis. We were able to show that the TIC analysis allows an objective and fast quantitative evaluation of HCC. The tumor center, (hyper)vascularized peripheral area and healthy liver tissue can be quantitatively distinguished from each other. If the examination is carried out in an artifact-free way and a cine-loop of the reference lesion is stored for one minute without any significant movement artifacts, this data set can be analyzed retrospectively and independently, using a device-internal software.
Certainly a quantitative evaluation of HCC is also possible with cross-sectional imaging [15, 16] but from our point of view, quantitative analysis with CEUS has many advantages in terms of time expenditure, costs and risk profile.
After a training phase, the time required for the TIC analysis in three regions (center, tumor margin, liver periphery) is a maximum total of 6 minutes. This is well below the time window for quantitative analysis using contrast MRI or CT. While external software evaluations are time-consuming, the export of DICOM data alone results in measuring times up to one hour, whereas the integrated device-internal TIC analysis can be used much more effectively.
Moreover, both MRI and CT, have the additional disadvantage of needing to apply a significant amount of contrast agent with associated risks of deterioration of kidney and thyroid function. When using SonoVue® and contrast harmonic imaging techniques with a low mechanical index (MI < 0.2), even repetitive ultrasound contrast agent applications are possible without any risks of damaging the kidneys or the thyroid gland. In our study, however, repetitive applications were not necessary in any of the cases. The cost factor for 1.5 –2.4 ml of the contrast agent is around 40–60 €, which is well below the contrast agents for CT and MRI.
In addition to the advantages in feasibility, quantitative evaluation with CEUS also offers numerous diagnostic benefits: Quantification enables to create a detailed dynamic assessment of tumor microvascularization, which was also shown in many other studies [1, 5]. Especially on HCC, the differentiation between low vascularization and very strong and irregular hypervascularization is very broad.
Thus, this technique also opens up the possibility for intervention planning, in particular through the quantification of capillary tumor growth in the margin area.
Some studies have already demonstrated the importance of CEUS for targeted interventions on HCC [13, 17–19]. Another advantage of the CEUS examination is the direct intraoperative use for localization and therapy of HCC [20]. In addition, we have now been able to show, that an objective, quantitative evaluation is also possible, which offers an additional application option. Through objectivity and quantification, the data could also be used for deep learning in the future, which could certainly open up completely new possibilities in diagnostic and therapeutic settings. Machine-learning using CEUS is currently subject in research [21]. Quantitative analysis, however, is a new aspect that, to our knowledge, has not yet been researched.
There are some limitations of this dynamic CEUS evaluation. Only in some cases histopathology was available (n = 5) as gold standard. Contrast enhanced MRI or CT showed typical contrast enhancement patterns though. Having two modalities with typical enhancement patterns, diagnosing an HCC is possible and histopathology not mandatory. Further limitations are the monocentric and retrospective study design and the small number of cases with 27 patients.
Nevertheless, we are convinced that our results are reliable and relevant due to the uniform approach and the high level of investigative expertise. In detail, our results showed significant quantitative differences for both TTP and AUC for the central tumor zone, peripheral tumor zone and the healthy liver tissue. This allows not only the differentiation of tumor areas from healthy tissue, but also the objective differentiation of the central areas and the critical peripheral zone within the tumor, which is extremely helpful both in the initial diagnosis and in the follow-up after therapy. This is only a pilot study with a small number of patients, but it seems to be a promising option for multimodal HCC-CEUS monitoring. In the future, multicenter studies could further advance the evaluation of this technology.