
Abstract
OBJECTIVE:
To explore the value of dynamic contrast enhanced ultrasound (DCE-US) in preoperative differential diagnosis of focal-type autoimmune pancreatitis (AIP) and pancreatic ductal adenocarcinoma (PDAC).
PATIENTS AND METHODS:
From May 2016 to March 2020, patients with biopsy and histopathologically confirmed focal-type AIP (n = 9) were retrospectively included. All patients received contrast enhanced ultrasound (CEUS) examinations one week before surgery/biopsy. Dynamic analysis was performed by VueBox® software (Bracco, Italy). Eighteen cases of resection and histopathologically proved PDAC lesions were also included as control group. B mode ultrasound (BMUS) features, CEUS enhancement patterns, time intensity curves (TICs) and CEUS quantitative parameters were obtained and compared between AIP and PDAC lesions.
RESULTS:
After injection of ultrasound contrast agents, most focal-type AIP lesions displayed hyper-enhancement (2/9, 22.2%) or iso-enhancement (6/9, 66.7%) during arterial phase of CEUS, while most of PDAC lesions showed hypo-enhancement (88.9%) (P < 0.01). During late phase, most of AIP lesions showed iso-enhancement (8/9, 88.9%), while most of PDAC lesions showed hypo-enhancement (94.4%) (P < 0.001). Compared with PDAC lesions, TICs of AIP lesions showed delayed and higher enhancement. Among all CEUS perfusion parameters, ratio of PE (peak enhancement), WiAUC (wash-in area under the curve), WiR (wash-in rate), WiPI (wash-in perfusion index, WiPI = WiAUC/ rise time), WoAUC (wash-out area under the curve), WiWoAUC (wash-in and wash-out area under the curve) and WoR (wash-out rate) between pancreatic lesion and surrounding normal pancreatic tissue were significantly higher in AIP lesions than PDAC lesions (P < 0.05).
CONCLUSION:
DCE-US with quantitative analysis has the potential to make preoperative differential diagnosis between focal-type AIP and PDAC non-invasively.
Keywords
Introduction
Autoimmune pancreatitis (AIP) is a rare type of chronic pancreatitis caused by autoimmune abnormalities with no exact pathogenesis [1]. AIP accounts for 5–6% of patients with chronic pancreatitis, while the exact incidence rate is still unknown [2]. AIP could be divided into two subtypes according to the imaging characteristics: the diffuse type and focal-type AIP [3, 4]. Focal-type AIP is less common and often locates in the head or neck of pancreas. Clinically, it might be great challenge to differentiate focal-type AIP lesions from pancreatic ductal adenocarcinomas (PDACs), since they show similar clinical symptoms, such as upper abdomen pain and jaundice [5]. However, the therapy and prognosis of AIP differ greatly from PDAC. AIP mainly relies on long-term corticosteroids therapy [1], and PDAC lesions may require surgery resection and postoperative adjuvant treatment [6]. It’s reported that approximately 3%–9% of patients with focal-type AIP undergone resection for suspected PDAC [7]. Therefore, preoperative accurate and non-invasive diagnosis of focal-type AIP and PDAC is very important.
Currently, medical imaging modalities including transabdominal B mode ultrasound (BMUS), computed tomography (CT), magnetic resonance imaging (MRI), positron emission tomography-CT (PET-CT), magnetic resonance cholangiopancreatography (MRCP) and contrast-enhanced ultrasound (CEUS) are used for localization and characterization of pancreatic lesions before surgery [8–15]. On BMUS scan, focal-type AIP lesions shows like a hypoechoic mass with no specific clinical manifestations, which is similar to PDAC [5]. The common imaging features of AIP on CT are hypo- or iso-attenuating focal enlargement which are mimic to those of PDAC lesions [4, 16–19]. MRI could manifest the imaging features of the AIP with high resolution such as hypo-intensity on T1-weighted images, hyperintensity or isointense on T2-weighted images, and delayed enhancement on contrast enhanced MRI, which might be helpful to diagnose AIP [20]. Longitudinal abnormal pancreatic FDG activities was more suggestive of AIP [21]. Although diffusion MRI and PET-CT might give important diagnostic molecular imaging information. They are time consuming and expensive [22]. Endoluminary CEUS is very helpful, but invasive and not superior to MRI including diffusion imaging. Changes of pancreatic duct showed by MRCP might be common imaging features for both AIP and PDAC lesions [14, 23]. Up to now, non-invasive imaging differentiation between focal-type AIP and PDAC is still great challenges.
The application and clinical recommendation of CEUS in pancreas has been included in the European Federation of Societies for Ultrasound in Medicine and Biology (EFSUMB) guidelines since 2008 [24–27]. CEUS has been proved to be an accurate imaging method in characterization of pancreatic lesions [25]. In recent years, dynamic CEUS (DCE-US) provides the quantitative analysis of tissue perfusion and the pathophysiology of angiogenesis of suspected lesions, which could make up for the limitations of CEUS [28, 29]. DCE-US was proved to be helpful in preoperative differential diagnosis of some focal liver lesions, such as hepatocellular carcinoma, cholangiocellular carcinoma and metastatic liver cancer [29–32].
The aim of this study was to explore the potential value of DCE-US and CEUS quantitative parameters in preoperative diagnosis and differential diagnosis between focal-type AIP and PDAC lesions.
Patients & methods
Patients
From May 2016 to March 2020, patients with biopsy and histopathologically confirmed focal-type AIP (n = 9) were retrospectively included from our university hospital. This retrospective study was approved by the ethics committee of our institute (ID number: B2021-144). The informed consent was waived.
The inclusion criteria were: 1) patients with biopsy and histopathologically confirmed AIP lesions; 2) patients who received CEUS examinations one week before surgery/biopsy; 3) DICOM format of clips longer than 2 mins was available. The exclusion criteria were as following: 1) The pancreatic lesion could not be visible clearly on BMUS scan; 2) patients lack of CEUS DICOM images; and 3) patients without confirmed pathological results. Eighteen cases of surgery and histopathologically proved PDAC patients were also included as control group.
Ultrasound examinations procedure
All ultrasound examinations were performed using the 6C-1 convex array transducer (Acuson Oxana Siemens) or 5C-1 convex array transducer (Siemens Acuson Sequoia). 1.0–1.5 ml Sulphur hexafluoride microbubbles (SonoVue, Bracco, Italy) was injected via the cubital vein and followed by a 5–10 ml saline flush.
According to the EFSUMB Guidelines, pancreatic CEUS phases include arterial phase (10–30 s), venous phase (30–120 s) and delayed phase (> 120 s) [27]. The dynamic wash in - wash out process of the pancreatic lesions at least 2 min after the injection of the contrast agent was recorded. CEUS data were exported in DICOM format as cine loops for further analysis.
Dynamic contrast enhanced ultrasound (DCE-US) analysis
Analysis of CEUS clips was performed by an independent examiner who was unaware of the patients’ clinical history or the finding of imaging modalities using the perfusion CEUS software (VueBox®/Bracco, Geneva). Two regions of interests (ROIs) were set inner the pancreatic lesions and in the adjacent pancreatic tissue, with the same depth, same size and same shape [6]. Large vessels or necrosis area were avoided. The motion compensation function was used to reduce the breath motion artifact. Time-intensity curve (TICs) were then generated, which described the dynamic process of wash-in and wash-out of the contrast microbubbles in the ROI. TICs were recorded and compared between AIP and PDAC groups, including enhancement start time, peak enhancement, ascending rate, descending rate and the area under the curve.
After curve fitting, results were considered credible when the quality of fit > 75%. CEUS quantitative parameters were extracted as follows: PE (peak enhancement), WiAUC (wash-in area under the curve), RT (rise time), mTT (mean transit time), TTP (time to peak), WiR (wash-in rate), WiPI (wash-in perfusion index, WiPI = WiAUC/ rise time), WoAUC (wash-out area under the curve), WiWoAUC (Wash-in and Wash-out area under the curve), FT (fall time), and WoR (wash-out rate) [33]. Ratio of quantitative parameters of pancreatic lesions and pancreatic parenchyma including PE ratio, WiAUC ratio, RT ratio, mTT ratio, TTP ratio, WiR ratio, WiPI ratio, WoAUC ratio, WiWoAUC ratio, FT ratio, WoR ratio was also calculated. Results were recorded and compared between AIP and PDAC groups.
Statistical analysis
The continuous data were expressed as means and standard deviations for normally distributed variables and as median and interquartile range for non-normally distributed variables. Difference comparison used Student t-test or Mann-Whitney U-test when it’s appropriate. All data were calculated using the software program SPSS Statistics 22.0 (IBM, Armonk, USA) and GraphPad Prism 7 (GraphPad Software, Inc.). P value < 0.05 was considered statistically significant.
Results
Patients’ characteristics
The baseline characteristic of enrolled patients was summarized in Table 1. Patients in AIP group did not show any specific clinical syndromes. Serum IgG4 level increasement are more common in AIP patients (5/9, 55.6%) than in PDAC patients (3/18, 16.7%).
Baseline characteristics of patients
Baseline characteristics of patients
AIP (autoimmune pancreatitis), PDAC (pancreatic ductal adenocarcinoma).
All AIP lesions and PDAC lesions were heterogenous hypoechoic solid lesion on BMUS. Among all focal AIP lesions, most of AIP lesions (7/9,77.8%) were located in the head or neck of the pancreas. No significant difference was detected in mass size between AIP and PDAC (31.5±12.0 mm vs. 31.1±11.6 mm) (Table 2).
Ultrasound features of pancreatic lesions
Ultrasound features of pancreatic lesions
AIP (autoimmune pancreatitis), PDAC (pancreatic ductal adenocarcinoma).
After injection of contrast agent, most AIP lesions displayed hyper-enhancement (2/9, 22.2%) or iso-enhancement (6/9, 66.7%) during arterial phase (Fig. 1). However, most PDAC lesions were hypo-enhancement (88.9%) (P < 0.01). During late phase, most AIP lesions were iso-enhanced (88.9%), while majority of PDAC lesions were hypo-enhancement (94.4%) (P < 0.01) (Table 2).
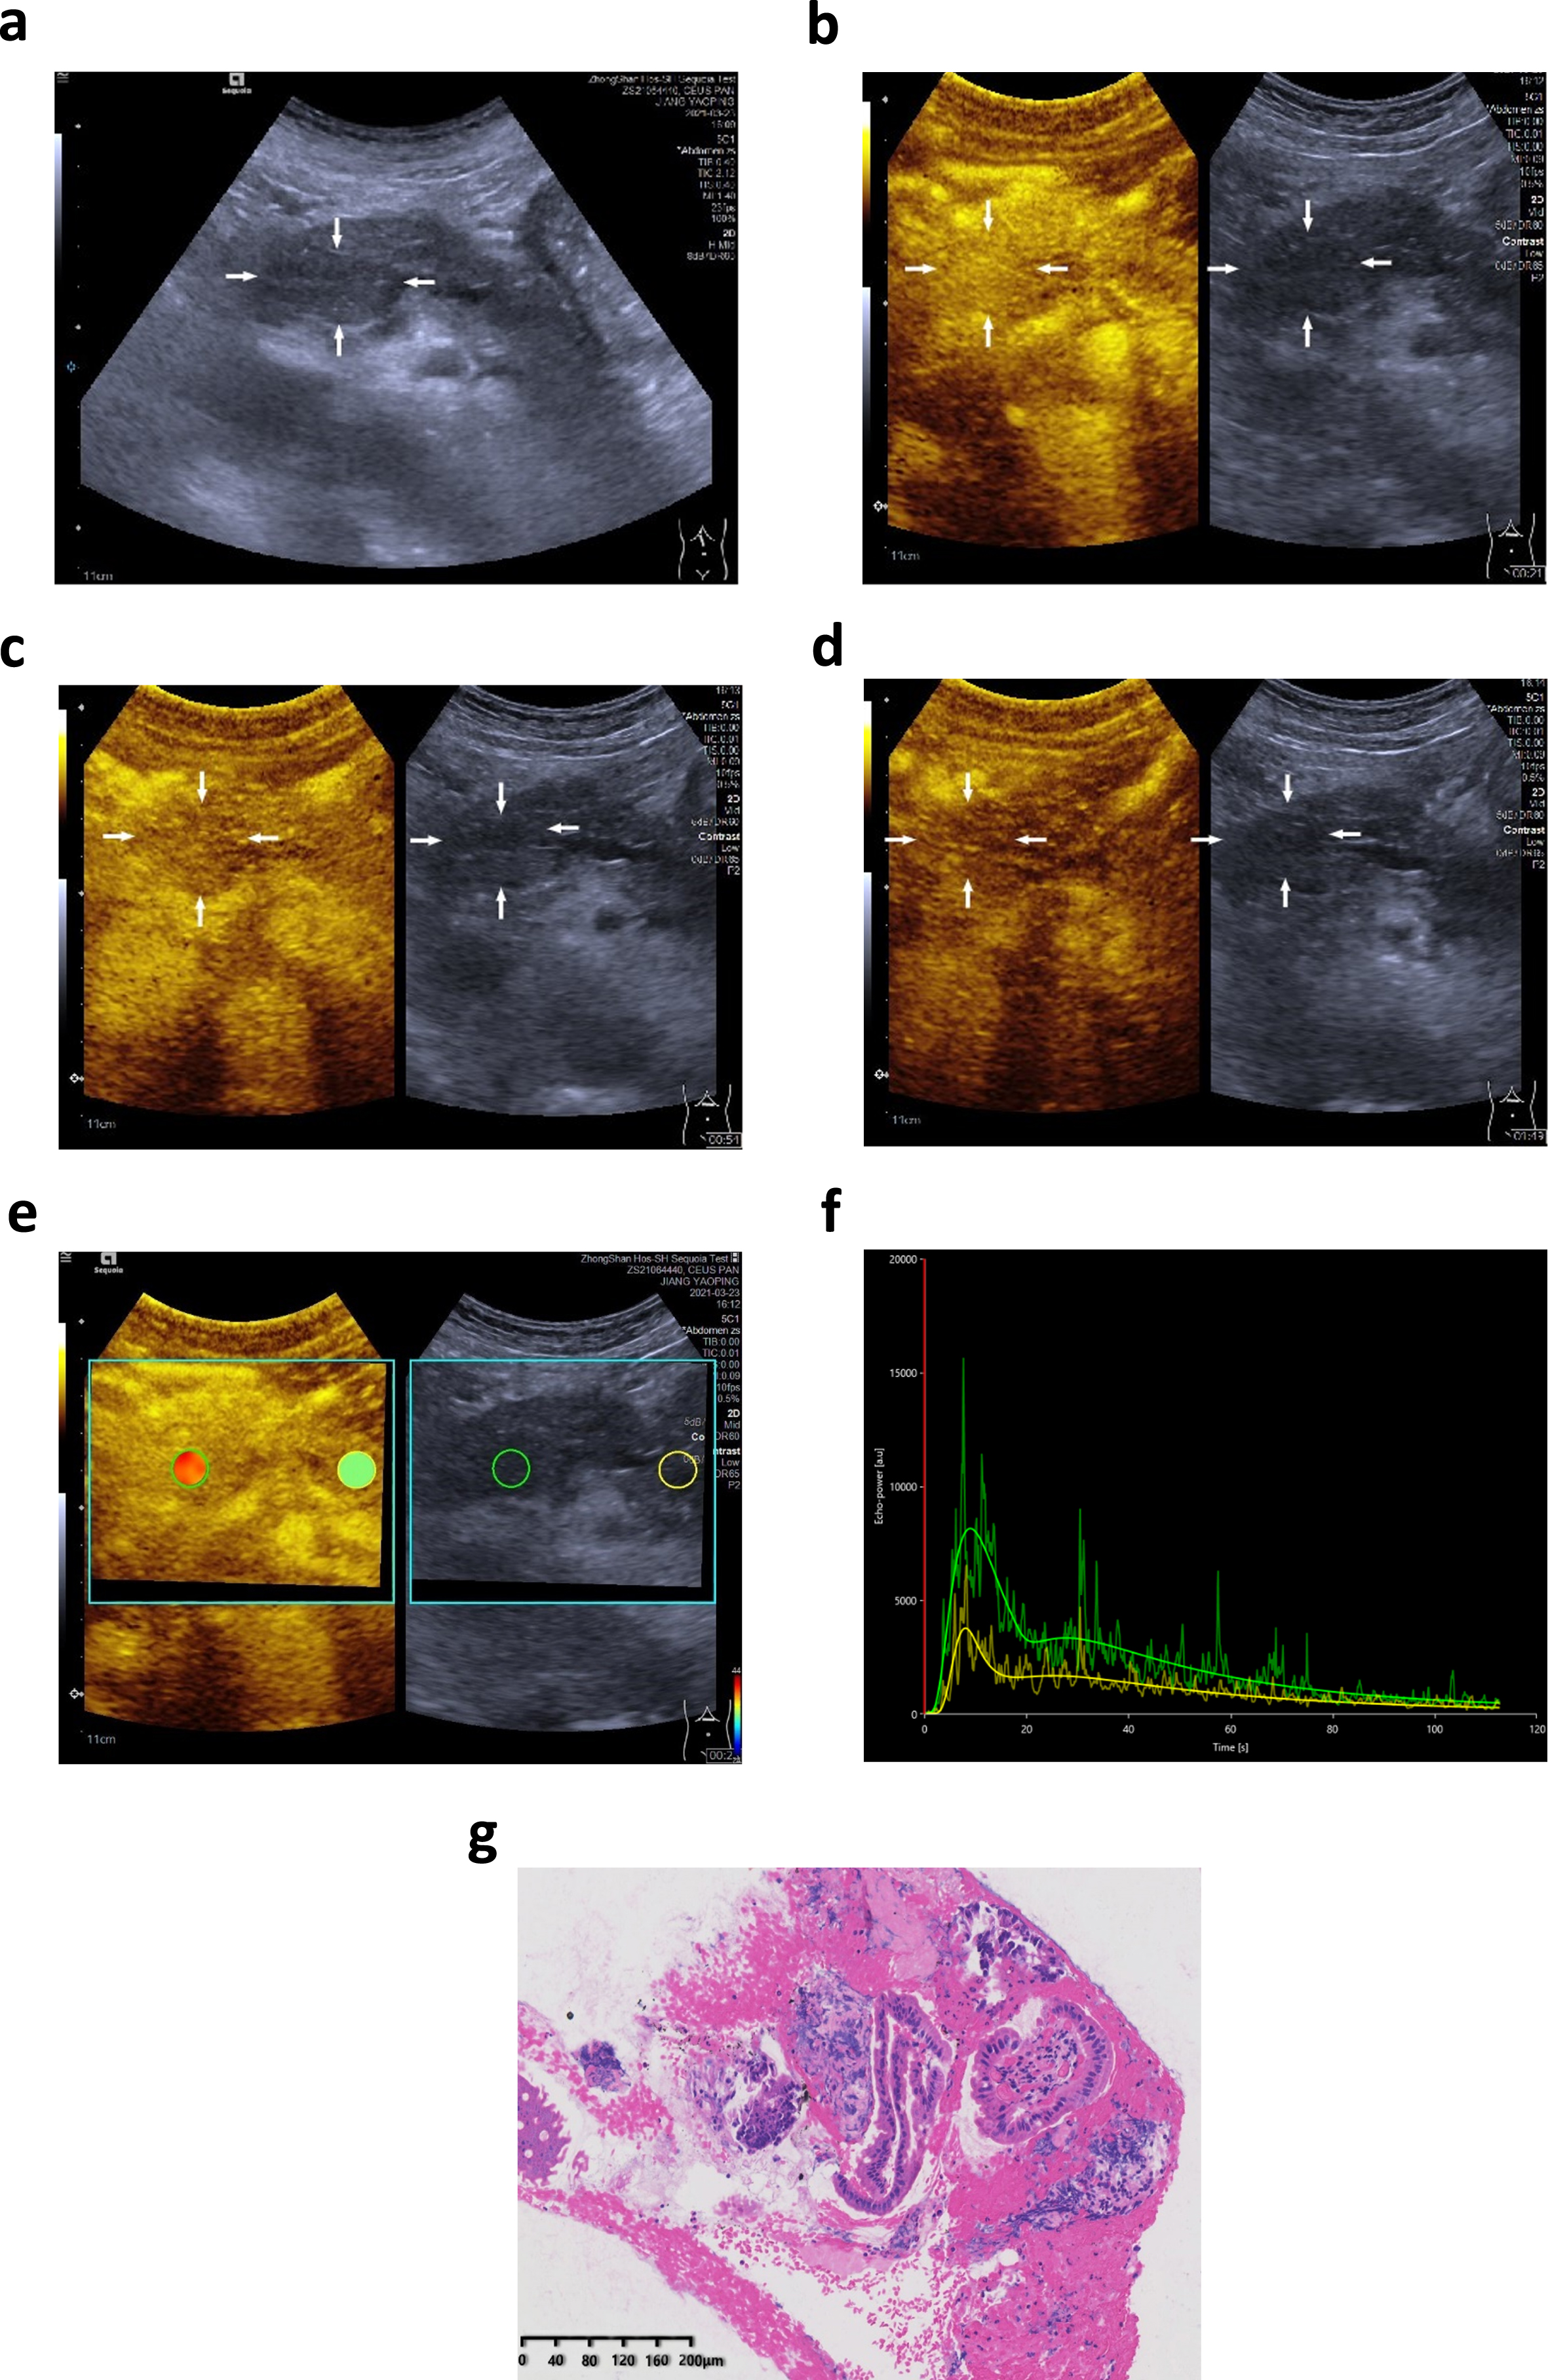
A 65-year-old male patients with incidentally detected focal pancreatic lesion. On B mode ultrasound (BMUS), a 31 mm hypoechoic mass could be detected in the head of pancreas (a). After injection of contrast agents, the lesion showed hyper-enhancement during arterial phase (b), iso-enhancement during venous phase (c) and late phase (d). While using Vuebox for dynamic analysis, the regions of interests (ROIs) were placed in the pancreatic lesions and the adjacent pancreatic tissue (e). The time intensity curve (TICs) of the ROI was generated (f). Comparing with the surrounding pancreatic tissue (yellow curve), the AIP lesion (green curve) showed earlier and higher enhancement, slower decline, and larger area under the curve. The lesion was proved to be an autoimmune pancreatitis (AIP) lesion by biopsy and histopathological results (g).
Further DCE-US and quantitative analysis proved the reliable results of using VueBox for all pancreatic lesions, and the fitting quality exceeded 75%. Perfusion parameters of AIP lesions had no significant difference from the surrounding pancreatic parenchyma (Table 3). However, perfusion quantitative parameters PE, WiAUC, WiR, WiPI, WoAUC, WiWoAUC and WoR were significantly lower in PDAC lesions than surrounding pancreatic parenchyma (P < 0.05).
Ratio of quantitative parameters in pancreatic lesions and in pancreatic parenchyma was calculated. The PE ratio, WiAUC ratio, WiR ratio, WiPI ratio, WoAUC ratio, WiWoAUC ratio and WoR ratio were significantly higher in AIP group than in PDAC group (P < 0.05) (Table 4, Fig. 3). No significant difference was detected in RT ratio, mTT ratio, TTP ratio and FT ratio between AIP and PDAC group (P > 0.05) (Table 4).
Contrast enhanced ultrasound quantitative parameters of AIP and PDAC lesions (Mean, Standard deviation)
Contrast enhanced ultrasound quantitative parameters of AIP and PDAC lesions (Mean, Standard deviation)
a, AIP (autoimmune pancreatitis), p, PDAC (pancreatic ductal adenocarcinoma), PE (peak enhancement), WiAUC (wash-in area under the curve), RT (rise time), mTT (mean transit time), TTP (time to peak), WiR (wash-in rate), WiPI (wash-in perfusion index, WiPI = WiAUC/ rise time), WoAUC (wash-out area under the curve), WiWoAUC (Wash-in and Wash-out area under the curve), FT (fall time), and WoR (wash-out rate). *, significant statistical difference.
Comparison of ratio of contrast enhanced ultrasound quantitative parameters (Median, Interquartile range)
AIP (autoimmune pancreatitis), PDAC (pancreatic ductal adenocarcinoma), PE (peak enhancement), WiAUC (wash-in area under the curve), RT (rise time), mTT (mean transit time), TTP (time to peak), WiR (wash-in rate), WiPI (wash-in perfusion index, WiPI = WiAUC/ rise time), WoAUC (wash-out area under the curve), WiWoAUC (Wash-in and Wash-out area under the curve), FT (fall time), and WoR (wash-out rate).

A 68-year-old male patients with incidentally detected focal pancreatic lesion. On B mode ultrasound (BMUS), a 54 mm hypoechoic mass could be detected in the body-tail of pancreas (a). After injection of contrast agents, the lesion showed hypo-enhancement during arterial phase (b), venous phase (c) and late phase (d). While using Vuebox for dynamic analysis, the regions of interests (ROIs) were placed in the pancreatic lesions and in the adjacent pancreatic tissue (e). The time intensity curve (TICs) of the ROI was generated (f). Comparing with the surrounding pancreatic tissue (yellow curve), the PDAC lesion (green curve) showed later and lower enhancement and smaller area under the curve. The lesion was proved to be a pancreatic ductal adenocarcinoma (PDAC) lesion by surgery and histopathological results.

Comparison between the dynamic contrast enhanced ultrasound (DCE-US) quantitative parameters in autoimmune pancreatitis (AIP) and pancreatic ductal adenocarcinoma (PDAC). Ratio of peak enhancement (PE), wash-in area under the curve (WiAUC), wash-in rate (WiR), wash-in perfusion index (WiPI), wash-out area under the curve (WoAUC), Wash-in and Wash-out area under the curve (WiWoAUC), and wash-out rate (WoR) was significantly higher in AIP group than PDAC group (P < 0.05).
AIP is a relatively rare clinical disease which was described as early as the 1960s by Sarles [34]. From the medical imaging point of view, AIP can be divided into two types: focal-type and diffuse-type. Focal-type AIP manifests as a focal enlargement of the pancreas which often confuses with other pancreatic malignant tumors, such as PDAC [5, 35] or lymphoma [36]. Previously the imaging diagnostic sensitivities and specificities for differentiating focal-type AIP from PDAC were 50% (95% CI, 16–85%) and 98% (95% CI, 93–100%) by CT and 76% (95% CI, 54–99%) and 97% (95% CI, 91–100%) by MRI [10, 37–40]. It’s reported 15.2% (5/33) of patients with PDAC were incorrectly diagnosed as AIP and 36.0% (9/25)of patients with AIP were incorrectly diagnosed as PDAC in a multicenter study [41]. Currently the preoperative noninvasive diagnose of focal-type AIP still remains as challenges.
Laboratory test is a useful auxiliary examination in which AIP can be expressed as elevated IgG4 and serum gamma globulin. Serum IgG4 levels higher than 135 mg/dL are considered to be 73.3% sensitivity and 93.7% specificity in differentiating AIP from pancreatic cancer[42]. However, mild elevation of serum IgG4 level can also be found in 10% patients with PDAC [43]. In our current study, elevated IgG4 could be seen both in AIP and PDAC disease. Elevated IgG4 level isn’t a specific indicator for diagnosing AIP. Serum gamma globulin had been reported to be elevated in AIP patients, but this biomarker wasn’t specific.
Ultrasound is the first-line imaging method for the pancreatic masses in the clinical which is excellent for the monitoring, follow up, detection of fluid collection. As shown in our results, both focal-type AIP and PDAC appear as hypoechoic masses on BMUS. Meanwhile CEUS could give us real time microvascular perfusion and detection of necrotic areas of pancreatic lesions without radiation [5]. A meta-analysis indicated that CEUS was a prospect imaging tool for characterizing and differentiating PDAC from other pancreatic diseases[44]. After contrast agent injection, most PDAC were continuous hypo-enhancement during the entire phase due to the paraneoplastic fibrosis and desmoplasia [26]. In contrast, the most common imaging characteristics of focal-type AIP were iso-enhancement or hyper-enhancement during arterial phase and iso-enhancement during late phase in our study [45]. CEUS could also offer the possibility to analyze dynamic microcirculatory disturbances at the bedside in real time without any risk for kidneys when associates with the organ failure of COVID-19 infections [46, 47]. Pancreatic lymphoma, a rare form of extranodal lymphoma, typically appears as large homogeneous hypoechoic mass on ultrasound which is difficult to distinguish from AIP [48, 49]. Pancreatic lymphoma typically manifests as a diffuse or focal, well-defined mass with homogenous hypo-enhancement on contrast CT [50]. There are few studies on CEUS for pancreatic lymphoma, let alone DCE-US, and further research should be done to better differentiate pancreatic lymphoma from AIP. Endoscopic ultrasound-guided fine needle biopsy combined with rapid onsite evaluation, immunohistochemistry, and flow cytometry is a valuable diagnostic modality for diagnosing pancreatic lymphoma [51]. Due to the deep location of pancreatic lesions, it might be difficult to observe or judge the enhancement differences between pancreatic lesions and pancreas parenchyma. In our results, TIC curves of focal-type AIP demonstrate earlier enhancement, faster wash-in, higher PE, slower wash-out, and larger area under the curve than PDAC. TIC curves can intuitively and sensitively display the difference of enhancement pattern and enhancement rate between focal-type AIP and PDAC lesions. It’s more sensitive and direct than the CEUS features.
DCE-US quantitative analysis can provide objective perfusion information of the tumor lesion [28, 52]. The application of Vuebox software based DCE-US for characterization and differential diagnosis of focal liver lesions, as well as on its use for predicting the microvascular invasion, monitoring of local ablative therapies and of modern systemic treatment in oncology has been successful [53, 54]. It’s also has been reported that DCE-US quantitative analysis and quantitative parameters has potential application value in evaluation of the chemoradiotherapy treatment and high-intensity focused ultrasound response in local advanced PDAC patients [6, 19]. Recent studies support the potential role of DCE-US in monitoring treatment effect of pancreatic masses [55, 56]. Moreover, CEUS with perfusion imaging requires no additional fee, only CEUS fees are required (about 100 Euro). To further explore the clinical value of DCE-US in diagnosis and differential diagnosis of focal-type AIP, DCE-US with quantitative analysis was performed in this study. Perfusion parameters PE, WiAUC, WiR and WiPI represent contrast agents perfusion during arterial phase, parameters WoAUC and WoR represent wash-out of the contrast agents. Moreover, WiWoAUC represent the entire perfusion process. RT, TPP, mTT, FT are parameters to evaluate the perfusion rate [57]. Perfusion parameters of focal-type AIP lesions had no significant difference from the surrounding pancreatic parenchyma, which may due to the proliferation of fibrous tissue and lymphoplasmacytic infiltration is limited to the pancreatic tissue [58]. Meanwhile, due to the interstitial fibrosis of AIP lesions, the ultrasound contrast agents wash out slowly in the venous and late phase. However, in PDAC lesions, as a tumor with typically poor blood supply [50, 59], the micro-vessel of the tumor tissue is lower than that of the surrounding pancreatic tissue. Therefore, perfusion quantitative parameters PE, WiAUC, WiR, WiPI, WoAUC, WiWoAUC and WoR were significantly lower in PDAC lesions than surrounding pancreatic parenchyma (P < 0.05). Moreover, the PE ratio, WiAUC ratio, WiR ratio, WiPI ratio, WoAUC ratio, WiWoAUC ratio and WoR ratio were significantly higher in AIP group than PDAC group (P < 0.05). PE ratio, WiAUC ratio, WiR ratio, WiPI ratio, WoAUC ratio, WiWoAUC ratio and WoR ratio could be the features and characteristics of differentiation of AIP from PDAC. DCE-US with quantitative parameters can provide more accurate and quantify information to differentiate between focal-type AIP and PDAC.
There are several limitations of this study. Since focal-type AIP is very rare clinically, the small number of enrolled patients and retrospective study are the main limitations. VueBox software is an external software that requires additional time to evaluate and there is no final evaluation of perfusion parameters, which is also a limitation. Prospective multicenter study might provide further results in the future.
Conclusion
DCE-US with quantitative analysis has the potential value to preoperatively differentiate focal-type AIP and PDAC accurately and non-invasively.
Funding
Supported by National Natural Science Foundation of China (Grant No. 82071942). Supported by Shanghai Pujiang Program (Grant No. 2020PJD008). Supported by Clinical Research Plan of SHDC (Grant No. SHDC2020CR1031B, SHDC2020CR4060). Supported by Shanghai Municipal Science and Technology Medical Guidance Project (Grant No. 18411967200).