
Abstract
OBJECTIVE:
This study aimed to evaluate the diagnostic performance of two-dimensional shear wave elastography (2D-SWE) with a propagation map in evaluating the degree of hepatic fibrosis in patients with liver tumors before resection.
METHODS AND MATERIALS:
From January 2020 to April 2021, 128 patients with liver tumors were prospectively enrolled, including 20 benign liver tumors and 108 malignant liver tumors. 2D-SWE with a propagation map technology was used to measure the stiffness of liver parenchyma 2 cm away from the tumor. The median value of five measurements was used in this study. The stage of hepatic fibrosis was graded in accordance with Scheuer standard. Spearman correlation was used to analyze the correlation between liver fibrosis stage and the liver stiffness. Univariate and multivariate linear regression analyses were used to determine significant affecting factors for liver stiffness value. The diagnostic performance of 2D-SWE with a propagation map in predicting fibrosis stage was evaluated by receiver operating characteristic curve analysis.
RESULTS:
The median liver stiffness value in patients with benign liver tumors was lower than that in patients with malignant liver tumors (6.0 kPa vs. 9.4 kPa, p < 0.05). The median liver stiffness values in patients with primary liver cancer were higher than that in patients with benign liver tumors and other types of malignant liver tumors (9.6 kPa vs. 6.0 kPa, p < 0.05). The liver stiffness measured by 2D-SWE was highly correlated with the fibrosis stage confirmed by postoperative pathology (r = 0.834, p < 0.05). For the liver stiffness value, PLT,TB,ALB and fibrosis stage are significantly associated with liver stiffness. The median liver stiffness values in stages S0–S4 of fibrosis were 6.0, 7.2, 8.0, 9.4, and 12.6 kPa, respectively. The areas under the ROC curve of S≥1, S≥2, S≥3, and S = 4 as predicted by SWE were 0.932, 0.945, 0.945, and 0.916, respectively. According to the Youden index, the optimal critical values for predicting fibrosis S≥1, S≥2, S≥3, and S = 4 were 6.8 (sensitivity of 89.69% and specificity of 93.55%), 7.5 (sensitivity of 87.50 % and specificity of 95.00 %), 8.3 (sensitivity of 87.14 % and specificity of 87.93 %) and 9.8 (sensitivity of 79.55 % and specificity of 86.90 %) kPa.
CONCLUSION:
2D-SWE with a propagation map could noninvasively and accurately predict the staging of liver fibrosis in patients with liver tumors before resection.
Introduction
Hepatectomy is an important treatment for liver tumors and other diseases. Liver failure is one of the common postoperative complications after hepatectomy, with an incidence of 2.4% –13.9% [1]. The disease-free survival and overall survival of patients undergoing hepatectomy are affected by post hepatectomy liver failure (PHLF) [2]. In recent years, many studies have shown that liver cirrhosis is an independent risk factor for PHLF [3], and the mortality after liver cirrhosis related hepatectomy is also affected by the degree of liver fibrosis [4]. Without biopsy of liver parenchyma, evaluating the degree of liver fibrosis in patients with liver tumors before operation is difficult. Non-invasive methods for liver fibrosis assessment have been an intense field of research [5]. In liver fibrosis or cirrhosis, parenchymal changes can lead to lumen reduction of vessels and changes in morphology, combination of HR Flow with Glazing Flow could be helpful to evaluate morphological und hemodynamic changes of liver arterial flow, portal venous and venous flow [6]. Some research results showed that ultrasound elastography could reflect the degree of liver fibrosis and liver reserve function by measuring liver stiffness [7, 8]. Ultrasound elastography has been widely used [9] and recognized in evaluating liver fibrosis [10], and it has certain potential in reflecting liver reserve function and predicting surgical resection prognosis [11]. The type of elastosonography applied to the liver mainly include transient elastography, single-point shear wave elastography, and two-dimensional shear wave elastography (2D-SWE). 2D-SWE has the advantages of high success rate, good reproducibility, and large sampling area under the guidance of two-dimensional ultrasound images. It has a good diagnostic efficiency in evaluating liver fibrosis, especially hepatitis-B-related liver fibrosis [7]. It can be used to diagnose cirrhosis and F3 grade liver fibrosis, comparable to liver biopsy [12]. Liver stiffness assessed by shear-wave elastography declines in parallel with immunoregulatory proteins in patients with chronic HCV infection during direct-acting antivirals therapy [13]. Canon’s shear wave elastography is different from other 2D-SWE technique in terms of image quality control. In the dual imaging mode, the left part shows an elasticity map, and the right part shows a propagation map that can visualize shear wave generation, as well as propagation, which helps in selecting a suitable area of liver parenchyma for liver stiffness measurement [14, 15]. Liver stiffness measurements are possible accurate and reliable when the propagation map showed areas with parallel lines. Lee [14] found that this 2D-SWE with a propagation map technique provides excellent diagnostic performance in predicting liver fibrosis stage using transient elastography as the reference standard.
This study aimed to use 2D-SWE with a propagation map to evaluate the liver fibrosis in hepatic background parenchyma in patients with liver tumors undergoing hepatectomy, using the pathology of surgically resected tissue as a reference standard.
Patients and methods
Patients
This study was approved by the Research Ethics Committee of Zhongshan Hospital, (ethical commitment number B 2021-653), Fudan University (China). Written informed consents were provided by all participants. This study meets the ethical requirements of the declaration of Helsinki. A total of 138 consecutive patients who planned to undergo liver tumor resection from January 2020 to April 2021 were prospectively involved. The inclusion criteria were as follows: (1) patients with focal liver lesions confirmed by pathology or diagnosed by imaging methods; (2) planned surgical treatment. The exclusion criteria were the following: (1) local treatment, such as radiofrequency ablation and TACE, performed before operation; (2) poor breath holding; and (3) incomplete clinical data.
Performance of 2D-SWE
2D-SWE was performed with Canon aplio i900 Ultrasound System, equipped with a PVI-475BX convex probe and a frequency range of 1–8 MHz. Elastography was performed by the attending physician with 5 years of experience in ultrasound elastography. The patient fasted for 6 hours, lied in a supine position, and raised his/her hands and placed them on the head side. The patient underwent routine ultrasonography examination, the anteroposterior diameter of the right and left liver lobes, the length and thickness of the spleen, the inner diameters of the portal and spleen veins were obtained. The location of the tumor was observed, and the size of the tumor was measured. Then, in an area free of tumor and large pipeline structure in the liver, a section of liver parenchyma more than 2 cm away from the liver tumor was located. The sampling frame was placed 1–2 cm below the capsule of the right lobe of the liver. The patient held his/her breath for 1 second during data acquisition, and the image was frozen when most of the sampling frame was filled with color and stable. A circular region of interest with a diameter of 2 cm was taken and placed at the position showing smooth and parallel lines on the propagation map. The liver stiffness was measured. The mean value and standard deviation of liver elastic modulus in the detection area were displayed and recorded (unit: kPa, Fig. 1). Five measurements were conducted in different areas of the right lobe of the liver, and the median value was taken. A reliable measurement was defined as less than 30% of the interquartile range (IQR)/median value [16].
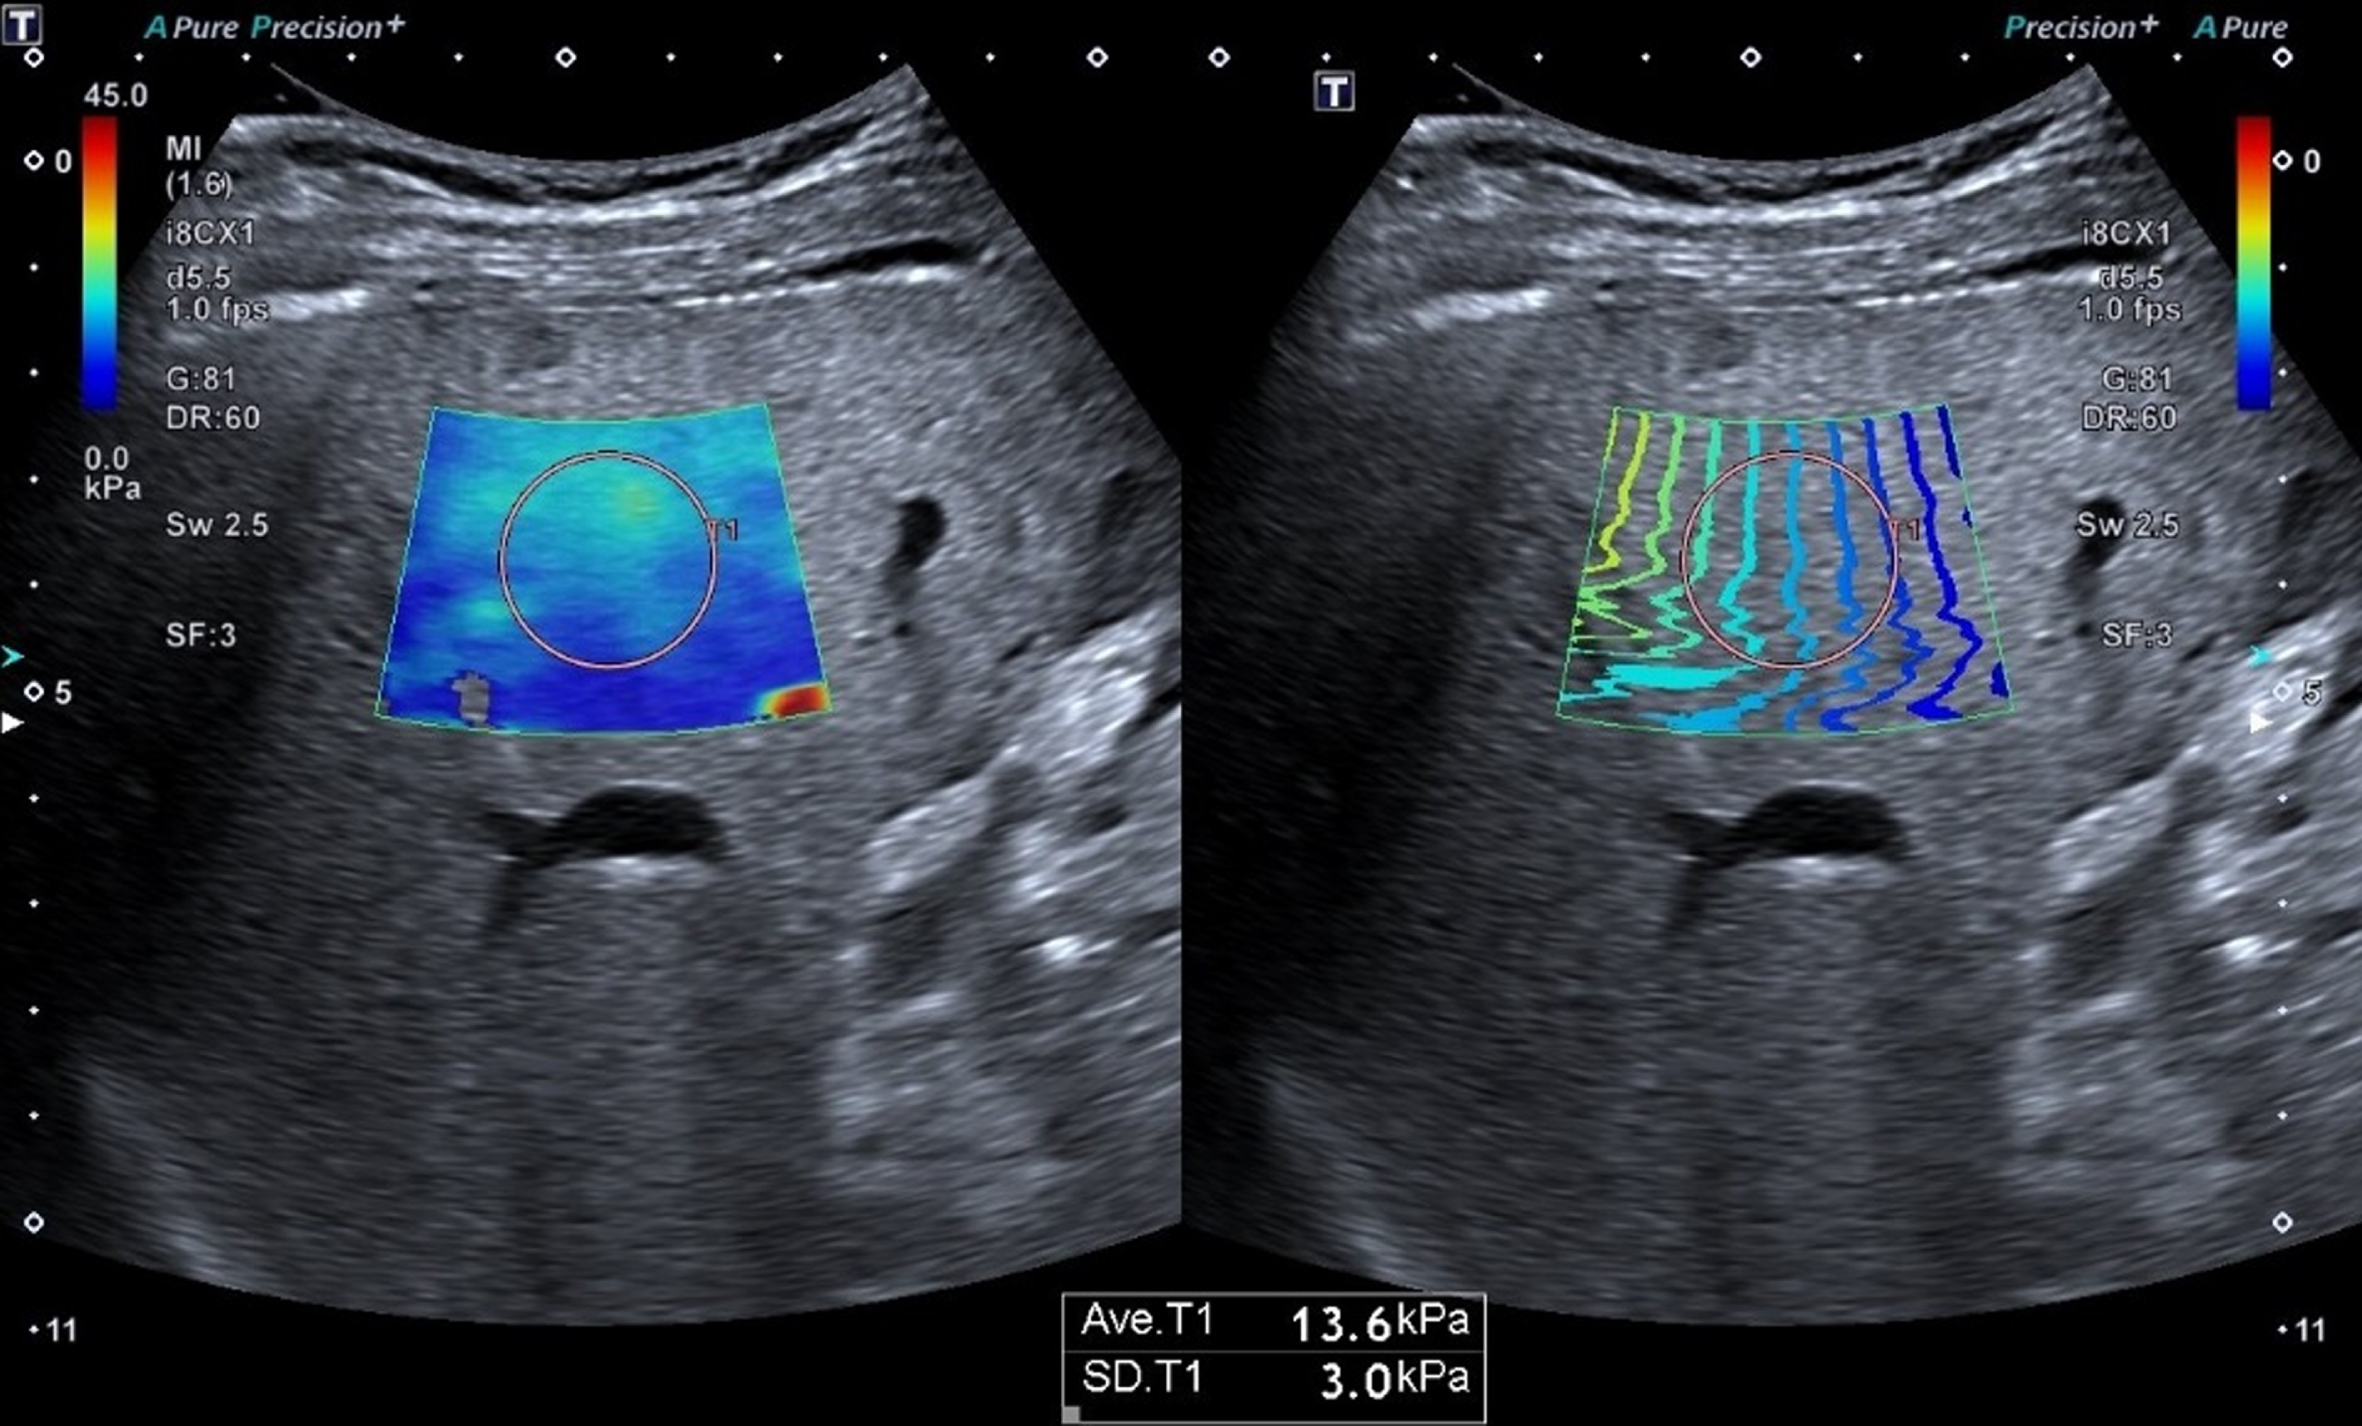
2D-SWE with a propagation map measurement of liver elastic modulus. The sampling frame was placed 1–2 cm below the liver capsule, avoiding the intrahepatic duct structure, and the circular region of interest with a diameter of 2 cm was placed at the position where the color and isochromatic lines of the elastic map were relatively uniform to measure the elastic modulus of the liver parenchyma.
After partial hepatectomy, the liver parenchyma around the lesion was fixed in 10% formaldehyde solution, paraffin section, conventional hematoxylin red staining, and reticular fiber staining and observed by optical microscope. In accordance with Scheuer’s criteria [17], liver fibrosis was divided into S0–S4 stages as follows: S0: no fibrosis; S1: fibrosis in the portal area expanded and localized fibrosis around the sinus and in the lobules; S2: fibrotic fibrous septum is formed around the portal area, retaining lobular structure; S3: fibrous septum with lobular structure disorder, no cirrhosis; and S4: early cirrhosis.
Statistical analysis
Statistical analysis was performed on SPSS 22.0 software (SPSS, Chicago, IL, USA). According to whether the data obey the normal distribution (single sample Kolmogorov Smirnov test method), the quantitative variables were expressed as mean±standard deviation (SD) or median (interquartile interval). The qualitative variables were expressed as a number (percentage). Spearman’s correlation test was used to explore the correlation between the liver stiffness value and the fibrosis stage. Mann–Whitney test and Kruskal–Wallis test were used to compare the continuous variables with non-normal distribution and uneven variance. Wilcoxon tests were also used for univariate comparisons between groups. The value of SWE in predicting different fibrosis was analyzed by receiver operating characteristic (ROC) curve, and the sensitivity, specificity, positive predictive value, and negative predictive value were calculated. The optimal diagnostic cutoff values for the diagnosis of different stages of fibrosis were identified in accordance with the Youden index. P < 0.05 was considered statistically significant.
Results
Success rate of 2D-SWE with a propagation map
A total of 138 patients with liver tumors underwent SWE examination 3 days before operation. Among them, we excluded 10 patients, including 2 patients who could not hold their breath, 2 patients with atrophy of the right lobe of the liver, 3 patients with poor image quality due to obesity, and 3 patients with poor image quality due to gastrointestinal gas. The success rate in patients with liver tumors was 92.70% (128/138).
Clinical characteristics
Clinical features of 128 patients were summarized in Table 1.
Clinical characteristics of patients included (n = 128)
Clinical characteristics of patients included (n = 128)
Note: FNH: focal nodular hyperplasia; HCC: hepatocellular carcinoma; ICC: intra-hepatic cholangiocarcinoma. Quantitative variables were expressed as mean±standard deviation (SD) or median (interquartile interval). The qualitative variables were expressed as a number (percentage) depending on whether the variables conform to normal distribution.
The median liver stiffnesses were 8.5 (6.3–11.6) kPa in 128 patients with liver tumors, 6.0 kPa in 20 patients with benign liver tumors (Fig. 2), and 9.4 kPa in 108 patients with malignant liver tumors (Fig. 3). The median liver stiffness in patients with malignant liver tumors was higher than that in patients with benign liver tumors (p = 0.000, Fig. 4a). The median liver stiffness in 97 patients with primary liver cancer (HCC, ICC, and HCC-ICC) was 9.6 kPa, and the median liver stiffness in 31 patients with benign liver tumors and other malignant liver tumors was 6.0 kPa. The median liver stiffness in patients with primary liver cancer was higher than that of other liver tumors, and the difference was statistically significant (p = 0.000, Fig. 4b).
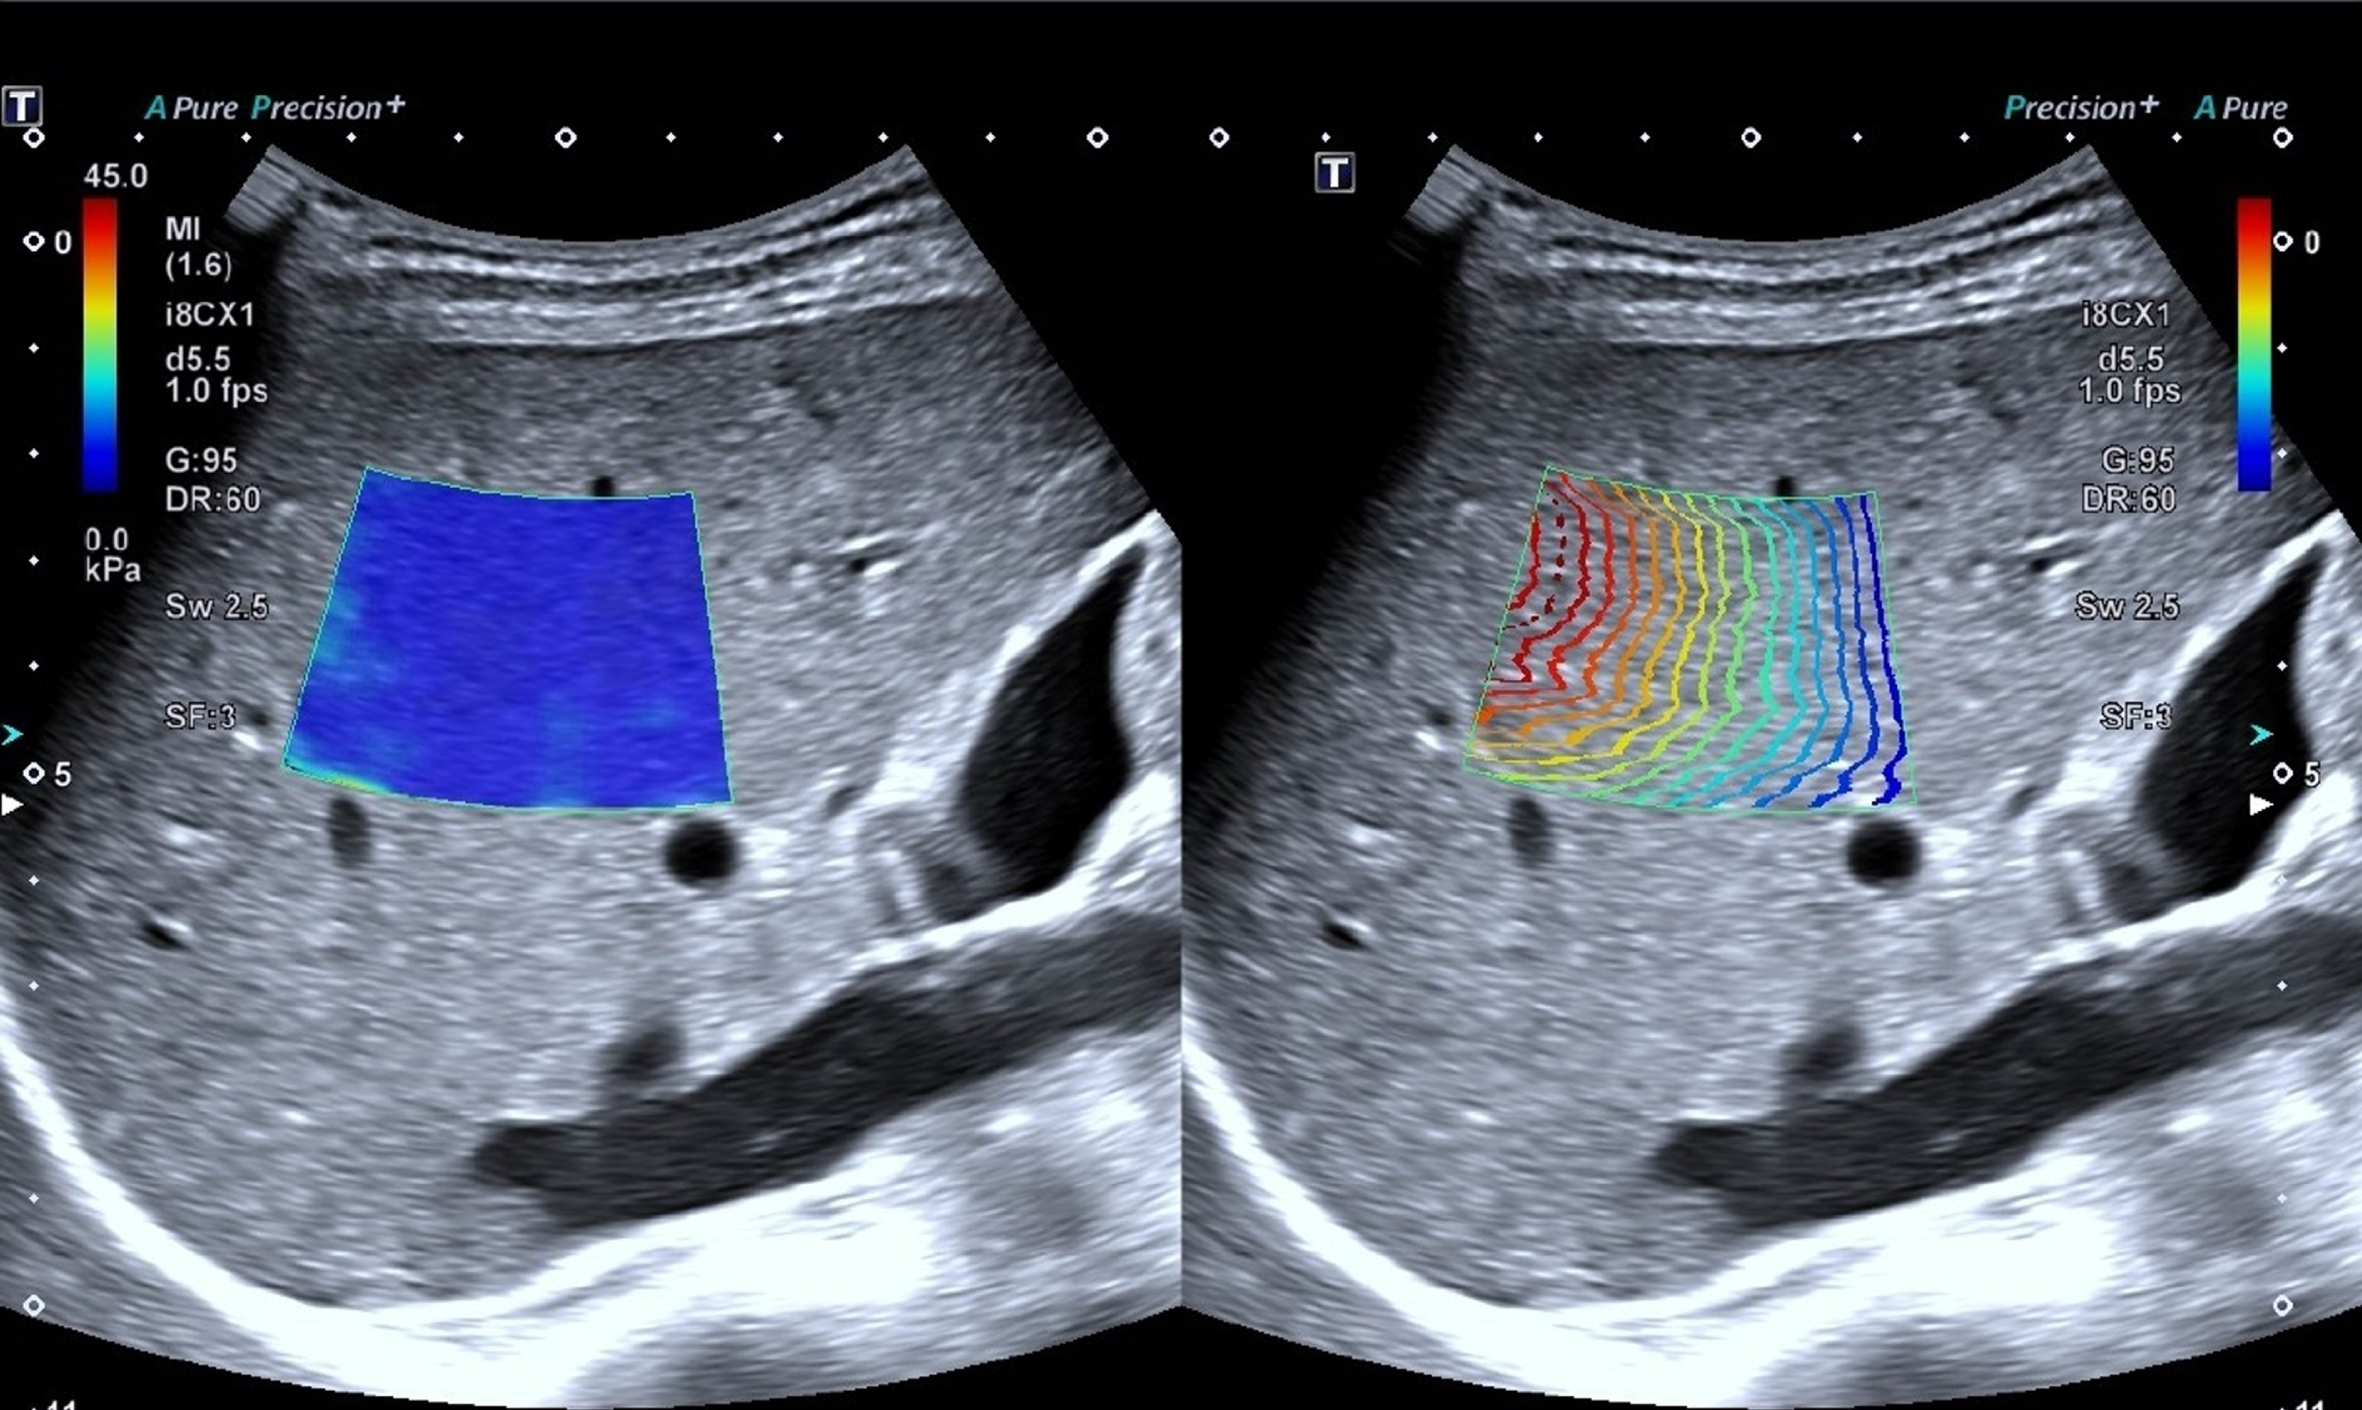
Hepatocellular carcinoma in a 53-y-old man with liver cirrhosis (fibrosis stage 4), the median value for SWE is 18.6 kPa.
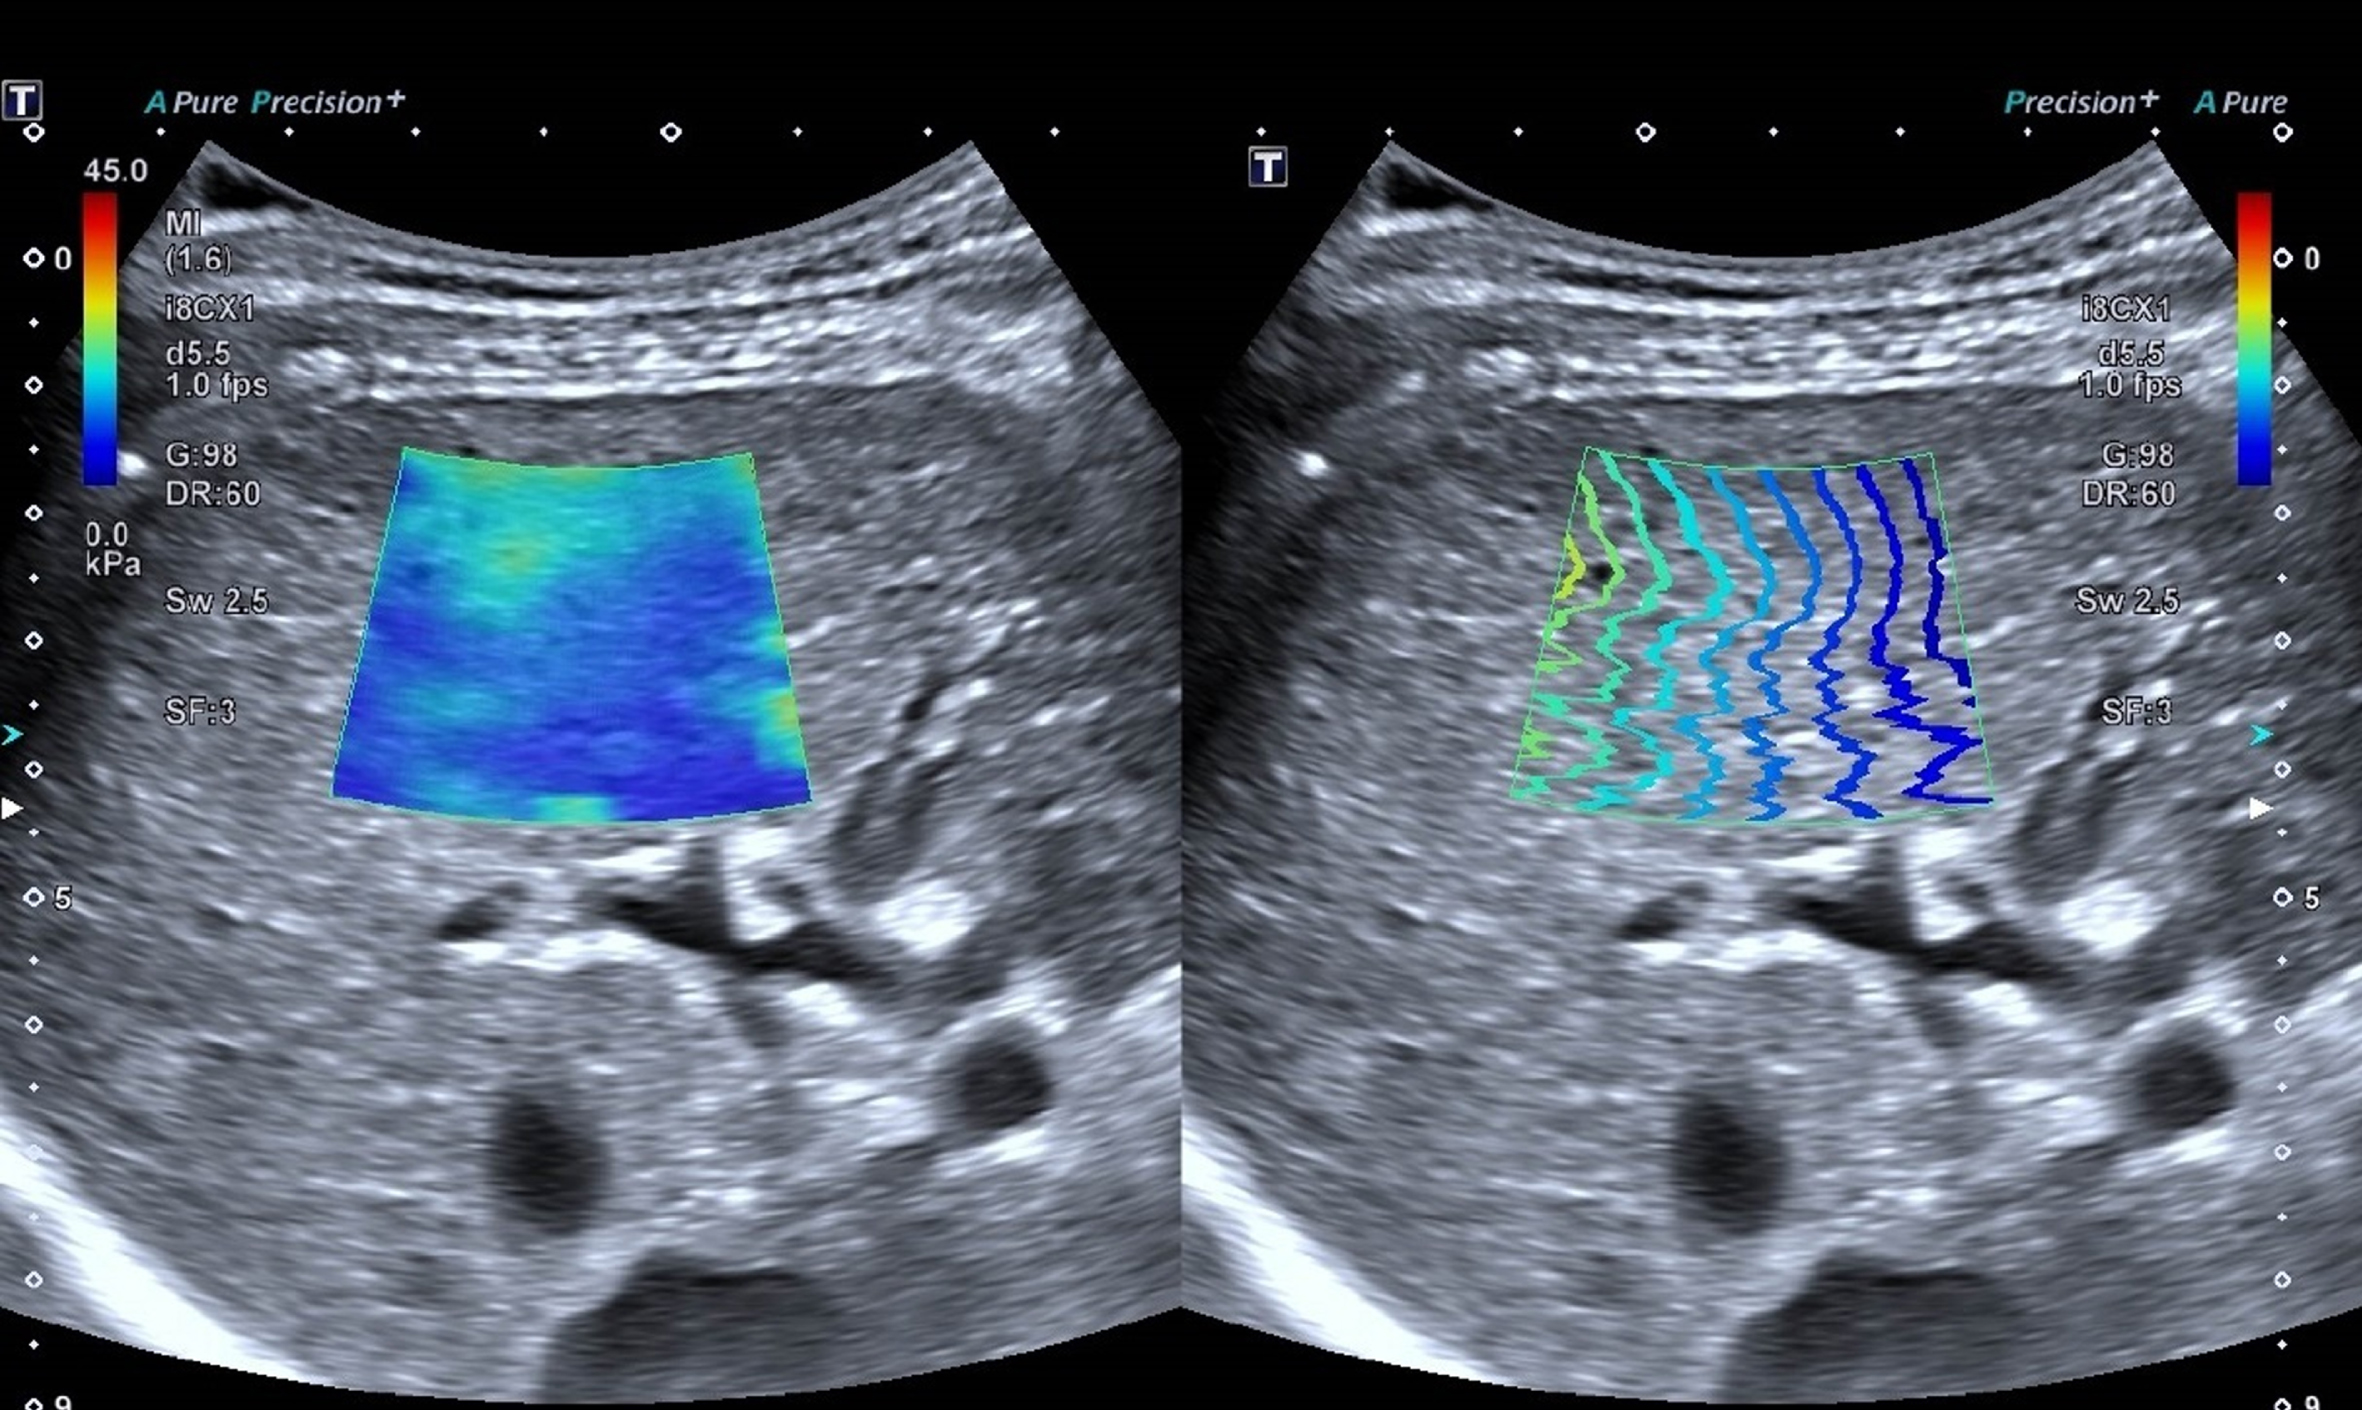
Angiocavernoma in a 35-y-old woman with normal liver (fibrosis stage 0), the median value for SWE is 4.7 kPa.
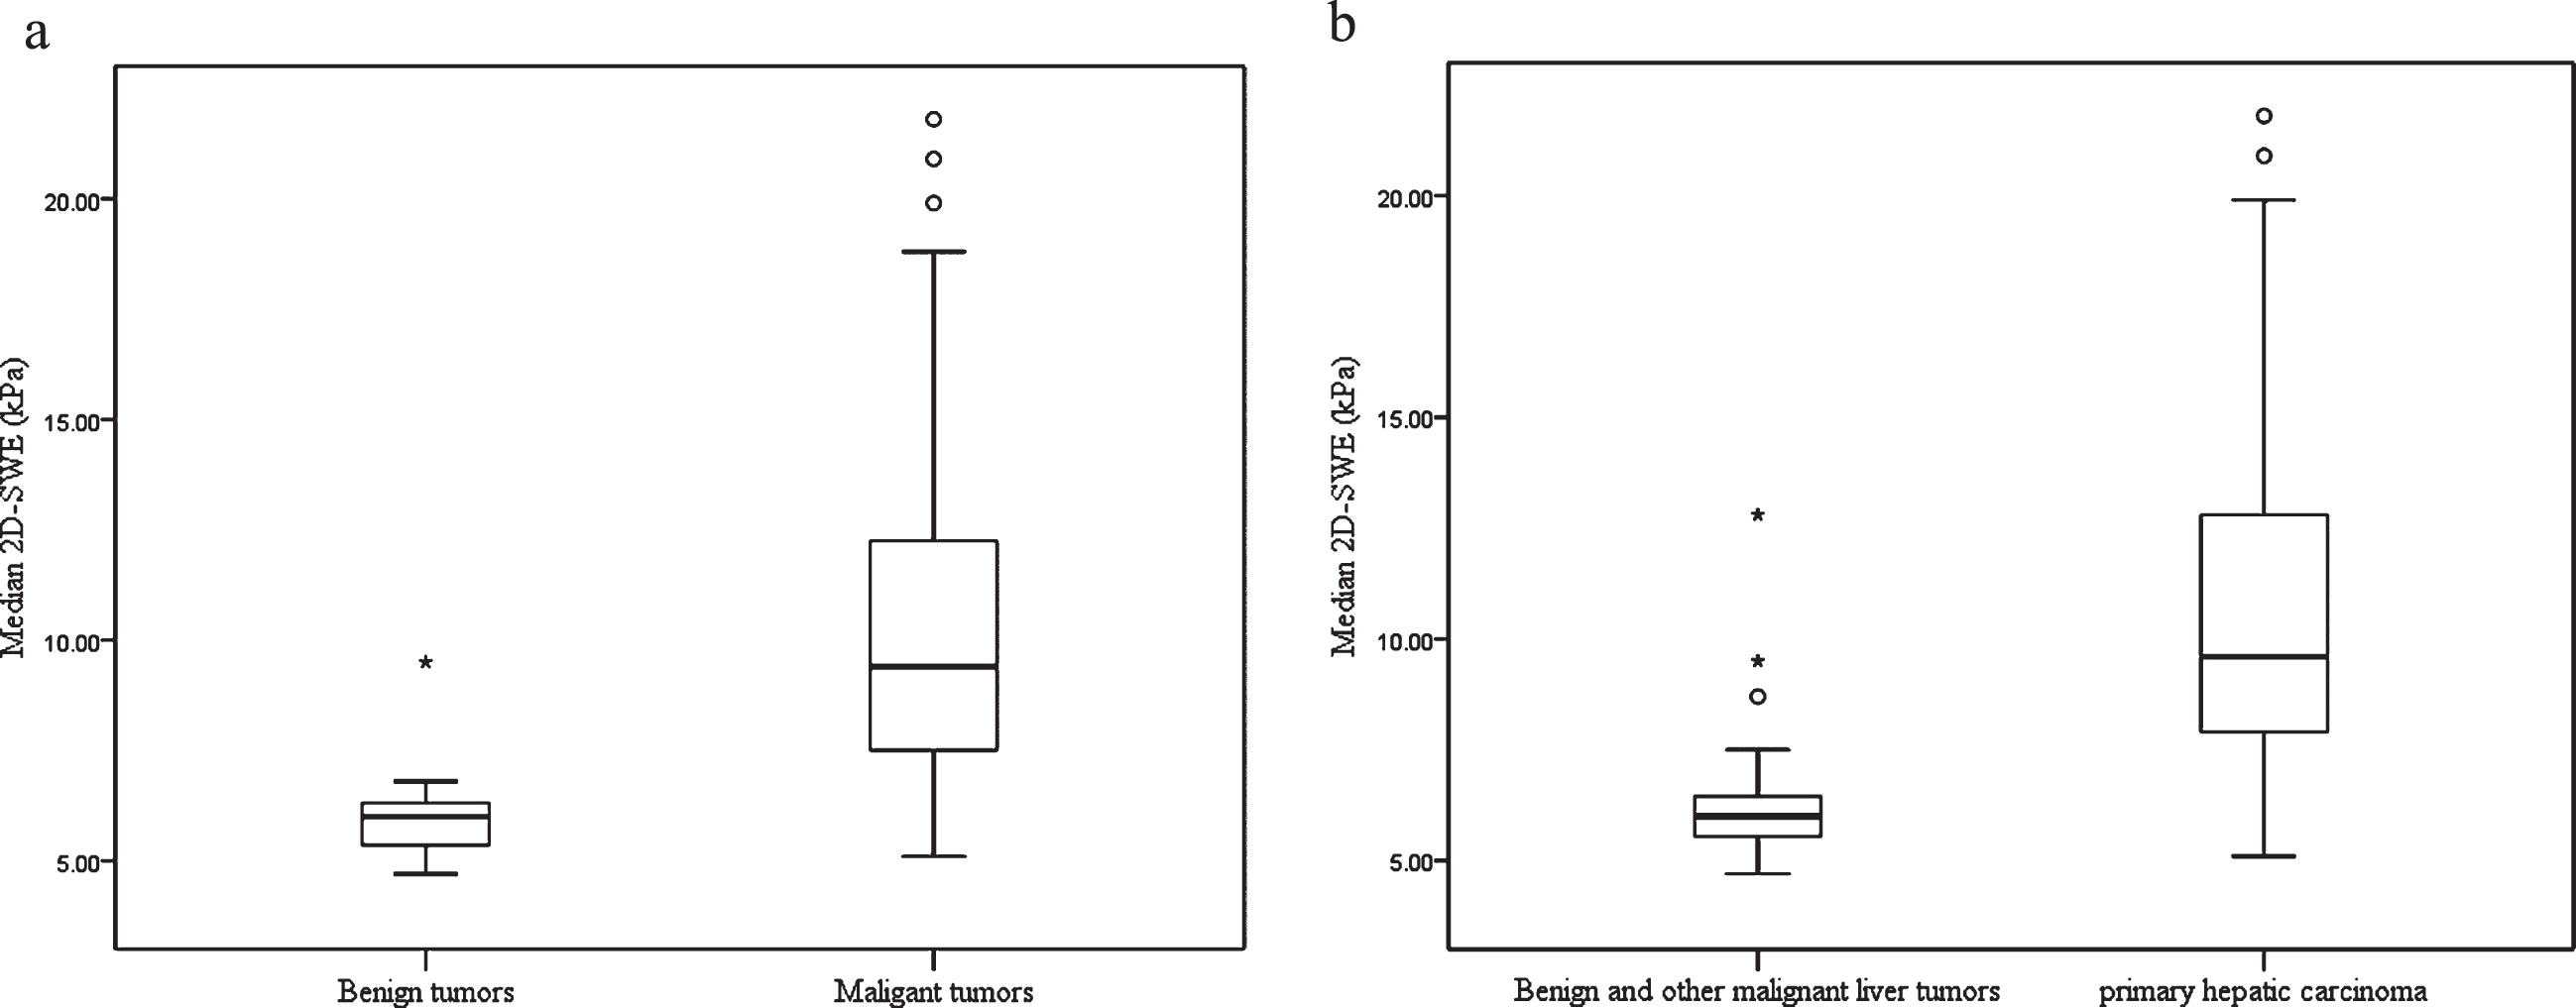
(a). Box plot of liver parenchyma SWE values of benign and malignant liver tumors. (b.) Box plot of SWE values of liver parenchyma of patients with primary liver cancer, benign and other malignant tumors. The top and bottom of the box are the 25th and 75th percentiles. The length of the box represents the interquartile range and the median (50th percentile) is the line drawn through the box.
Factors affecting liver stiffness are explained in Table 2. For the liver stiffness value, PLT, TB, ALB and fibrosis stage are significantly associated with liver stiffness measured by 2D-SWE with a propagation map on multivariate analysis (p < 0.05).
Factors affecting the liver stiffness value (kPa)
Factors affecting the liver stiffness value (kPa)
BMI = body mass index; FIB = fibrinogen; PLT = platelet; TB = total bilirubin; PT = prothrombin time; APTT = activated partial thromboplastin time; AST = aspartate aminotransferase; ALT = alanine aminotransferase; ALP = alkaline phosphatase; GGT = glutamyl transpeptidase; ALB = albumin; AFP = a-fetoprotein; AFP = a-fetoprotein; CEA = carcinoma embryonic antigen; CA19-9 = carbohydrate antigen19-9.
The median values with IQRs of liver stiffness in patients with liver tumors are summarized in Table 3 and Fig. 5. The values of liver stiffness were significantly different among the patients with different fibrosis stages (p < 0.001). The value of liver stiffness in S4 was higher than that in S3, S2, S1, and S0 (p = 0.00, 0.00, 0.001, and 0.00, respectively). The value of liver stiffness in S3 was higher than that in S2, S1, and S0 (p = 0.027, 0.001, and 0.00, respectively). No significant difference was found in value of liver stiffness between S2 and S1 (p = 0.276), but the value of liver stiffness in S2 was higher than that in S0 (p = 0.001). No significant difference was observed in the value of liver stiffness between S1 and S0 (p = 0.256).
Median values of liver stiffness according to fibrosis stage in all patients(kPa)
Median values of liver stiffness according to fibrosis stage in all patients(kPa)
IQR is presented within parentheses. IQR = interquartile range.
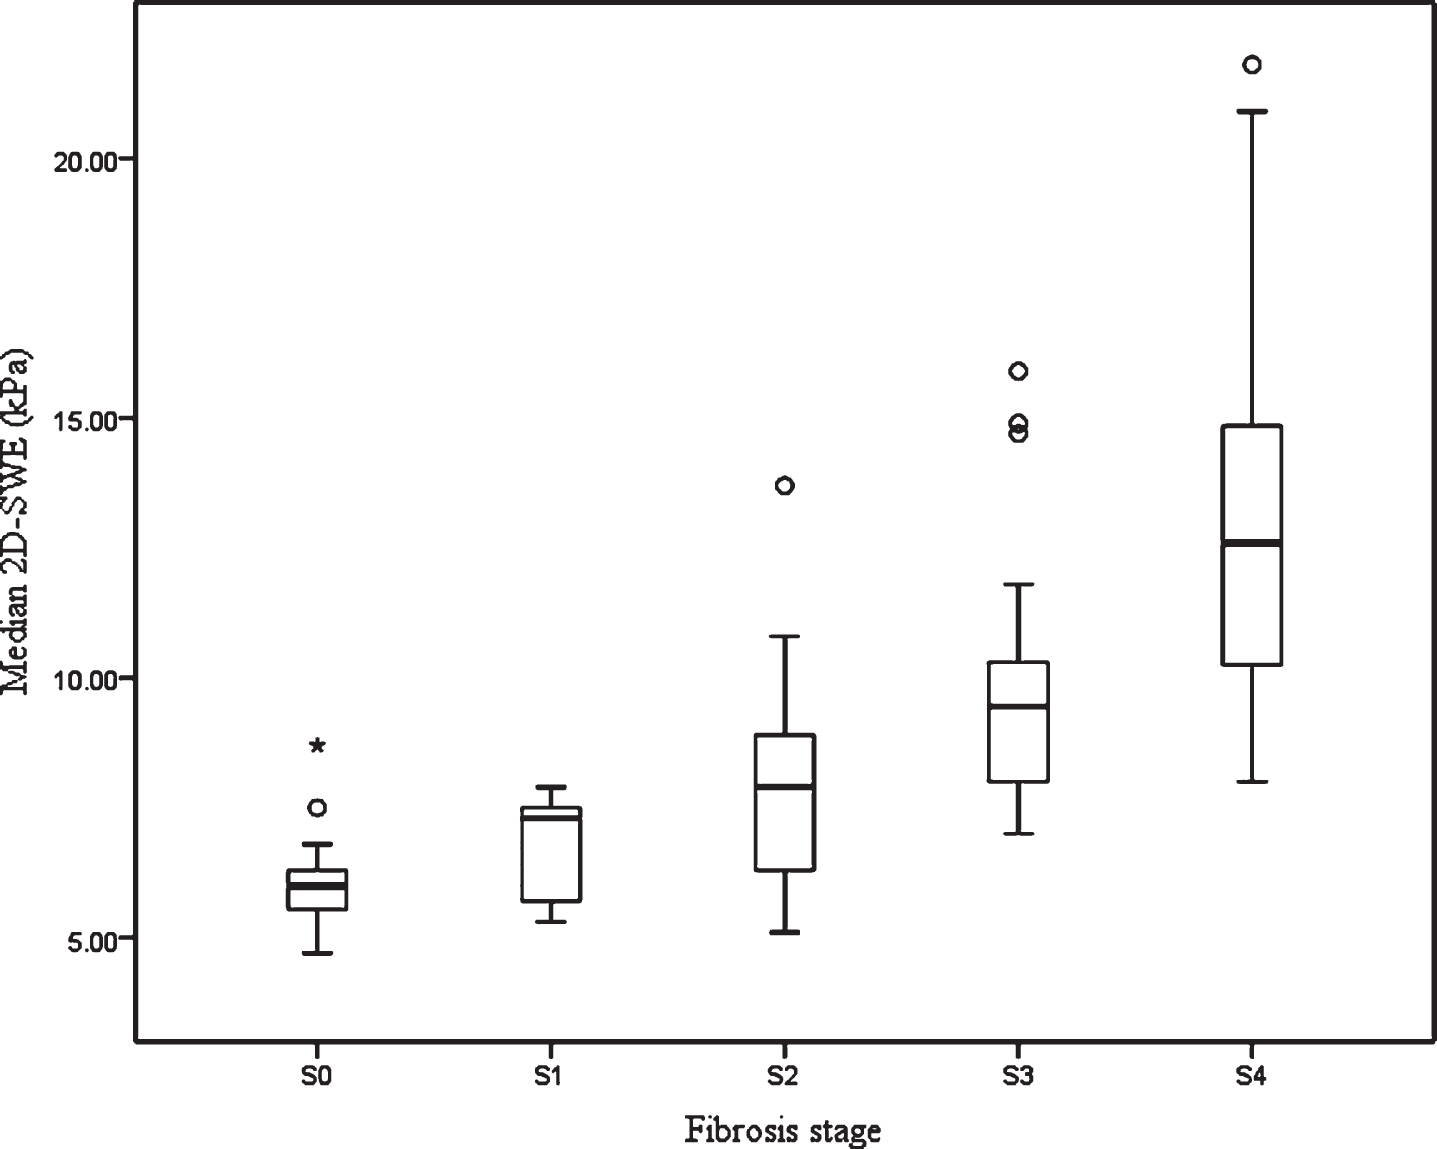
Box plot of SWE values for different stages of liver fibrosis.
There was a positive correlation between the value of liver stiffness and liver fibrosis stage (r = 0.834, p < 0.000).
The AUC and optimal cut-off values with the corresponding sensitivities, specificities, positive predictive values, negative predictive values, positive likelihood ratios, and negative likelihood ratios of the liver stiffness value are summarized in Table 4. The areas under the ROC curve for the SWE diagnosis of liver fibrosis stages S≥1, S≥2, S≥3, and S = 4 were 0.932, 0.932, 0.945, and 0.916, respectively (Fig. 4), and the corresponding optimal diagnostic cutoff values were 6.8, 7.5, 8.3, and 9.8 kPa, respectively.
Diagnostic performance of 2D-SWE with a propagation map
Diagnostic performance of 2D-SWE with a propagation map
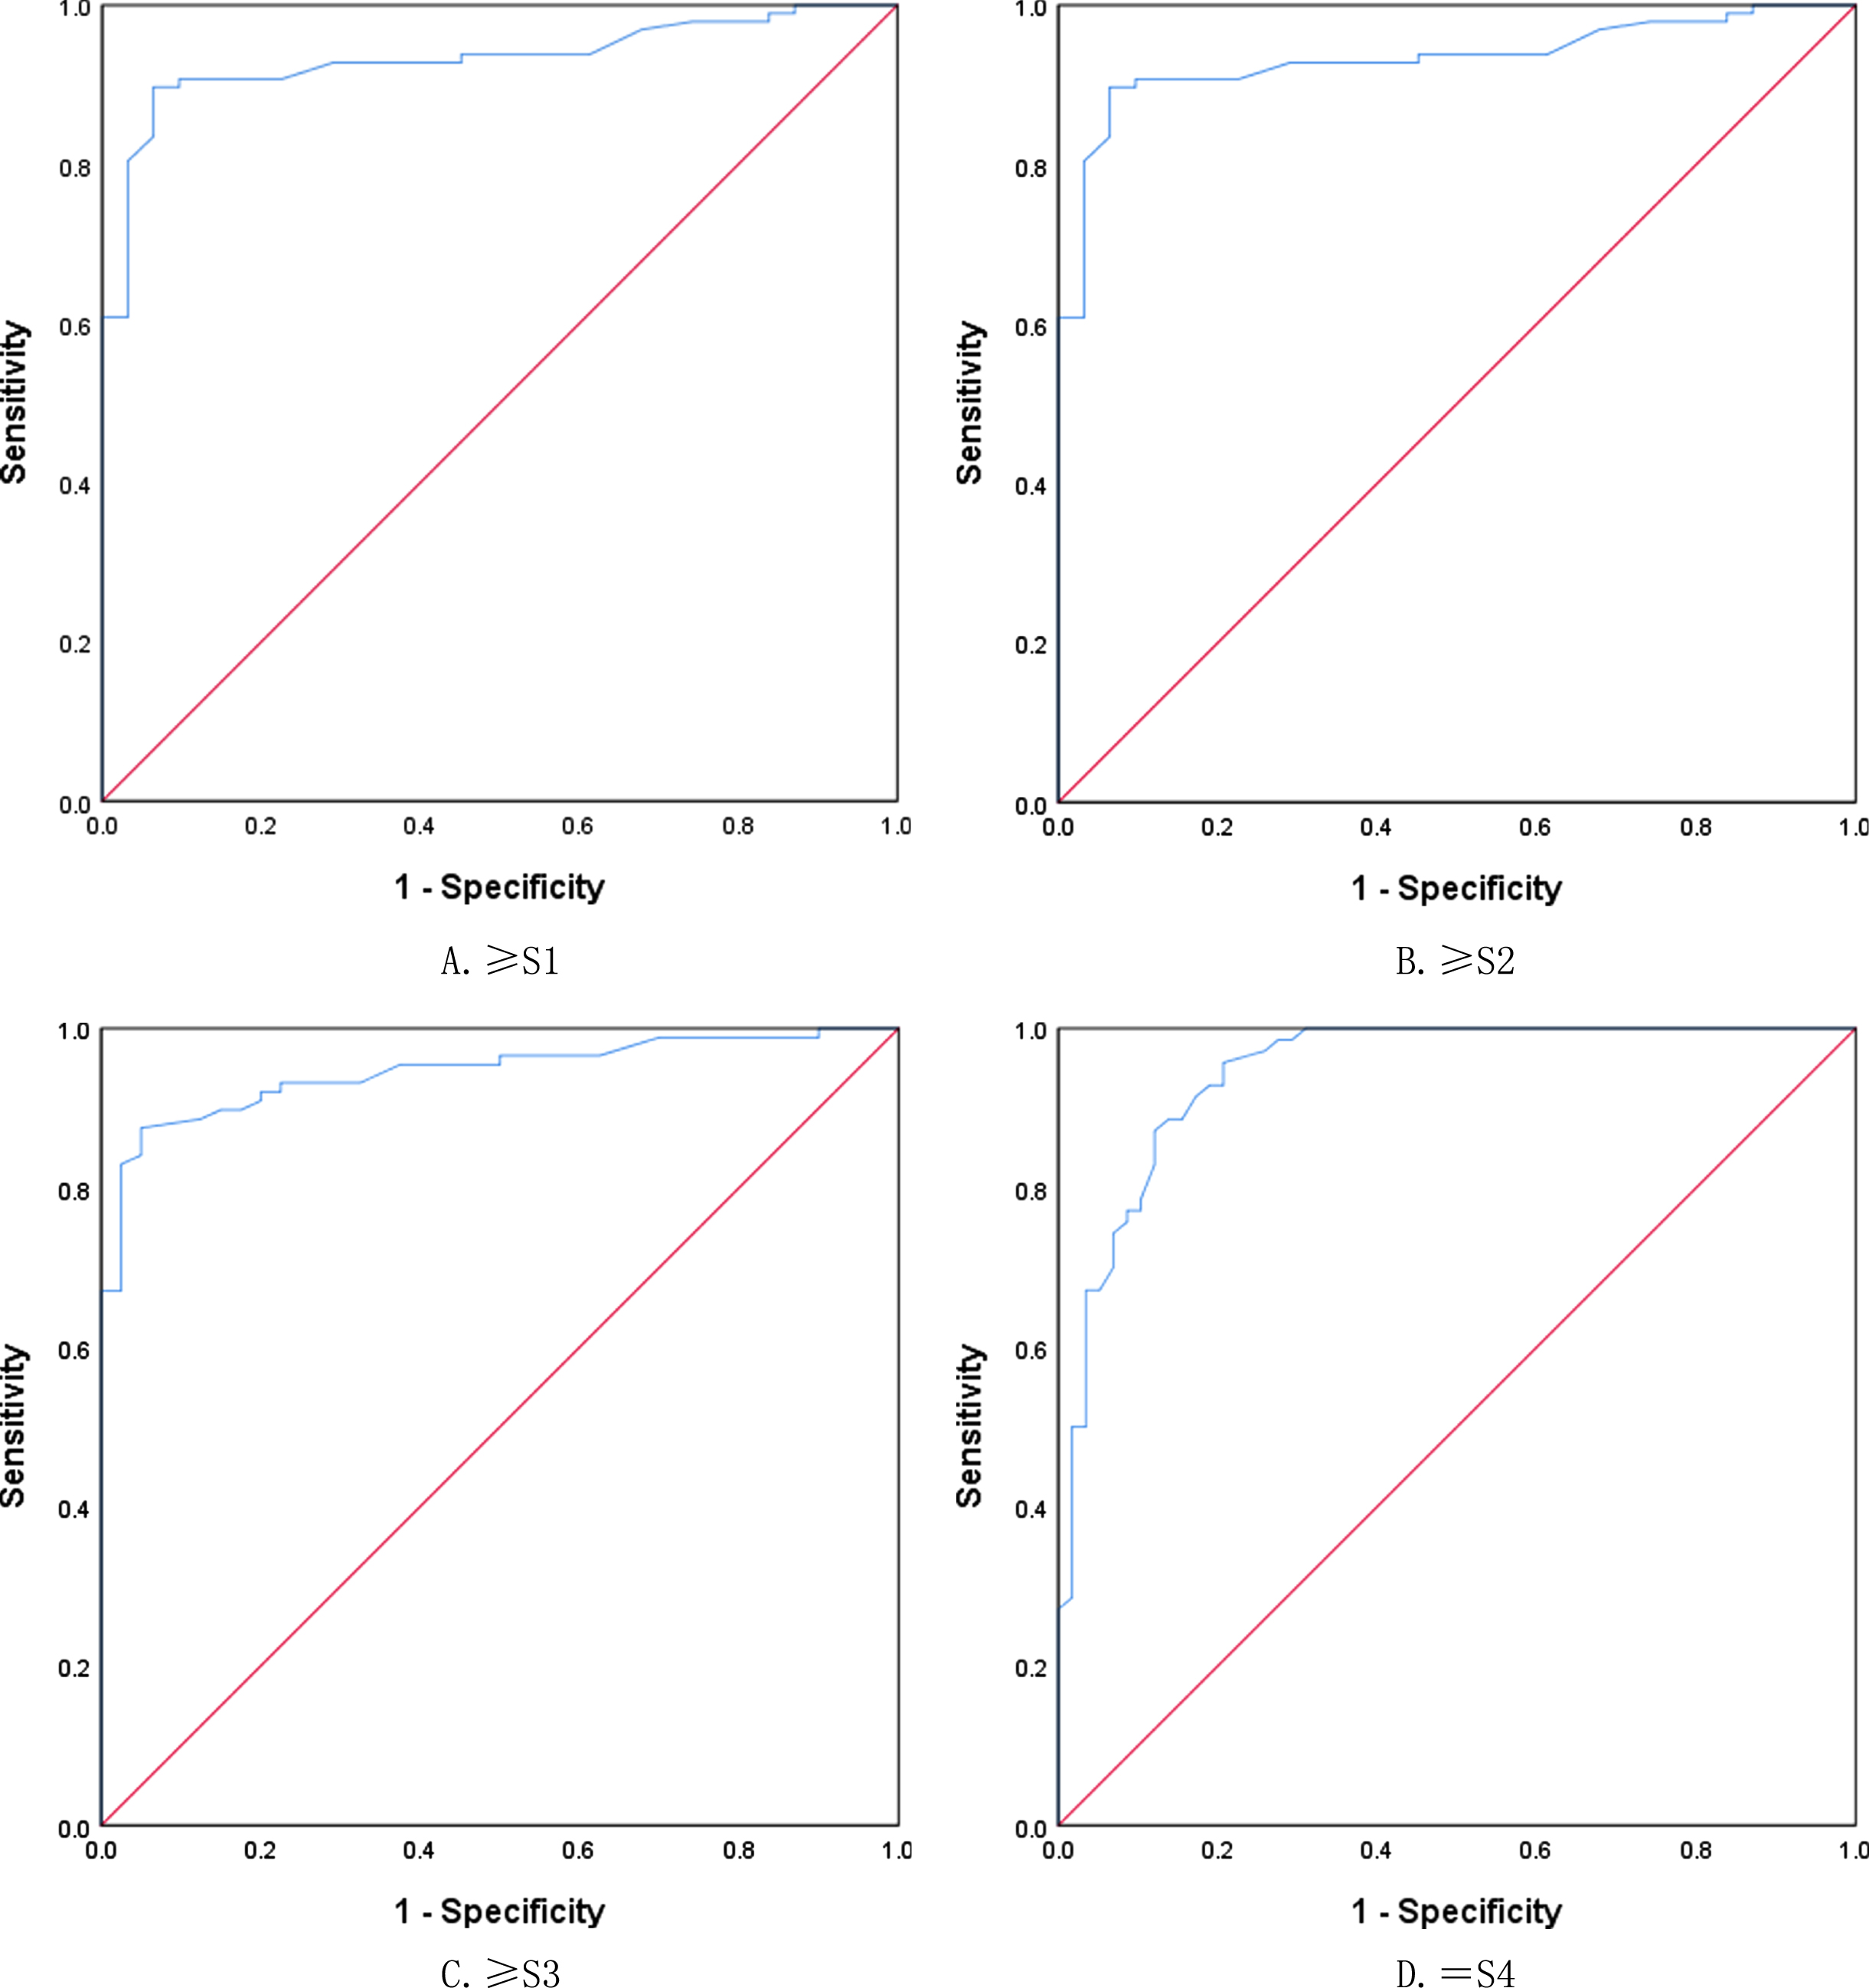
ROC curves of SWE for differentiation of liver fibrosis stage. A. S0 vs. S1–S4. B. S0–S1 vs. S2–S4. C. S0–S2 vs. S3–S4. D. S0–S3 vs. S4.
Some studies have shown that ultrasound elastography could reflect the degree of liver fibrosis and liver reserve function by measuring the elastic modulus of liver parenchyma [11]. Ultrasound elastography of liver parenchyma stiffness has always been a hot topic in liver disease research. The commonly used types of ultrasound elastography include FibroScan, acoustic pulse radiation force imaging, and SWE technology [16]. Shear wave elastography is believed to reflect the liver stiffness in patients with chronic liver disease [12, 18]. The liver stiffness measured by SWE is positively correlated with the liver fibrosis stage, it could provide information about liver anatomy and liver tissue stiffness at the same time, which has high repeatability and is less affected by operator experience [19]. The SWE technology in our study increases the shear wave propagation map in image quality control, thus further improving the reliability and clinical practicability of shear wave imaging. In the present prospective study, the success rate of 2D-SWE with a propagation map examination in patients with liver tumors was 92.70%.
In the study cohort, most of the liver tissues of patients with HCC had the background of liver fibrosis or cirrhosis, and most of the benign liver tumors and liver metastases occurred in normal liver tissues. In China, most patients with chronic hepatitis are infected with hepatitis B virus, which causes liver fibrosis and then leads to the occurrence of HCC. In the present study, the median liver stiffness in patients with benign liver tumors was lower than that in patients with malignant liver tumors (6.0 vs. 9.4 kPa). The difference was statistically significant. Considering that most cases with malignant tumors were HCC, and most patients with liver fibrosis or cirrhosis background led to increased liver stiffness. In addition, the median value of liver stiffness in patients with primary liver cancer was higher than that in benign liver tumors, liver metastases, and other rare types of liver malignancies (6.0 vs. 9.6 kPa). Our results were similar to the previous research results of Huang et al. [20]. However, the values in the present study were lower than their findings, thought to be related to the different composition of cases in the two studies.
The stiffness of liver measured by SWE was correlated with the pathological stage of liver parenchyma [21]. We also found a good correlation between the stiffness of liver and the liver fibrosis stage in patients with liver tumors, and the correlation coefficient was 0.843. Liver stiffness values increased in line with degree of liver fibrosis. Zeng et al. [22] used SWE technology to assess the stage of liver fibrosis in patients with chronic hepatitis B, the median values of liver stiffness with fibrosis stages S0–S4 were 5.7, 6.3, 8.2, 11.3, and 18.4 kPa, respectively. The difference may be due to differences in the total number of cases and the percentage of hepatitis B infections. In addition, our study results showed no significant statistical difference in the median value of liver stiffness between S2 and S1, considering that the possible reason is related to the small number of patients in S1 and S2, the sample size must be further expanded for comparison.
The pathological results of liver tissue around liver tumor resection specimens were used as the reference standard. The ROC curves showed that the areas under the curve of S≥1, S≥2, S≥3, and S = 4 predicted by SWE were 0.932, 0.945, 0.945 and 0.916, respectively. The results showed that SWE could better evaluate the degree of liver fibrosis in patients with liver tumor. Huang et al. [20] also took the pathological results of liver tissues around liver tumors as the reference standard, and no normal liver parenchymal pathological results were found. In the present study, the areas under the ROC curve for SWE diagnosis of substantial fibrosis, severe fibrosis, and cirrhosis were 0.835, 0.926, and 0.881, respectively. The differences between the two studies are considered to be related to the different number and composition of cases. Lee et al. [23] found that liver stiffness value obtained from 2D-SWE with a propagation map provides reliable and accurate diagnostic performance in predicting liver fibrosis stage using histopathology as a reference standard. Giovanna et al. [24] found that the area under the receiver operating characteristics of shear wave elastography with a with a propagation map for predicting significant fibrosis (F≥2) and severe fibrosis (F≥3), were 0.97 and 0.97, respectively, this technique is accurate for predicting liver fibrosis using transient elastography as a reference standard. Our result was lower than their results, different etiologies of chronic liver disease and sample size may be contributed to these differences.
Previous studies showed that liver elastography is affected by many factors, such as liver location, history of hepatitis, and degree of liver fibrosis [25]. Some studies found that liver stiffness measured by 2-D-SWE may be influenced by inflammation and GGT, ALT, AST and serum ALP levels [26].Some study found that fibrosis stage necroinflammatory activity, age, ALT, and PLT were associated with the liver stiffness, but the fibrosis stage was the only significant factor determining the liver stiffness [23]. Regarding the significant affecting factors, we found PLT, TB, ALB and fibrosis stage are significantly associated with liver stiffness according to the multivariate analysis. Our result was in discontent with the previous results. The different patients studied may contribute to this discrepence. Patients who enrolled in our study were planned to undergo operation and their serological indicators of inflammation were mostly normal. Previous study found that steatosis was thought as independent predictors of 2D-SWE inaccuracy [27]. In the present study, we did not assess the effect of steatosis on our results, considering that the number of patients with hepatic steatosis was small, which may be resulting in uneven distribution, and lead to deviation of statistical results. So, how to lessen the effects of confounding factors is important in clinical practice, further research is needed especially in liver fibrosis in patients with liver tumors. The pathology of peri-tumor liver tissue surgically resected from patients with liver tumor was used as the reference standard. Thus, the obtained liver parenchymal biopsy specimens were relatively sufficient, and the pathological reading error caused by insufficient liver tissue was reduced.
Limitations
This study has some limitations. First, all examinations were performed by one radiologist, thus, the interobserver and interobserver agreement of the liver stiffness could not be evaluated in this study. Therefore, to evaluate the reproducibility of the measurement, further studies are required. Second, the overall sample size is small, and patients with different fibrosis stages are unevenly distributed. Thus, the sample size must be further expanded. Third, the liver parenchyma samples obtained by surgery may be inconsistent with the interesting area of the preoperative elastic measurement, which may lead to a certain difference between the elastic modulus of liver parenchyma and the actual fibrosis stage. In addition, prospective studies with head-to-head comparisons with current elastography techniques need to be further studied in order to establish the clinical usefulness of 2D-SWE with propagation map in patients with liver tumors.
Conclusion
In addition, the results showed that 2D-SWE with a propagation map could accurately evaluate the fibrosis of liver parenchyma in patients with liver tumors and indirectly evaluate liver reserve function.
Conflicts of interest
The authors have no conflicts of interest to declare.
Funding
Supported by Shanghai Municipal Key Clinical Specialty (Grant No. shslczdzk 03501).
Supported by Shanghai Municipal Science and Technology Medical Guidance Project (Grant No. 18411967200); Shanghai Municipal Science and Technology Innovation Action Plan Clinical Medicine Project (Grant No. 17411954200); Shanghai Municipal Health and Family Planning Commission Research Project (Grant No. 201840215).