
Abstract
BACKGROUND:
Two-dimensional (2D) - shear wave elastography (SWE) has made promising advances in the diagnostic of breast lesions. However, few studies have assessed whether the diagnostic effectiveness of different platforms employing 2D-SWE is equal or different.
OBJECTIVE:
To compare the diagnostic effectiveness of 2D-SWE techniques from two different systems in differentiating malignant breast lesions from benign ones.
METHODS:
A total of 84 breast lesions were retrospectively analyzed by experienced radiologists using 2D-SWE on two ultrasound systems, i.e. system-1 (LOGIQ E9 system, GE Healthcare, Wauwatosa, WI, USA), and system-2 (Aixplorer US system, SuperSonic Imagine, Aix-en-Provence, France). Qualitative and quantitative parameters including color sign, the maximum elasticity modulus values (E-max), the mean elasticity modulus values (E-mean) and standard deviation (E-sd) of elasticity modulus values in two 2D-SWE systems were analyzed. The diagnostic performance between system-1 and system-2 were evaluated in terms of the areas under the receiver operating characteristic curves (AUROCs).
RESULTS:
Among the 84 lesions in this study, 66 (78.6%) were benign and 18 (21.4%) were malignant. E-max in system-1 showed the best diagnostic performance with a cut-off value of 174.5 kPa with the associated sensitivity and specificity of 100.0% and 80.3% respectively. Meanwhile, E-sd in system-2 displayed the best diagnostic performance with a cut-off value of 12.7 kPa, with the associated sensitivity and specificity of 94.4% and 80.3% respectively. The diagnostic performance of the two 2D-SWE systems was not statistically different according to receiver operating characteristic curve (ROC) analysis of E-max, E-mean, and E-sd.
CONCLUSION:
For identifying breast lesions, system-1 and system-2 appear to be similar in diagnostic performance. However, different cut-off values for different parameters might be selected to obtain the best diagnostic performance for the two 2D-SWE systems.
Introduction
Ultrasound elastography (UE), which provides non-invasive, qualitative and quantitative information of tissue stiffness, has made promising advances in the diagnosis and treatment assessment of breast lesions [1–6]. As a complement to conventional ultrasound (US), elastography plays an essential part in identifying benign and malignant breast masses. Combining elastography and conventional ultrasound has been shown to improve the specificity of breast cancer diagnosis by adjusting the Breast Imaging Reporting and Data System (BI-RADS) score of the breast lesions [7–10]. Furthermore, elastography has been shown to be useful in predicting the pathological features of breast cancer and assessing the successfulness of neoadjuvant chemotherapy, resulting in changes in clinical therapy regimens [4, 11–17].
Strain elastography (SE) and shear wave elastography (SWE) are the two primary types of elastography techniques currently employed for breast imaging. The operator manually compresses the breast tissue with an US transducer for SE, and then obtains an elasticity map of the tissue deformation. SWE is generated by acoustic radiation force and does not require any manual operation. The elasticity spectrum of a breast lesion can be determined by measuring the speed at which shear waves propagate within the lesion, which takes advantage of the fact that shear waves propagate more quickly in hard tissue than in soft tissue. The quantitative measurements of tissue elasticity are shown in Young’s modulus (kilopascals, kPa) or shear wave speed (metres per second, m/s). The Young’s modulus of the tissue is calculated from the shear wave speed (m/s) with the conversion formula E = 3ρCs2 (E is the Young’s modulus value; ρ is the tissue density; Cs is the shear wave speed). In comparison to SE, SWE is less operator dependent and more repeatable. Furthermore, 2D-SWE could provide not only a qualitative color sign map, but also quantitative tissue hardness information [18–22].
Currently, numerous US manufacturers are integrating 2D-SWE capabilities in their high-end models. However, different cut-off values were determined to distinguish benign from malignant breast lesions for different studies, which might be due to the fact that systems employed by different manufacturers were varied. The system utilized in several multi-center studies evaluating the diagnostic performance of 2D-SWE for breast lesions is Aixplorer US system (SuperSonic Imagine, Aix-en-Provence, France) [10]. There are relatively few studies on LOGIQ E9 system (GE Healthcare, Wauwatosa, WI, USA) in clinical practice. Until this study, to the best of our knowledge, few studies have assessed whether the diagnostic effectiveness of different platforms employing SWE is equal or different [23, 24]. This is of critical importance since otherwise it is difficult to develop a recognized cut-off value to help assess the level of suspicion of the breast lesions.
The purpose of this study was to compare two different 2D-SWE platforms to see if their diagnostic ability in terms of differentiating breast lesions differed.
Materials and methods
Patients
The Ethical Committee of Shanghai Tenth People’s Hospital approved this retrospective study, which was conducted in accordance with the Declaration of Helsinki for human study (SHSY-IEC-4.1/19-205/01). From January 2017 to March 2017, 104 consecutive patients with suspicious breast lesions (BI-RADS category 3–5 lesions) underwent B-mode US and 2D-SWE on two US devices. The inclusion criteria were as following: (a) breast lesions detected by US; (b) no previous treatment to the lesion; (c) solid breast lesions or approximate solid lesions (solid part > 75.0%). If several lesions were present in one patient, the lesion with the highest US (BI-RADS) category or the largest one was chosen. Pathological examination was obtained by core biopsy. Biopsy results that showed breast cancer were subject to surgical excision or neoadjuvant therapy. Lesions stable or decreased at 2-year follow-up US without biopsy were considered to be benign.
Among these 104 patients, 20 patients were excluded with incomplete data. Finally, a total of 84 breast lesions (66 benign, 18 malignant) in 84 patients (average age 43.6±14.9 years; range 18–74 years) were retrospectively selected and were analyzed in this study.
B-mode US and 2D-SWE Examination
One operator with more than two years of expertise performed B-mode US and 2D-SWE. The radiologist was unaware of the patient’s histological and clinical data. The patient was firstly subject to 2D-SWE examination with a LOGIQ E9 system (system 1; GE Healthcare, Wauwatosa, WI, USA) equipped with a 14L5 liner array transducer. A supine position was requested of the patient. The operator is guided by conventional B-mode US images to localize the breast lesion and obtain the transverse and longitudinal images of the lesion. The probe is then placed as gently as possible against the surface of the breast to avoid elastic artefacts caused by improper compression. The patient was required to stop breathing for a few moments to minimize respiratory movements in order to obtain stable 2D-SWE images. To ensure the reliability of the 2D-SWE, the region of interest (ROI) box was placed on the image in such a way as to avoid calcifications, obvious cystic sections or tissue around the breast lesion and other distortion factors. To determine the mean, maximum, and standard deviation of the lesion’s stiffness in m/s and kPa, ROI was adjusted to the contour of the lesion to contain the maximum lesion region.
Afterwards, the patient was subject to another 2D-SWE examination with the Aixplorer US system (system 2; SuperSonic Imagine, Aix-en-Provence, France) and the system-2 was conducted by the same operator. As mentioned in system-1, the operator found the lesion in B-mode US and then switched to elastic mode. The probe is placed steadily on the breast. Depending on the stiffness value of the tissue, the 2D-SWE appears with a colour map (red for stiff, blue for soft). The Q-box (ROI) are laid out in the same way as the system-1, encompassing the lesion in its entirety, and the elasticity values of the tissue, including E-max, E-mean and E-sd, are obtained simultaneously through a single sampling box. Some breast tissues show black elastic colour profiles, indicating that shear waves cannot penetrate the tissues. For these breast tissues, we placed the ROI at the hardest region of its edge to represent its stiffness value.
Image evaluation
The 2D-SWE images were reviewed by two radiologists who have 2 years experience in 2D-SWE. In case of discrepancies, consensus was obtained by consulting with a third supervising radiologist. The qualitative 2D-SWE features (color map) created on the LOGIQ E9 and the Aixplorer US system were evaluated using the different scoring criteria. In the 2D-SWE images from both systems, the stiffness of the tissue is coded as a colour map, where the soft tissues are coded in blue, with the colour gradually coded green, orange and red as the stiffness increases. For system-1, a modified 4-point scale was used to evaluate the colour profile according to the proportion of different colors in the area of interest. Modified 4-point scale is as follows: 1 point, areas of interest are all filled with blue or green, indicating a benign lesion; 2 point, 75.0% or more of the area of interest is coded in blue or green with some orange, indicating a benign lesion; 3 point, the presence of uncoded and red-coded areas in the area of interest is greater than 20.0%, indicating a malignancy lesion. 4 point, the presence of uncoded and red-coded areas in the area of interest is greater than 40.0%, indicating a malignancy lesion (Fig. 1). The color profile of system-2 was evaluated adopting a two-point scale predicated on the stiff rim sign, which was identified as a stiffness value (coded orange or red) at the lesion’s periphery that is much higher than the surrounding healthy breast tissue and the interior of the lesion [25]. Score 0 was assigned when the stiff rim sign did not appear; score 1 was assigned to lesions with the stiff rim sign. Score 0 indicates a benign lesion (Fig. 2); whereas score 1 indicates malignancy. The quantitative parameters of SWE are displayed directly on the exported elastic image.

Grade 2 invasive ductal carcinoma in a 37-year-old woman. (A) system-2 measurement shows the stiff rim sign. (B) system-1 measurement shows the lesion is assigned to point 4 according to the modified 4-point scale.
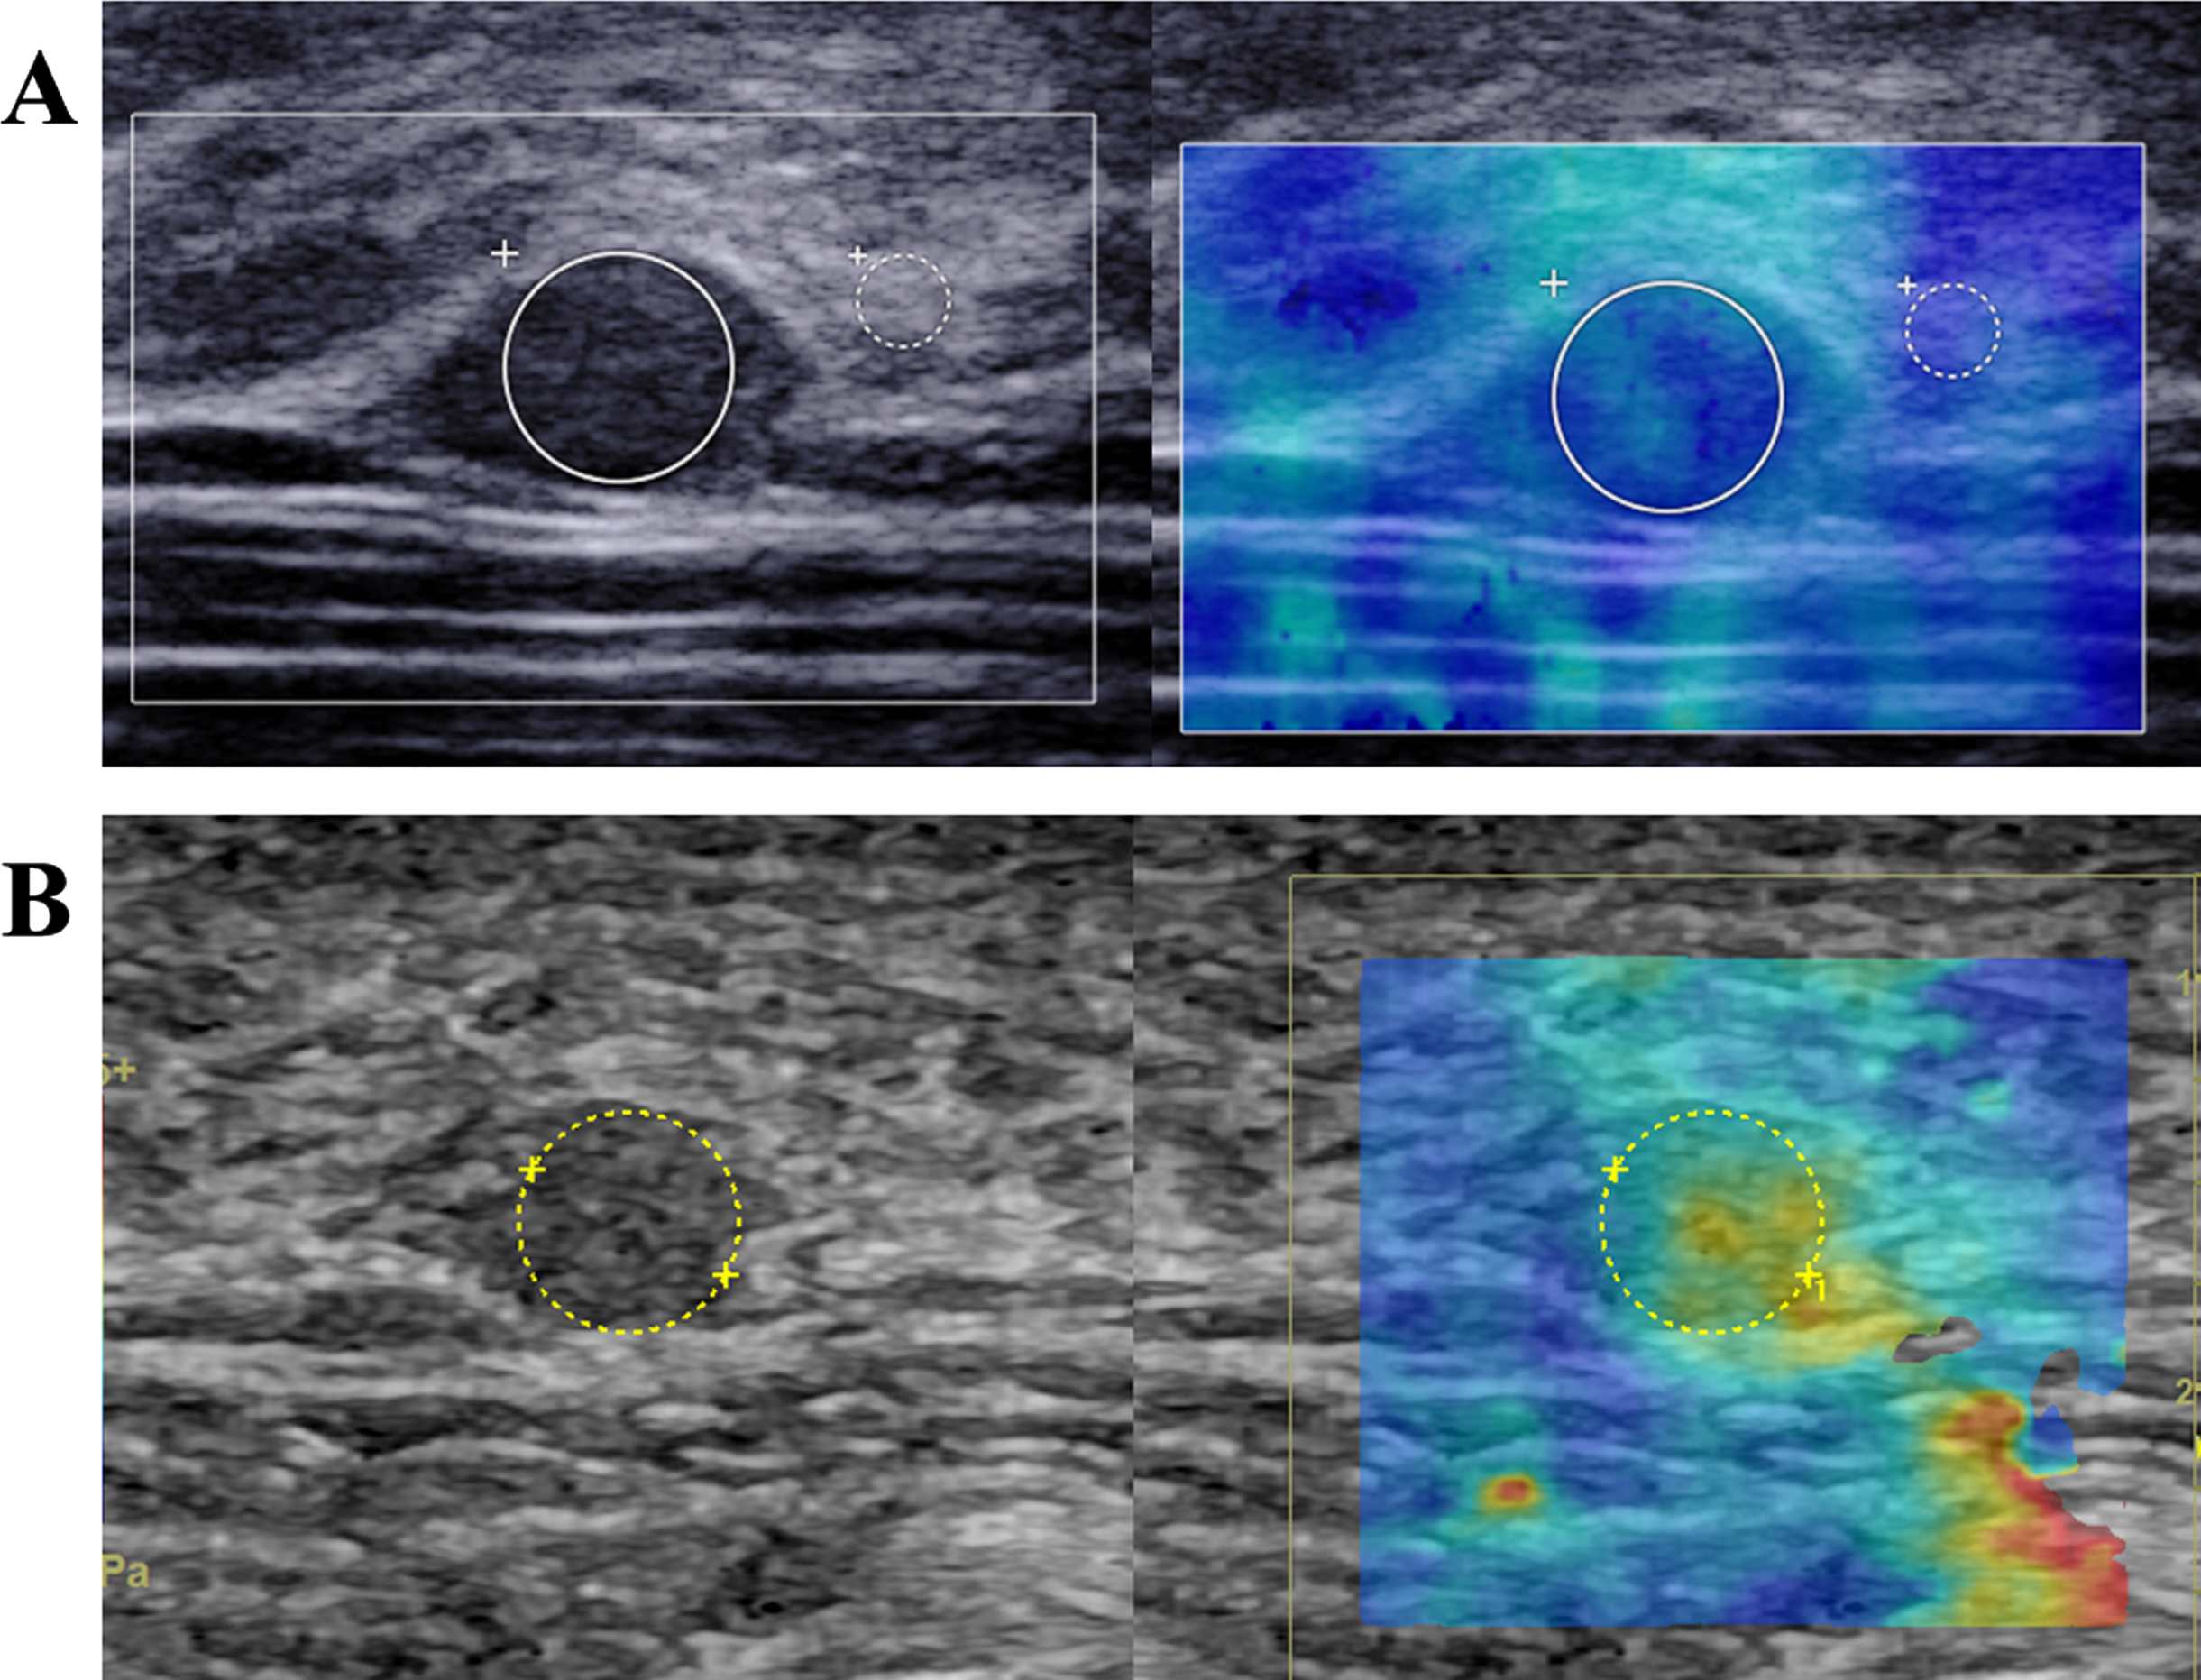
Breast adenosis in a 18-year-old female patient. (A) system-2 measurement shows absence of the stiff rim sign. (B) system-1 measurement shows the lesion is assigned to point 2 according to the modified 4-point scale.
GraphPad Prism (version 8.0.0, GraphPad Software, San Diego, California USA) and SPSS (version 20.0, SPSS Software, Chicago, Illinois USA) were employed to conduct all statistical analyses. The mean standard deviation was employed for normally distributed continuous data, medians and quartiles (P25, P75) was utilized to present skewed distribution data, and for categorical data, the χ2 test or Fisher’s exact probability test was used. Data were considered statistically significant when the calculated result was P < 0.05. Wilcoxon rank sum test was employed for comparison of 2D-SWE values between benign and malignant breast lesions. The area under the receiver operating characteristic curve (AUROC) was used to evaluate the diagnostic performance of all 2D-SWE parameters using histological diagnosis as the reference standard. The Uden index was applied to measure the optimum cut-off value. The McNemar test was conducted to compare the sensitivity, specificity, accuracy, positive predictive value (PPV), and negative predictive value (NPV) of the various parameters.
Results
Basic characteristics
There were 84 lesions in this study, 66 (78.6%) of which were benign and the remaining 18 (21.4%) were malignant. All lesions were pathologically confirmed and the specific histological results are displayed in Table 1. The 84 lesions had a mean diameter of 17.1±9.7 mm (range 5.6 mm–67.0 mm), with the malignant lesions having a mean diameter of 16.4±9.9 mm (range 5.6 mm–67.0 mm) and the benign lesions having a mean diameter of 19.2±8.7 mm (range 7.0–32.0 mm). In terms of lesion size, there were no significant differences.
Pathologic diagnosis of 84 breast lesions
Pathologic diagnosis of 84 breast lesions
Both 2D-SWE systems were able to provide quantitative hardness parameters at the lesion site. Notably higher E-max, E-mean and E-sd could be found for malignant lesions (P < 0.05) in the two 2D-SWE systems (Table 2). In the ROC analysis, the diagnostic performance was assessed using quantitative parameters. We found that E-max in system-1 showed the best diagnostic performance with a cut-off value of 174.5 kPa, a sensitivity of 100.0% and a specificity of 80.3%. Meanwhile, in the system-2, E-sd had the best diagnostic performance; its optimal cut-off value was 12.7 kPa, with a sensitivity and specificity of 94.4% and 80.3%, respectively. The diagnostic performance of the two 2D-SWE systems did not exhibit statistically significant differences in ROC analysis of the different parameters, including E-max, E-mean, and E-sd (Fig. 3). Table 3 summarizes the results of the ROC analysis, including sensitivity, specificity accuracy, PPV, and NPV.
SWE findings in benign and malignant breast lesions
SWE findings in benign and malignant breast lesions
*Indicates a significant difference. Data are shown as median, and quartile (p25, p75) are numbers in the parentheses; E-mean = the mean elasticity; E-max = the max elasticity; E-sd = standard deviation of elasticity; SWE= shear wave elastography.

ROC analysis of the different parameters, including E-max, E-mean and E-sd in two systems.
Comparisons of diagnostic performance for system-1 and system-2 parameters
PPV = Positive Predictive Value; NPV = Negative Predictive Value; AUROC = Area Under the Receiver Operating Characteristic.
Breast lesions with a score of 1 were categorized as malignant, while those with a score of 0 were classed as benign, according to system-2. There were 67 lesions with a value of 0 and 17 with a score of 1 (stiff rim sign). The group without stiff rim sign had 63 (94.0%) benign and 4 (6.0%) malignant lesions, while the stiff rim sign group had 14 (82.4%) malignant and 3 (17.6%) benign lesions. Compared with system-2, breast lesions with score of 1-2 were classified as benign whereas those with score of 3-4 were classified as malignant in system-1 qualitative analysis. 61 of the 84 lesions had a score of 1–2, while 23 received a score of 3–4. In the score 1-2 group, there were 57 (93.4%) benign and 4 (6.6%) malignant lesions, while the score 3-4 group had 14 (60.9%) malignant and 9 (39.1%) benign lesions. It is revealed that system-1 and system-2 had satisfactory diagnostic performance. The sensitivity of the stiff-rim sign was 77.8%, the specificity was 95.5%, the accuracy was 91.7%, the PPV was 82.4%, and the NPV was 94.0%. Meanwhile, 4-point scoring exhibited a sensitivity of 77.8%, a specificity of 86.4%, an accuracy of 84.5%, a PPV of 60.9%, and an NPV of 93.4%. (Table 4).
Comparisons of diagnostic performance for qualitative SWE parameters in system-1 and system-2
SWE = Shear Wave Elastography; PPV = Positive Predictive Value; NPV = Negative Predictive Value.
The 2015 World Federation of Ultrasound in Medicine and Biology (WFUMB) expert consensus concluded that by obtaining information on tissue stiffness, both SE and SWE can increase the specificity of breast cancer diagnosis [26]. Only qualitative or semi-quantitative data on tissue stiffness can be obtained with SE, on the other hand, 2D-SWE can collect quantitative shear wave data of the region, such as E-max, E-mean, and E-sd. Analyses on either of the two 2D-SWE systems employed in this study have demonstrated that they can be used in daily routine and provide promising diagnostic performance [25, 28]. Nevertheless, different systems with the same parameters exhibit different diagnostic performance and it can be a challenge for clinicians to choose the suitable parameters to diagnose breast lesions.
In this study, two different systems of 2D-SWE platforms were used to quantitatively assess breast lesions in the same patient. In both 2D-SWE systems, E-max, E-mean, and E-sd were considerably higher in malignant lesions than benign lesions, which was consistent with previous studies [29, 30]. Our results showed good diagnostic performance for E-mean, E-max and E-sd in system-2, corresponding to AUROCs of 0.84, 0.89 and 0.89, respectively. Liu et al. used meta-analysis on system-2 to obtain a wide range of optimal E-max cut-off values, between 50 kPa and 106 kPa, corresponding to AUROCs of 0.84 to 0.96 [10]. According to Lee et al., a cut-off value of 65.0 kPa for E-max in system-2 provided the optimal distinguishing performance for breast lesions, which was comparable to our cut-off value (67.6 kPa) [31]. In addition, our study showed that when the cut-off value of E-sd was 12.7 kPa and its diagnostic sensitivity and specificity were 94.4 % and 80.3% respectively, which was similar to that reported by Gweon et al. [32]. The varied diagnostic performance obtained from different studies may be due to the different size and placement of the ROI.
Little published data so far has focused on evaluating the breast lesions by system-1. In comparison to E-mean and E-sd in system-1, E-max had the optimum efficiency in distinguishing between benign and malignant breast lesions in this study. When cut-off value set at 174.5 kPa, its sensitivity, specificity, accuracy and AUROC were 100.0%, 80.3%, 84.5% and 0.89, respectively. The results were also in consistent with several other studies that E-max had better diagnostic performance than E-mean in SWE [33, 34]. Shi et al. found that E-max has a better correlation with the hardness of the lesion in comparison with E-mean on system-2 [35].
Our findings revealed no significant differences in diagnostic capabilities between system-1 and system-2. Nevertheless, the E-max cut-off values for system-1 are significantly higher than for system-2, presumably owing to inconsistence in shear wave excitation techniques and algorithms between the two systems. For the system-2, the shear wave is amplified into Mach cone shape to simultaneously increase the shear wave dissemination rage and minimize the acoustic power. Following that, a two-dimensional shear wave elastogram is calculated employing an ultrafast plane-wave imaging technique to trace the shear wave motion produced by the system-2 sequence. For system-1, shear waves are generated by arranging numerous unfocused ultrasonic beams in a comb pattern (comb pushing). The left-to-right (LR) and right-to-left (RL) propagating shear waves are separated utilizing a directional filter applied to the shear wave field. Local shear wave velocities are calculated using a time-of-flight approach based on the LR and RL waves. Finally, integrating the velocity maps of LR and RL, a two-dimensional shear-wave elastogram is generated [36]. System-1 is able to fill the entire field-of-view (FOV) with shear waves without any “blind areas”, the true maximum value of the hardness of the breast lesion can be measured. On the other hand, for some hard breast lesions, the shear waves generated by system-2 is unable to penetrate it, resulting in a true maximum value being missing. Therefore, the E-max cut-off values for system-1 are significantly higher than for system-2.
Some malignant breast lesions (intraductal papillary carcinoma, lobular carcinomas or intracystic carcinomas) with soft tissue changes may appear soft on SWE, which may cause false-negative results. In these cases, it is important to observe the tissue surrounding the lesion to identify the most rigid part of the lesion. The increased value of shear wave speed is relevant information that will help characterize the lesion as malignant [26, 37]. In addition, some studies have showed that smaller size (< 10 mm), larger breast thickness and depth may lead to false-negative results. It has been reported that contrast-enhanced ultrasound (CEUS) could improve the diagnostic performance of small tumors [38, 39]. Xiang et al. showed that the combined diagnosis of SWE and CEUS showed significant improved performance in comparison with SWE alone or CEUS alone [40]. Therefore, for some malignant tumors with soft tissue changes and small sized breast lesions, CEUS can help distinguish benign lesions from malignant ones.
Our study had several limitations. First, the intra-operator and inter-operator consistency of two systems were not assessed in our study. Second, despite the fact that 2D-SWE was acquired by the same experienced operator and 2D-SWE was demonstrated to be excellently reproducible, some selection bias was inevitable, such as the ROI placement. Third, this study was a single-center retrospective study with a limited sample size, and the validation of the results in this study need larger prospective studies in the future.
In conclusion, this study suggests that there is no significant difference in the diagnostic performance of the two 2D-SWE systems with differential shear wave elastography capabilities. However, different cut-off values for different parameters might be selected to obtain the best diagnostic performance for the two 2D-SWE systems.
Footnotes
Acknowledgments
This work was supported in part by the Science and Technology Commission of Shanghai Municipality (Grants 19441903200 and 19DZ2251100), Shanghai Municipal Health Commission (Grants 2019LJ21 and SHSLCZDZK03502) and Shanghai Sailing Program (Grants 22YF1433700).