



Abstract
The vascular structure and function are potentially useful biomarkers for tumor detection. Treatment with chemotherapeutic agents may impair vascular function and increase the risk of cardiovascular disease. This study aimed to use noninvasive pulse waveform measurements to identify differences in the frequency-domain indices of the pulse waveform in breast-cancer patients following anthracycline chemotherapy between with (Group KSY) and without (Group NKSY) receiving Kuan-Sin-Yin (KSY) treatment.
Radial blood pressure waveform (BPW) signals were measured noninvasively for 3 minutes in 31 patients, and the FACT-G, BFI-T, and EORTC QLQ-C30 questionnaires were administered. The following pulse indices were calculated for 10 harmonics: the amplitude proportion and its coefficient of variation, and the phase angle and its standard deviation.
The changes in spectral BPW indices were more prominent in Group NKSY than in Group KSY, especially for the decreases in BPW variability indices. Scores on the FACT-G, BFI-T, and EORTC QLQ-C30 questionnaires suggested that the quality of life following chemotherapy was better in Group KSY.
The identified decreases in pulse variability indices could be related to the greater impairment of regulatory activities in Group NKSY. The present findings may be meaningful in developing techniques with advantages such as being noninvasive and time-saving to evaluate the blood supply and physiological conditions following chemotherapy or other treatment strategies in cancer patients.
Introduction
Cancer exerts financial burdens and health impacts on both affected patients and the healthcare system as a whole [1, 2]; for example, breast cancer (BC) is the largest contributor to cancer-related deaths among females worldwide [3]. Monitoring the physiological condition of cancer patients can help to decrease the mortality rate and burden of cancer, and improve the quality of life [2, 4]. The increasing number of cancer cases is increasing the importance of effective monitoring methods and novel treatment modalities. Such tests should be user-friendly, widely available, and sufficiently sensitive with high specificity [1, 5].
The survival time and prognosis of cancer patients are strongly associated with the condition of the systemic circulation [6], since cancer tissue has been suggested to share several risk factors with cardiovascular disease (CVD). The microvasculature that develops to support tumor growth differs markedly from existing healthy vessels, and hence both the vascular structure and function are potentially useful biomarkers for tumor detection [7].
Blood flow is a driver of tumor tissue metabolism and oxygenation and may therefore affect the efficacy of cancer therapies [8]. Imaging methods such as PET, MRI and Doppler ultrasound have been widely used to monitor the blood flow response; these methods play important roles in cancer management, including for screening, diagnosis, and disease staging [9, 10]. Microvascular blood flow contrast been suggested to improve BC detection and therapy monitoring [8]. Circulating isolated tumor cells that disseminate from the cancer site and are identified and measured in the peripheral blood have established prognostic and predictive value in oncology [11–14]. Cancer-associated thrombosis and acute anemia have been revealed in BC-bearing mice, and high platelet counts are reportedly associated with progression and a poor prognosis in cancer [6]. The occurrence of thromboembolism and decreases in local blood perfusion has been found to be associated with an increased mortality risk and a poor prognosis in cancer patients [6, 15]. Doxorubicin treatment was demonstrated to significantly increase the mean corpuscular hemoglobin level and the red-blood-cell distribution width [6].
Vessel properties can also change during cancer progression, with negative arterial remodeling (reflected by changes in aortic stiffness and decreased distensibility) being linked to increases in cardiovascular events [16]. This illustrates that measuring and analyzing the pulse waveform to monitor the arterial pulse transmission condition may be useful for evaluating the effects of cancer tissues on the cardiovascular system. Furthermore, the arterial pulse waveform can be easily measured noninvasively, and hence it has potential in developing a rapid, inexpensive, and objective method for evaluating cancer-induced vascular responses. For example, the pulse-wave velocity is known to be a time-domain indicator of arterial stiffness and a marker of vascular damage, and has been found to be potentially useful for predicting the risk of adenoma [17]. Frequency-domain analyses of the pulse waveform have revealed significant differences in pulse-waveform indices between cancer patients (colorectal cancer and BC) and control subjects. The underlying mechanisms might include the arterial pulse-wave transmission condition and its regulatory activities induced in cancer patients [18–20].
While chemotherapy is a highly effective type of cancer treatment, it can have severe cardiovascular side effects [21, 22]. Cardiotoxic anticancer drugs such as doxorubicin (a widely used broad-spectrum anticancer agent that is frequently used in BC) can cause morphological damage to the myocardium and affect cardiovascular function [23]. Impaired vascular function and increased risk of CVD development have been found in adults treated with chemotherapeutic agents [21].
The traditional-Chinese-medicine decoction Kuan-Sin-Yin (KSY) is used to suppress tumor growth and improve the quality of life of cancer patients [24, 25]. Laser-Doppler flowmetry (LDF) measurements and analyses can be used to monitor the blood-flow responses in BC patients induced by KSY treatment, which was also found to improve cancer-related symptoms as monitored using questionnaires [18].
The blood-flow perfusion condition can be affected by changes in arterial elasticity and hence the pulse waveform. The present study aimed to use noninvasive pulse waveform measurements to identify differences in the frequency-domain indices of the pulse waveform between BC subjects following anthracycline chemotherapy with (Group KSY) and without (Group NKSY) receiving KSY treatment. The self-reported quality of life and cancer-related symptoms were also investigated. The present findings represent an important step toward verifying if noninvasive pulse waveform measurements can be useful for monitoring the physiological effects of BC therapies.
Methods
Details of the present experimental setup and the signal processing methods are available elsewhere [18–20]. Blood pressure waveform (BPW) signals were measured noninvasively in the subjects (typical waveforms are shown in Fig. 1). Frequency-domain analysis was used to derive 4 pulse indices from the BPW signal for each of 10 harmonics (i.e., n = 1–10): amplitude proportion (C n ), coefficient of variation of C n (CV n ), phase angle (P n ), and standard deviation of P n (P n _SD).
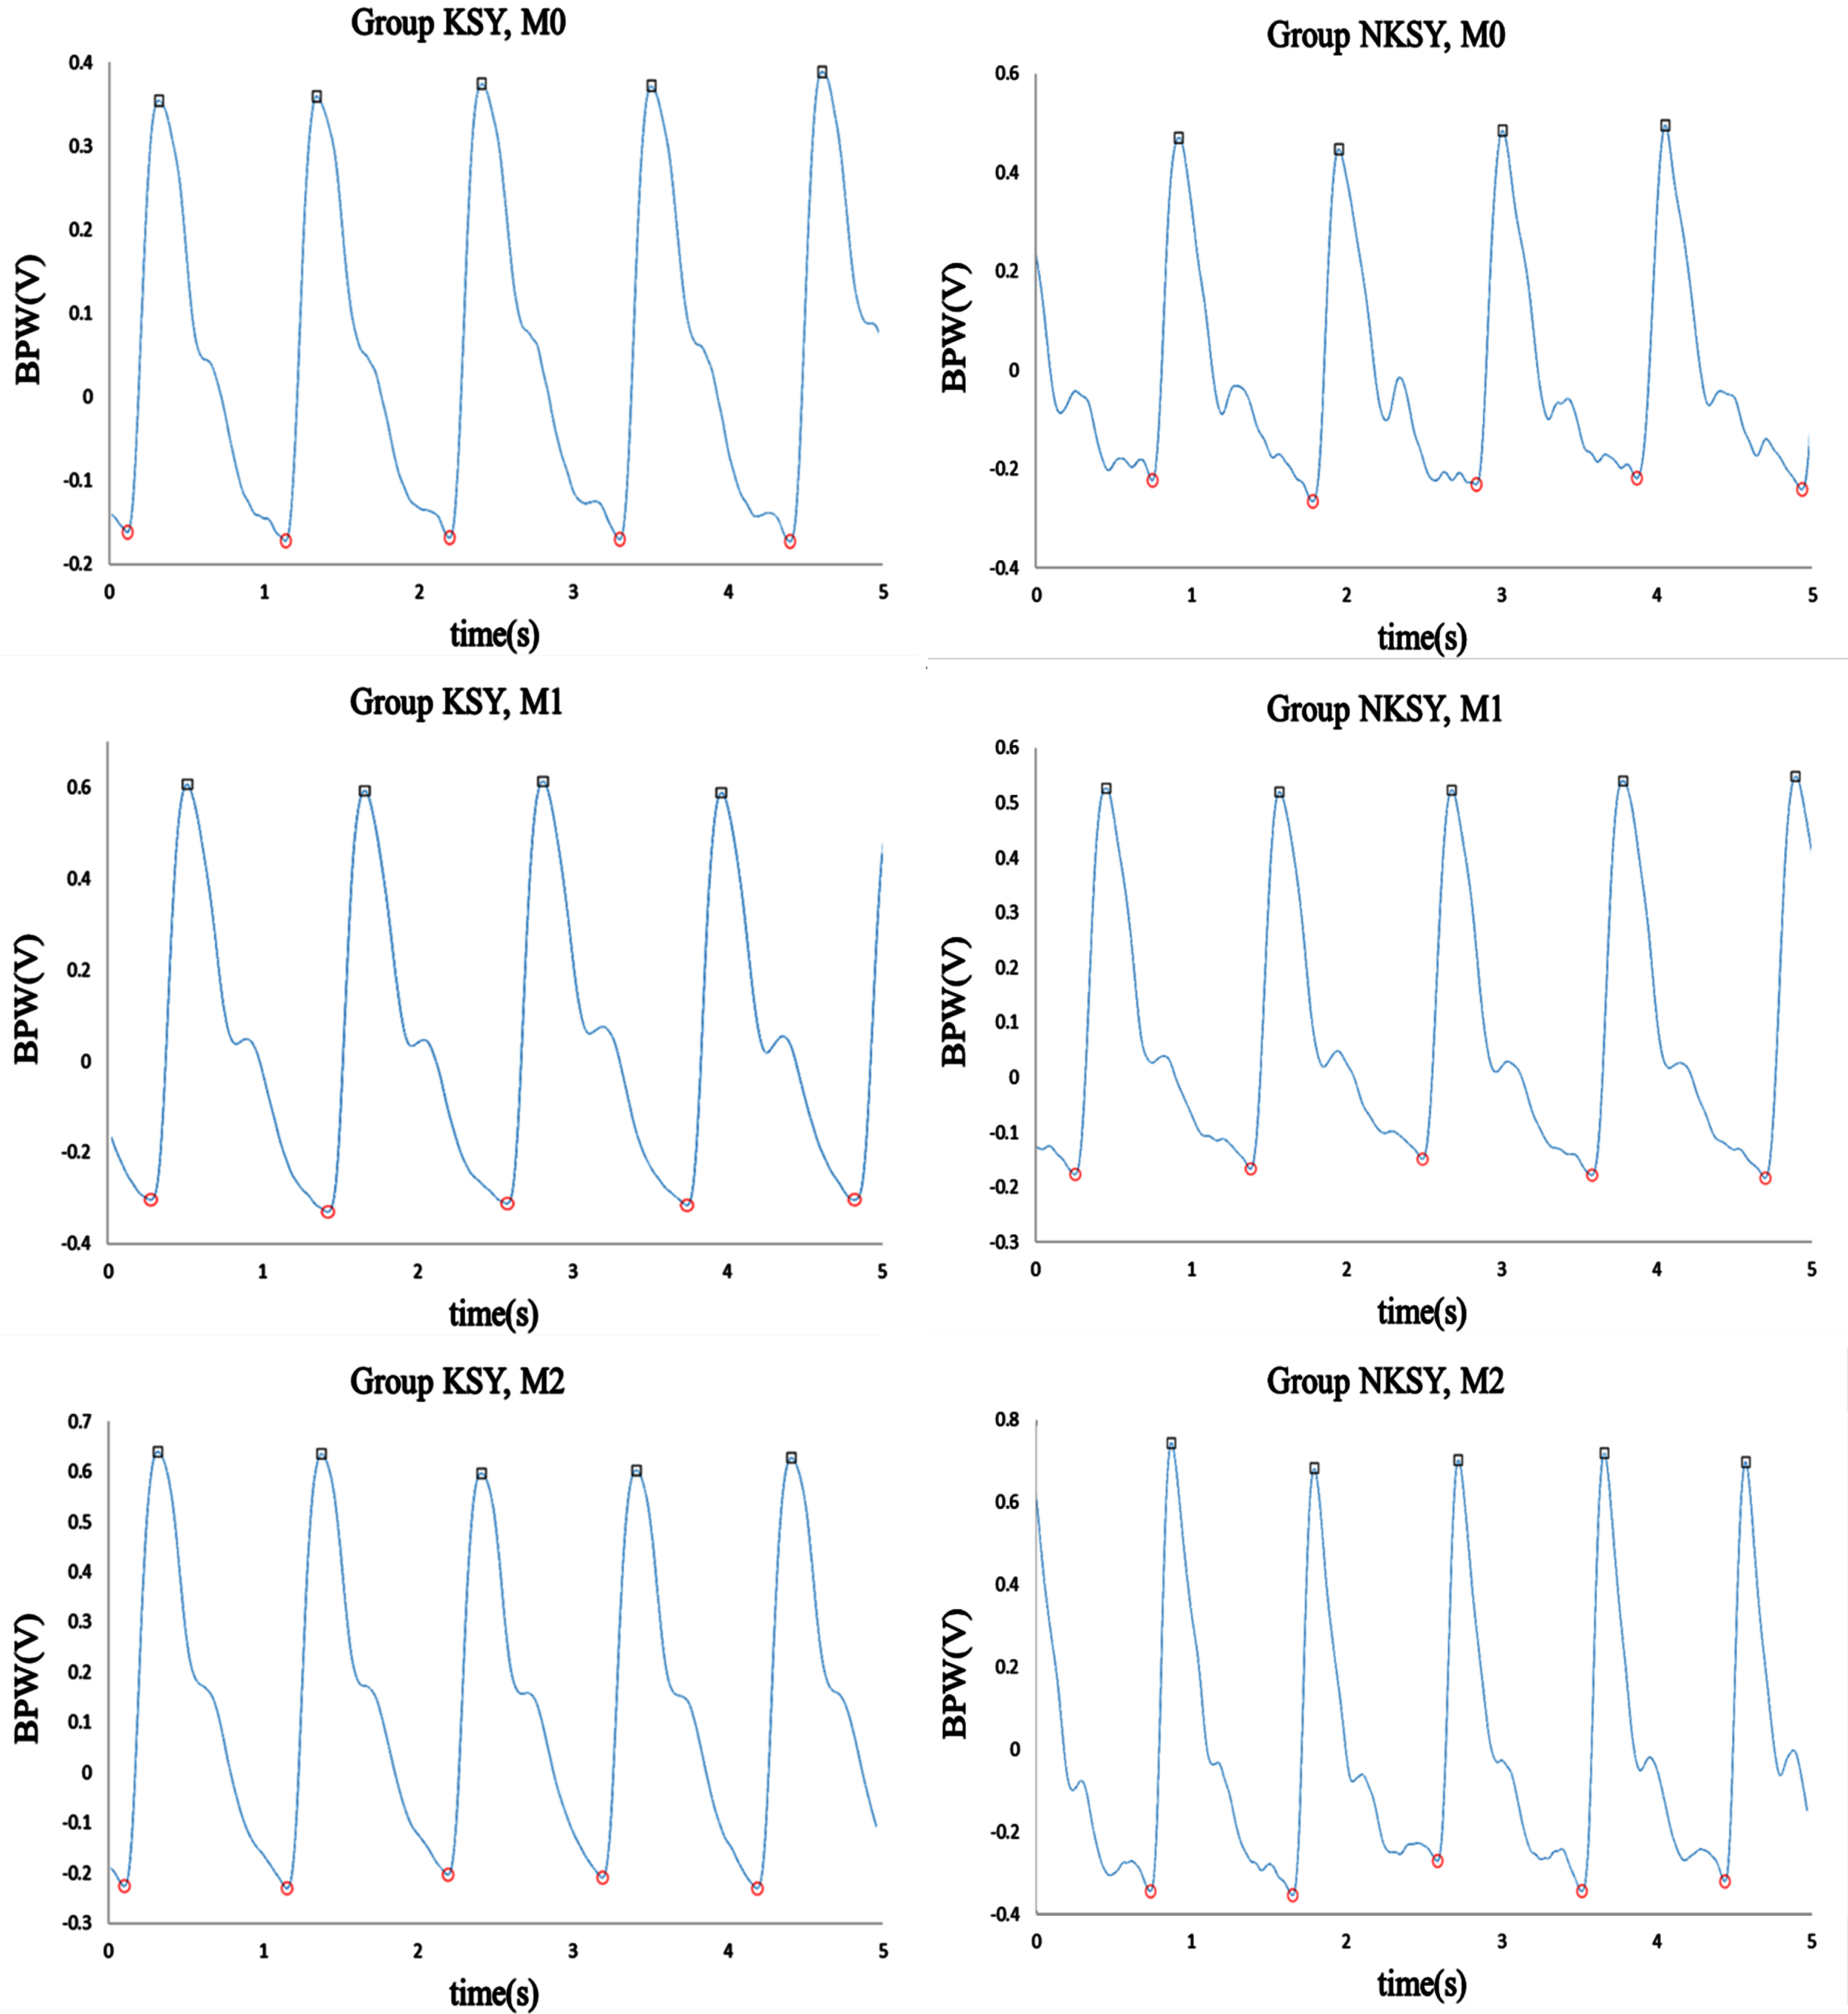
Typical measured BPW waveforms (in arbitrary units) in Groups KSY and NKSY at M0– M2.
Patient recruitment was coordinated by the Division of Hematology and Oncology of the RenAi Branch of Taipei City Hospital. Informed consent was obtained from the study participants or their legal designates (the protocol was approved by the Review Board of Taipei City Hospital; TCHIRB-10806006). Details of the study subjects are provided in Table 1. KSY was given at 100 cc every day after breakfast to participants in Group KSY, but not to those in Group NKSY. BPW measurements were made and the Functional Assessment of Cancer Therapy– General (FACT-G; version 4), Brief Fatigue Inventory– Taiwan (BFI-T), and EORTC QLQ-C30 (version 3) questionnaires were administered to each subject at M0 (within 3 days before chemotherapy), M1 (7–10 days after the first anthracycline chemotherapy session), and M2 (7–10 days after the second chemotherapy session, corresponding to 3 weeks after first chemotherapy session).
Fundamental physiological parameters (quantity or mean±standard-deviation values) of the study subjects. The HR, brachial systolic blood pressure (BP), and diastolic BP were measured before the BPW measurement using a sphygmomanometer (MG150f, Rossmax)
The administered traditional-Chinese-medicine KSY decoction contained seven Chinese herbs: Codonopsis pilosula, Atractylodes macrocephala, Glycyrrhiza uralensis, Poria coco, Astragalus membranaceus, Ligustrum lucidum, and Agastache rugosa.
Before the measurements, the subjects were relaxed and rested for at least 10 min. The environmental temperature was within 23–25°C during the entire measuring period. All subjects gave their informed consent before experiments commenced, were asked to not take any medication for 3 days before experiments, and did not consume food at least 1 h before each experiment. All subjects were non-smokers, and did not take coffee or drinks containing alcohol at least 1 day before experiments [18–20].
For each experiment, the subjects were sitting on a chair, and ECG and BPW signals were measured noninvasively; self-reporting of cancer-related symptoms, Functional Assessment of Cancer Therapy-General (FACT-G; Version.4), Brief Fatigue Inventory-Taiwan (BFI-T), and the EORTC QLQ-C30 (Version.3) questionnaires were applied to the subjects. ECG signals were measured by surface electrodes, and acquired by a preamplifier (lead II, RA-LL; 6600-series, Gould, USA). The BPW signal was acquired by a pressure transducer (KFG-2-120-D1-11, Kyowa) held onto the skin surface above the radial artery 2 cm from the left wrist. The signals were connected to a self-made current-to-voltage converter circuit, and then connected to an analog-to-digital converter card (PCI- 9111DG, Adlink Technology, Taiwan) operating at a sampling rate of 1024 Hz. Before the measurement, the heart rate (HR), brachial systolic BP and diastolic BP were measured by using a sphygmomanometer (MG150f, Rossmax) [18–20].
One thermistor was attached around the wrist to monitor the skin-surface temperature. The resistance of the thermistor was transformed into voltages (by a custom-made circuit) that were also sampled every minute by the analog-to-digital converter card. The acceptable range for the temperature stability during the baseline period was a temperature variation of less than 1.0 °C.
Analysis
Frequency-domain analysis was applied to derive the 40 harmonic indices from the measured BPW signal (n = 1-10): amplitude proportion (C n ), coefficient of variation of C n (CV n ), phase angle (P n ), and standard deviation of P n (P n _SD) [18–20].
Each individual pulse (between foot points) can be represented by the following finite series. The pulses were excluded if the values between the two foot points were larger than 20% of the pulse amplitude.
The Fourier coefficients (A
n
and B
n
) of the pulse can be calculated as
The amplitude (Amp
n
) and phase angle (P
n
) of each harmonic of the pulse harmonic spectrum can then be calculated as
Signal processing was performed with MATLAB (MathWorks). The differences were considered significant when p < 0.05; all p-values were two-sided hypotheses. Kruskal– Wallis test (nonparametric ANOVA) was used to compare the indices between groups. Post hoc multiple comparisons tests were made by Dunn’s test.
Results
The basic physiological parameters of the subjects are listed in Table 1. The comparison of BPW indices in Fig. 2 reveals that there were more-prominent changes in C n in Group NKSY between M1 and M0 (significant decreases in C3 and C5– C10). For example, the average absolute changing ratios in C5– C10 between M1 and M0 were 16.66% for Group KSY and 31.46% for Group NKSY, respectively. At M2 of Group NKSY, higher-frequency components (C5– C10) tended to return (i.e., increase) toward the value at M0. Similarly for P n , there were also more-prominent changes in the main frequency components (lower-frequency components; P1– P4) between M1 and M0 in Group NKSY, with significant decreases in P1 and P3. The average absolute differences in P1– P4 between M1 and M0 were 3.77° for Group KSY and 11.96° for Group NKSY, respectively.
Comparisons of BPW harmonic indices between Groups KSY and NKSY at M0– M2: C
n
and P
n
. Data are mean and standard-deviation values. C6– C10 values have been multiplied by 5 to make the differences clearer. “” indicates p < 0.05. In Group NKSY, there were more-prominent changes in C
n
between M1 and M0 (significant for C3 and C5– C10; the average absolute changing ratios in C5– C10 between M1 and M0 were 16.66% for Group KSY and 31.46% for Group NKSY, respectively). In Group NKSY, C5– C10 (higher-frequency components) were larger at M2 than at M1 (i.e., closer to the values at M0). The changes between M1 and M0 in P
n
values of the main frequency components (lower-frequency components; P1– P4) were also more prominent in Group NKSY (significant decreases in P1 and P3); the average absolute differences in P1– P4 between M1 and M0 were 3.77° for Group KSY and 11.96° for Group NKSY, respectively. Power were > 0.8 for C3, C5– C7, and P1 between M1 and M0 in Group NKSY.
Similar findings were noted for the BPW variability indices. Figure 3 reveals that there were more-prominent changes in CV n and P n _SD between M1 and M0 (significant decreases in CV1, CV2, CV4, CV7, and P1_SD– P5_SD; power all > 0.8) in Group NKSY than in Group KSY, with no significant changes in CV n and P n _SD.
Comparisons of BPW variability indices between Groups KSY and NKSY at M0– M2: CV
n
and P
n
_SD. Data are mean and standard-deviation values. “” indicates p < 0.05. In Group NKSY, there were more-prominent changes in CV
n
and P
n
_SD between M1 and M0 (significant decreases in CV1, CV2, CV4, CV7, and P1_SD– P5_SD). Between M2 and M0, there were also significant decreases in CV1, CV2, CV4, and P2_SD– P7_SD. Power were all > 0.8 for these CV
n
and P
n
_SD indices with significant differences in Group NKSY. There were no significant changes in CV
n
and P
n
_SD in Group KSY.
Figure 4 compares heart rate (HR) and its coefficient of variation (HR_CV) between Groups KSY and NKSY. HR was significantly increased in Group KSY at M1 and M2 compared with M0. HR_CV did not differ significantly among M0– M2, while it was nonsignificantly decreased at M1 in Group NKSY, which was similar to the changes in BPW variability indices.
Comparisons of HR and HR_CV between Groups KSY and NKSY. Data are mean and standard-deviation values. “” indicates p < 0.05. HR was significantly increased in Group KSY at M1 and M2 compared with M0. HR_CV did not differ significantly among M0– M2.
Figures 5 and 6 compare scores on the FACT-G, BFI-T, and EORTC QLQ-C30 questionnaires between Groups KSY and NKSY at M0– M2. The results for EORTC QLQ-C30 in Fig. 5 reveal that the deterioration in the global health status at M1 was more prominent in Group NKSY than in Group KSY. Physical functioning and social functioning tended to increase in Group KSY (M1 minus M0 difference = 2.12±5.16% [mean±standard deviation]) and tended to decrease in Group NKSY (– 6.53±6.70%). There were more-prominent increases in fatigue and financial difficulties (the cancer-related symptoms) at M1 in Group NKSY (M1 minus M0 difference = 93.04±78.98%) than in Group KSY (70.58±128.91%). These findings illustrate that at M1, the quality of life of the cancer patients was better in Group KSY than in Group NKSY. Figure 6a reveals that BFI-T scores were slightly increased in Group NKSY, indicating worse cancer-related fatigue. Figure 6b shows a significant increase in physiological well-being in Group KSY.
EORTC QLQ-C30 scores before and after KSY treatment at M0– M2. (a) Higher scores indicate a better condition. PF, physical functioning; RF, role functioning; EF, emotional functioning; CF, cognitive functioning; SF, social functioning; QL, global health status. (b) Lower scores indicate a better condition. FA, fatigue; NV, nausea and vomiting; PA, pain; DY, dyspnea; SL, insomnia; AP, appetite loss; CO, constipation; DI, diarrhea; FI, financial difficulties. “” indicates p < 0.05. In (a), the decrease in QL at M1 was more prominent in Group NKSY than in Group KSY. The values at M1 in Group KSY tended to be increased (except for RF; the M1 minus M0 difference for all six indices was 2.12±5.16%), whereas they were decreased in Group NKSY (except for PF; – 6.53±6.70%) compared with the values at M0. In (b), increases in the values at M1 were more prominent in Group NKSY (M1 minus M0 difference = 93.04±78.98%) than in Group KSY (70.58±128.91%) compared with the values at M0.
BFI-T and FACT-G scores before and after KSY treatment at M0– M2. (a) BFI-T scores assessing the cancer-related fatigue. At M1, the score was slightly increased in Group NKSY. (b) FACT-G scores measuring four domains of the health-related quality of life in cancer patients. PWB, physiological well-being; SWB, social well-being; EWB, emotional well-being; FWB, functional well-being. “” indicates p < 0.05. The PWB score was significantly increased at M1 in Group KSY.
This study found more-prominent changes in spectral BPW indices in M0-M2 in Group NKSY compared to Group KSY, especially the decreases in BPW variability indices. This illustrated that since the heartbeat-driven pulse signal is quasiperiodic, beat-to-beat and frequency-domain harmonic analysis can help to provide more-detailed information about the pulse waveform. Score results of the FACT-G, BFI-T, and EORTC QLQ-C30 questionnaires illustrated that Group KSY may have better quality of life following chemotherapy.
Comparisons of pulse indices
For the amplitude proportions (C n ), Fig. 3 indicates that there were more-prominent changes at M1 in Group NKSY (significant decreases for C3 and C5– C10). At M2, C5– C10 tended to return from the values at M1 to those at M0 (significant for C5). Changes in C n at M1 were less prominent in Group KSY than in Group NKSY.
Regarding vessel wall properties, one important characteristic of cancer is angiogenesis [26]. Experimentally induced tumors have been found to contain high levels of vasodilators [27]. Vascular dissemination is a major mechanism by which BC cells migrate into the systemic circulation, leading to distant metastasis and mortality [6]. Associations between adenoma and atherosclerosis have been reported [28]. The mean vascular stiffness has been found to be higher in invasive cancers with poor prognostic features than in cancers with good prognostic features [29]. Acute changes are observed in pulse-wave velocity and distensibility following BC chemotherapy, and these changes partially reverse after the termination of chemotherapy.
Increases in arterial stiffness and endothelial dysfunction have been demonstrated in cancer patients treated with anthracycline chemotherapy [21, 30]. Stiffening of large elastic arteries has been noted in the carotid artery and the aorta [21]. Impairment of the vessel wall has been identified using fluorescence optical imaging [31]. The underlying mechanisms can be attributed to ROS-associated oxidative stress and chronic inflammation [21]. Impaired endothelial function may result in reduced relaxation and increased contraction, and hence increased arterial stiffness [30]. A reduced left ventricular ejection fraction and impairment of vascular function may change the pulse wave propagation and decrease blood supply to peripheral vascular beds, and hence could partly account for the side effects on the quality of life in cancer patients.
KSY has been reported to reduce tumor growth and suppress the proliferation of cancer cells. Analyses of HR variability revealed that KSY induced decreases in the sympathetic neural activity [24, 25]. A study of the microcirculatory blood flow using LDF measurements found significant differences in the approximate entropy and spectral power of blood-flow signals in BC patients receiving chemotherapy between with and without using KSY, which indicates that different microcirculatory-blood-flow responses are induced by KSY administration. Improvement of EORTC QLQ-C30 scores (indicating improvement of cancer-related side effects) was also found in this study, illustrating that restoring the blood-flow supply by administering KSY may help to restore the physiological functioning of BC patients [18]. Skin-surface measurements made following KSY treatment have identified increases in electrical conductivity, which could be related to improvements in the local blood supply [24].
The decreases in C n at M1 in Group NKSY occurred predominantly in the higher-frequency components. Since the pulse can distend the arterial wall and push blood through the arteriolar openings to supply the tissue, C n can represent the power of that frequency component within BPW. The main (lower-frequency) frequency components constituting the largest proportion of the BPW power could be more strongly related to pulse transmission in the main artery, with the higher-frequency components being more strongly related to pulse transmission in the peripheral arteries. It is possible that decreases in C5– C10 are related to the decreased distribution efficiency of the pulse transmission and hence the blood flow perfusion to local tissues. Such changes in C n can therefore be utilized to monitor impairments of the blood-supply condition in BC patients following chemotherapy. Based on this conjecture, the less-prominent changes in C n at M1 in Group KSY could be related to the maintenance of the propelling force for the blood flow perfusion following chemotherapy. This illustrates that the possible physiological benefits of using KSY treatment may be partly attributed to the maintenance of the blood supply condition and hence the physiological condition.
The decreases in C5– C10 at M1 in Group NKSY were slightly restored (i.e., increased; nonsignificant except for C5) toward the values at M0. It is possible that the harmful effects on the blood flow distribution efficiency could be attenuated at M2, which illustrates the possibility of using the present analysis method to monitor the blood flow distribution condition in BC patients after they receive chemotherapy.
The phase angle can also be obtained by spectral analysis from a time-domain pulse waveform. The P n value physically corresponds to the time delay to the onset point of the pulse waveform. It can be correlated with the wave propagation velocity of each frequency component within the BPW, and hence it could be another useful index for evaluating changes in vascular properties.
Figure 3 shows that the changes in the main frequency components (lower-frequency components; significant decreases in P1 and P3) were more prominent in Group NKSY than in Group KSY. A decreased P n could be related to the decreased transmission velocity and efficiency of the corresponding frequency component, and hence implies decreased propelling efficiency of the blood supply to local tissues in Group NKSY. There were no such significant differences in the main frequency components in Group KSY, which illustrates that the harmful effects on the blood flow distribution efficiency were alleviated in Group KSY.
Comparisons of pulse variability indices
The main finding in the present study is the different changing patterns in pulse variability indices between Groups KSY and NKSY. There were no significant changes in CV n and P n _SD in Group KSY, whereas there were significant decreases in several variability indices in Group NKSY, which were especially significant for many main (lower) frequency components. Therefore, similarly to C n and P n , pulse variability indexes can also be useful in monitoring tumor-related hemodynamic changes.
Increased aortic stiffness has been attributed to structural changes in the vascular matrix and interference in the endothelin regulation of vascular tone [16]. The decreases in CV n and P n _SD found in the present study could be related to the impaired regulatory activities in Group NKSY. Tumor vessels differ structurally from normal vessels, having ruffled margins outward and across the vessel lumen that may impair the blood flow and result in hypoxia and hypoperfusion [32]. Immature vessel walls lacking muscle cells and adrenergic innervation have also been noted [33]. The impaired vascular regulatory function may have decreased the microcirculatory regulatory activity and hence decreased the pulse variability indices in Group NKSY. The significant decreases in pulse variability indices occurred mainly in the lower-frequency components. Since these components constitute the largest proportion of the power within the pulse waveform, the present findings for pulse variability indices could be related to the impairment of vascular regulatory mechanisms in the main artery in Group NKSY. In Group KSY, the blood supply and the impairments of the vessel wall could be improved; this may help to maintain the vascular regulatory function, and therefore no significant changes in pulse variability indices were found.
In our previous study [18] we used LDF to measure the microcirculatory blood flow in cancer patients with and without applying KSY. Similar to the present findings for the pulse variability indices, variability indices in the microcirculatory blood flow in Group NKSY were also decreased in that previous study. This illustrates that the upstream (the main artery) and downstream (microcirculation) parts of the vascular system may exhibit similar vascular regulatory responses following the administration of KSY in BC patients.
Figure 4 indicates that HR_CV did not differ among M0– M2 in both groups. HR_CV is correlated with the regulatory activities of the heartbeat, and the pulse variability indices may be more strongly correlated with the vascular condition. The present findings indicate that there were significant differences in the pulse variability indices even when there were no significant differences in the HR variability index. HR_CV was also slightly decreased (although nonsignificantly) at M1 in Group NKSY; this is similar to the changes in the BPW variability indices. These observations further illustrate the similarity in the regulatory mechanisms for the source (the heart) and the downstream (the artery) parts of the cardiovascular system in BC patients receiving chemotherapy.
Questionnaire results
The scores on the EORTC QLQ-C30, BFI-T, and FACT-G questionnaires in Figs. 5 and 6 reveal that the condition in Group NKSY was worse than that in Group KSY for many aspects of the cancer-related quality of life. It has been previously demonstrated that restoring the local blood supply by administering KSY may help to restore physiological functioning (indicated by improvements in the EORTC QLQ-C30 measures) following chemotherapy [18]. The present findings further illustrate that pulse analysis evaluating the pulse-wave transmission condition has potential in monitoring the different physiological and quality-of-life conditions induced by administering KSY. Compared with LDF measurements (as used in previous studies) that may suffer from interference from motion artifacts, pulse waveform measurements have advantages in practical applications such as being more convenient and user-friendly. The present findings may be meaningful in developing techniques to evaluate the blood supply and physiological conditions following chemotherapy or other treatment strategies in cancer patients.
Conclusion
The findings of this study and the related conclusions to be drawn can be summarized as follows: Changes in spectral BPW indices were more prominent in Group NKSY than in Group KSY, especially for the different changing patterns in pulse variability indices. Administering KSY may result in a better quality of life following chemotherapy as evaluated using the FACT-G, BFI-T, and EORTC QLQ-C30 questionnaires. The identified decreases in pulse variability indices could be related to the greater impairment of regulatory activities in Group NKSY. The present measurements and analyses detecting the changes in the arterial pulse transmission condition could be utilized in the development of a noninvasive and easy-to-use method for evaluating the blood supply and physiological conditions following chemotherapy or other treatment strategies in cancer patients.
Footnotes
Acknowledgments
The authors would like to thank the Ministry of Science and Technology (MOST 107-2221-E-011 -014; MOST 111-2221-E-011-017-MY2; MOST 111-2320-B-532-001-MY3) and Taipei City Hospital for partial support of this work.
Conflict of interest
The authors declare no conflict of interest.
Funding
This work was partly supported by Ministry of Science and Technology (MOST 107-2221-E-011 -014; MOST 111-2221-E-011-017-MY2; MOST 111-2320-B-532-001-MY3), and Taipei City Hospital.
Informed consent
Informed consent was obtained from all individual participants included in the study.