



Abstract
OBJECTIVE:
This study aimed to evaluate the clinical characteristics and features of conventional ultrasound (CUS) and contrast-enhanced ultrasound (CEUS) in differentiating between renal urothelial carcinomas (RUC) and endophytic clear cell renal cell carcinomas (EccRCC).
METHODS:
A total of 72 RUCs and 120 EccRCCs confirmed by pathology were assessed retrospectively. Both CUS and CEUS were performed within 4 weeks before the surgery. Logistic regression analyses were used to select statistically significant variables of clinical, CUS, and CEUS features for the differentiation of RUC and EccRCC. Sensitivity (SEN), specificity (SPE), and the area under the receiver-operating characteristic curve (AUC) were assessed for diagnostic performance. Inter- and intra-observer agreements of CUS and CEUS features were evaluated using the intra-class correlation coefficient(ICC).
RESULTS:
Multiple logistic regression analysis demonstrated that clinical (age >50 years old and hematuria), CUS (size <4.0 cm, hypo-echogenicity, irregular shape, hydronephrosis) and CEUS (absence of non-enhancement area, iso- /hypo-enhancement in cortical phase and absence of rim-like enhancement) features were independent factors for RUC diagnosis. When combining clinical characters with CUS and CEUS features into an integrated diagnostic criterion, the AUC reached 0.917 (95% CI 0.873–0.961), with a sensitivity of 95.8% and specificity of 87.5%. ICC ranged from 0.756 to 0.907 for inter-observer agreement and 0.791 to 0.934 for intra-observer agreement for CUS and CEUSfeatures.
CONCLUSIONS:
The combination of clinical features of age and hematuria with imaging features of CUS and CEUS can be useful for the differentiation between RUC and EccRCC.
Keywords
List of abbreviations
urothelial carcinoma
renal urothelial carcinoma
upper tract urothelial carcinoma
renal cell carcinoma
clear cell renal cell carcinoma
endophytic clear cell renal cell carcinoma
ultrasound
conventional ultrasound
contrast-enhanced ultrasound
ultrasound contrast agents
mechanical index
computed tomography urography
magnetic resonance urography
sensitivity
specificity
receiver-operating characteristic
intra-class correlation coefficient
the area under ROC curve
Introduction
Clear cell renal cell carcinoma (ccRCC) is the most common renal malignant tumor [1], accounting for 70–80% of renal cell carcinomas (RCC) [2]. ccRCCs are typically located in the renal parenchyma but when they grow into the renal sinus, they are known as endophytic ccRCCs (EccRCCs) [3]. The proximity of EccRCCs to the collecting system poses difficulty in distinguishing them from renal urothelial carcinomas (RUCs) due to their overlapping imaging features. RUC is the second most common cancer of malignant renal tumor after RCC [4]. Due to their distinct management strategies (EccRCC: radical nephrectomy; RUC: radical ureteral nephrectomy) [5–7], the accurate differential diagnosis before surgery is necessary.
Renal mass biopsy is the gold standard for differentiation before the operation, while its use remains controversial due to concern for neoplastic seeding and bleeding [8, 9]. Computed tomography urography (CTU) is widely considered the most reliable imaging technique for diagnosing upper tract urothelial carcinomas (UTUC), according to the European Association of Urology Guidelines [6], with the sensitivity of 92–100% and specificity of 95–98% [10, 11]. Magnetic resonance urography (MRU) is the most common alternative with the sensitivity of 62.5–94.1%, usually when the patient is in a condition contraindicating the application of CTU [12, 13]. Despite their high sensitivity, contrast agents used in CTU and MRU show nephrotoxicity or cause nephrogenic systemic fibrosis and can potentially affect renal function [6]. On the contrary, US contrast agent (UCA) is regarded as suitable for patients with poor kidney function due to its pulmonary elimination. Meantime, as an imaging modality performing with UCAs, contrast-enhanced ultrasound (CEUS) has excellent contrast resolution compared to any clinical imaging modality [14, 15]. Preliminary research suggested that CEUS demonstrated superior specificity, and diagnostic accuracy in comparison to enhanced MR [16–18]. This is because UCAs are intravascular agents with improved perfusion imaging, while CT/MR contrast agents can diffuse outside the blood vessels and result in complex enhancement patterns [14]. In addition, the injection of a bolus of the US contrast medium does not lead to perfusion defects or decreases of the partial oxygen pressure in the kidney [19]. Thus, ultrasound contrast shows promise in renal malignancy diagnosis, prognosis, and management with better temporal resolution and real time capability, especially in cases of renal failure, contrast allergies, or in the setting of limited medical resources [20, 21]. However, studies on CEUS in identifying RUC from EccRCC, using histopathology as the reference standard, are insufficient.
Therefore, the main purpose of the present study was to identify the most helpful diagnostic clinical features and sonographic features of CUS and CEUS in distinguishing RUC from EccRCC, using surgical pathology as the reference standard. We present the following article in accordance with the STARD reporting checklist.
Materials and methods
Patients
This study was approved by our institutional research ethics committee (Ethics [2024]413), and due to the retrospective nature of the study, informed consent was waived. From July 2010 to November 2022, 1005 patients with renal tumors were referred to our hospital for CEUS. The inclusion criteria were: (a) histopathologic diagnosis proving tumors to be RUC or ccRCC, (b) age greater than 18 years, and (c) CUS and CEUS performed within four weeks before surgery. Exclusion criteria included: (a) renal tumors confined within the renal parenchyma without obstruction of the renal pelvis or sinus fat, lesions not reaching the renal pelvis, or tumors separable from the collecting system based on imaging examination [3, 22]; (b) poor image quality that prevented clear ultrasound visualization of the lesion, and (c) previous treatment history including chemotherapy, radiotherapy, or targeted therapy. Based on the pathological and imaging examinations, all patients were categorized into two groups: the RUC group and the EccRCC group. A flow diagram of the study is presented in Fig. 1.

Flowchart of the patients’ selection procedure in the study. “non-RCC + non-RUC” cases are primarily regarded by pathologists as leiomyoma lipoma, mesenchymal tumor, renal oncocytoma, squamous cell carcinoma, cysts, chronic inflammation, and others.
Ultrasound examinations were conducted using the Acuson Sequoia 512 (Siemens Medical Solutions, Mountain View, CA, USA) or Aplio 500/900 (Cannon Medical Systems, Tokyo, Japan) machines. The Acuson Sequoia 512 used a 4V1 vector transducer (frequency range: 1–4 MHz), while the Aplio 500/900 used a PVT-375 BT 6 C1 convex transducer (frequency range: 1.9–6.0 MHz). Regarding mechanical index (MI) and imaging mode of contrast, the Acuson Sequoia 512 used contrast pulse sequencing (MI range: 0.15– 0.21), while the Aplio 500/900 used contrast harmonic imaging (MI range: 0.08–0.10). SonoVue (Bracco, Milan, Italy) was used as the contrast agent.
The CUS and CEUS examinations were performed by sonographers with over five years of experience in ultrasonography and at least two years of experience in CEUS. After at least 8 hours of fasting, the entire kidney was first thoroughly examined with a CUS scan to identify suspicious lesions. A bolus injection of 2.4 mL of SonoVue (Bracco) was then administered intravenously via an antecubital vein, followed by 5 mL of normal saline. The lesion was continuously monitored for the first minute and intermittently scanned several times for the following 3 minutes. The enhancement phase of the renal lesion was divided into two stages: the cortical phase, defined as 0– 30 seconds after UCA injection, where cortical enhancement was observed, and the parenchymal phase, which occurred 31 seconds to 4 minutes after UCA injection, where both the cortex and medulla were enhanced [23, 24]. Videos and images of each successful CUS and CEUS examination were stored for subsequent analysis.
Image analysis
Two experienced radiologists (ZBW and XXH) who had more than 8 years of experience in abdominal CUS and CEUS independently reviewed the CUS and CEUS images and videos at time of study. They were both blinded to patients’ clinical data, CT/MRI results, and histopathological findings. CUS features assessed included tumor size, echogenicity, homogeneity, anechoic area, border, morphology, renal calculi, hydronephrosis, tumor calcification, and vascularity. CEUS features assessed included non-enhancement areas, cortical phase, parenchymal phase, enhancement homogeneity, and rim-like enhancement. The detailed definitions of these acoustic features are listed in Table 1.
Features retrospectively evaluated in patients with RUC or EccRCC
Features retrospectively evaluated in patients with RUC or EccRCC
RUC, renal urothelial carcinoma; EccRCC, endophytic clear cell renal cell carcinoma; CUS, conventional ultrasound; CEUS, contrast-enhanced ultrasound.
Continuous data was expressed as the mean±standard deviation or median (P25-P75). Categorical data was presented as numbers (percentages). Differences in the two groups were evaluated using the Mann-Whitney U test (Student’s t-test, if normal distribution) or the Pearson X2 test (Fisher’s exact test, as appropriate).
Multiple logistic regression analyses were performed to identify the independent variables associated with the dependent variables from the clinical characteristics, CUS, and CEUS features, respectively. A forward stepwise selection method was adopted. For simplicity, we rounded the quantitative variable thresholds to the nearest integer. We selected independent variables with p-values <0.05 in the multiple logistic regression analyses for the construction of diagnostic criteria. The diagnostic effectiveness of different criteria was evaluated using sensitivity, specificity, and accuracy, as well as receiver-operating characteristic (ROC) analysis. To avoid over-fitting, the internal validation was conducted utilizing the cross-validation method (5-fold) to assess the reproducibility of the results.
Post hoc power analysis (α level = 0.05) was conducted to assess whether the sample size obtained was sufficiently large to detect a statistically significant difference between the two groups. Inter- and intra-observer agreements were evaluated using the intra-class correlation coefficient (ICC). We considered a two-tailed p-value less than 0.05 as the threshold to indicate statistical significance, and all statistical analyses were performed in R software (version 4.2.1, http://www.r-project.org) and SPSS (version 26.0; SPSS, Chicago, IL).
Results
Clinical characteristics
Of the 1005 patients assessed, 192 patients with 192 tumors were enrolled in the study, with 72 tumors in the RUC group and 120 in the EccRCC group. Post-hoc performance analysis showed a power of 1.00 for our sample. The RUC group comprised 35 men and 37 women, while the EccRCC group consisted of 76 men and 42 women. The patients in the RUC group were older on average than those in the EccRCC group (62.64±11.60 vs. 51.43±14.06, P < 0.001), and hematuria was more common in the RUC group than in the EccRCC group (94.4% [68/72] vs. 40.8% [49/120], P < 0.001). However, there was no significant difference between the two groups for smoking history (P = 0.533) or lumbago (P = 0.591) (see Table 2).
Clinical characteristics results of all patients
Clinical characteristics results of all patients
RUC, renal urothelial carcinoma; EccRCC, endophytic clear cell renal cell carcinoma. Data are numbers with percentage in parentheses. *Age was shown as mean±standard deviations.
The median tumor size was 3.4 cm (interquartile range [IQR], 2.7–4.1 cm) in the RUC group and 4.2 cm (IQR, 3.0–5.5 cm) in the EccRCC group (P = 0.002). The RUC group exhibited a higher prevalence of hypo-echogenicity (73.6% [53/72] vs 34.2% [41/120], P < 0.001) and hydronephrosis (41.7% [30/72] vs 5.8% [7/120], P < 0.001) compared to the EccRCC group. However, there were no significant differences in the anechoic area (P = 0.317) and tumor calcification (P = 1.0) between the two groups (see Table 3) (Figs. 2a and 3a).
CUS characteristics of all patients
CUS characteristics of all patients
RUC, renal urothelial carcinoma; EccRCC, endophytic clear cell renal cell carcinoma; CUS, conventional ultrasound. *Size was displayed as median (P25-P75).
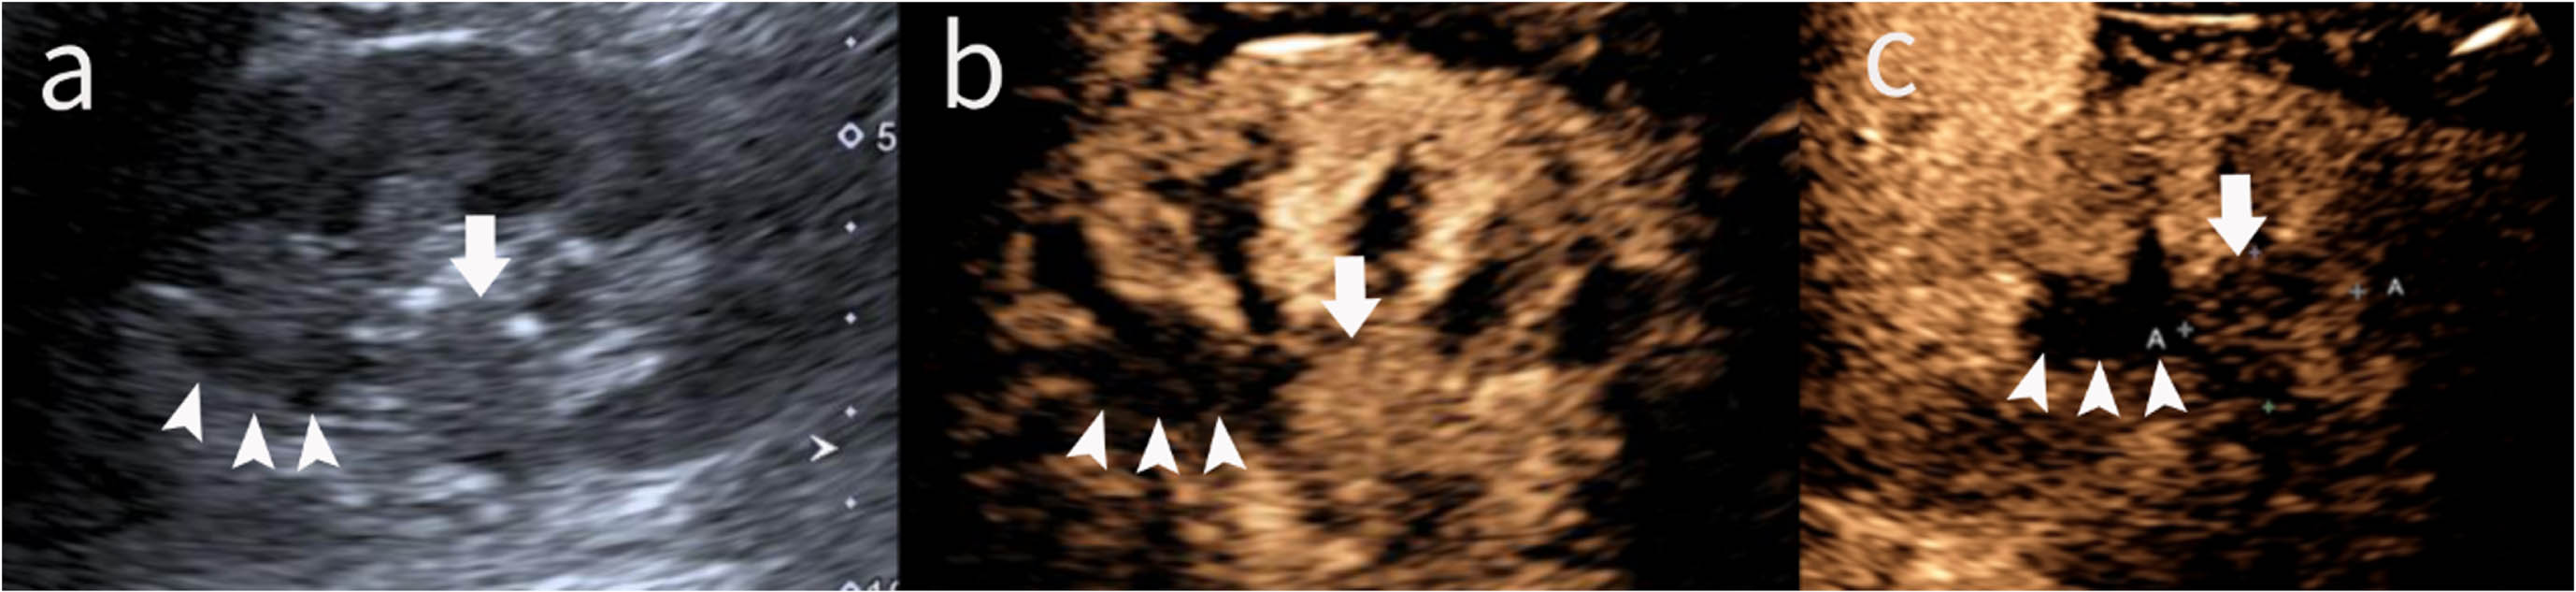
Renal urothelial carcinoma in a 55-year-old woman with gross hematuria for 7 months. (a) The conventional sonogram showed an ill-defined, hypoechoic mass in the mid-portion of the left kidney (arrow), with nearby localized hydronephrosis (arrowhead). (b) At 17 s after the injection of the contrast agent, the initial enhancement of the mass (arrow) was slower compared to that of the renal cortex. Meanwhile, the mass showed homogeneous enhancement. In contrast, hydronephrosis is not enhanced (arrowhead). (c) In the parenchymal phase, the degree of enhancement of the lesion is continuously low (image from 3 min 24s).
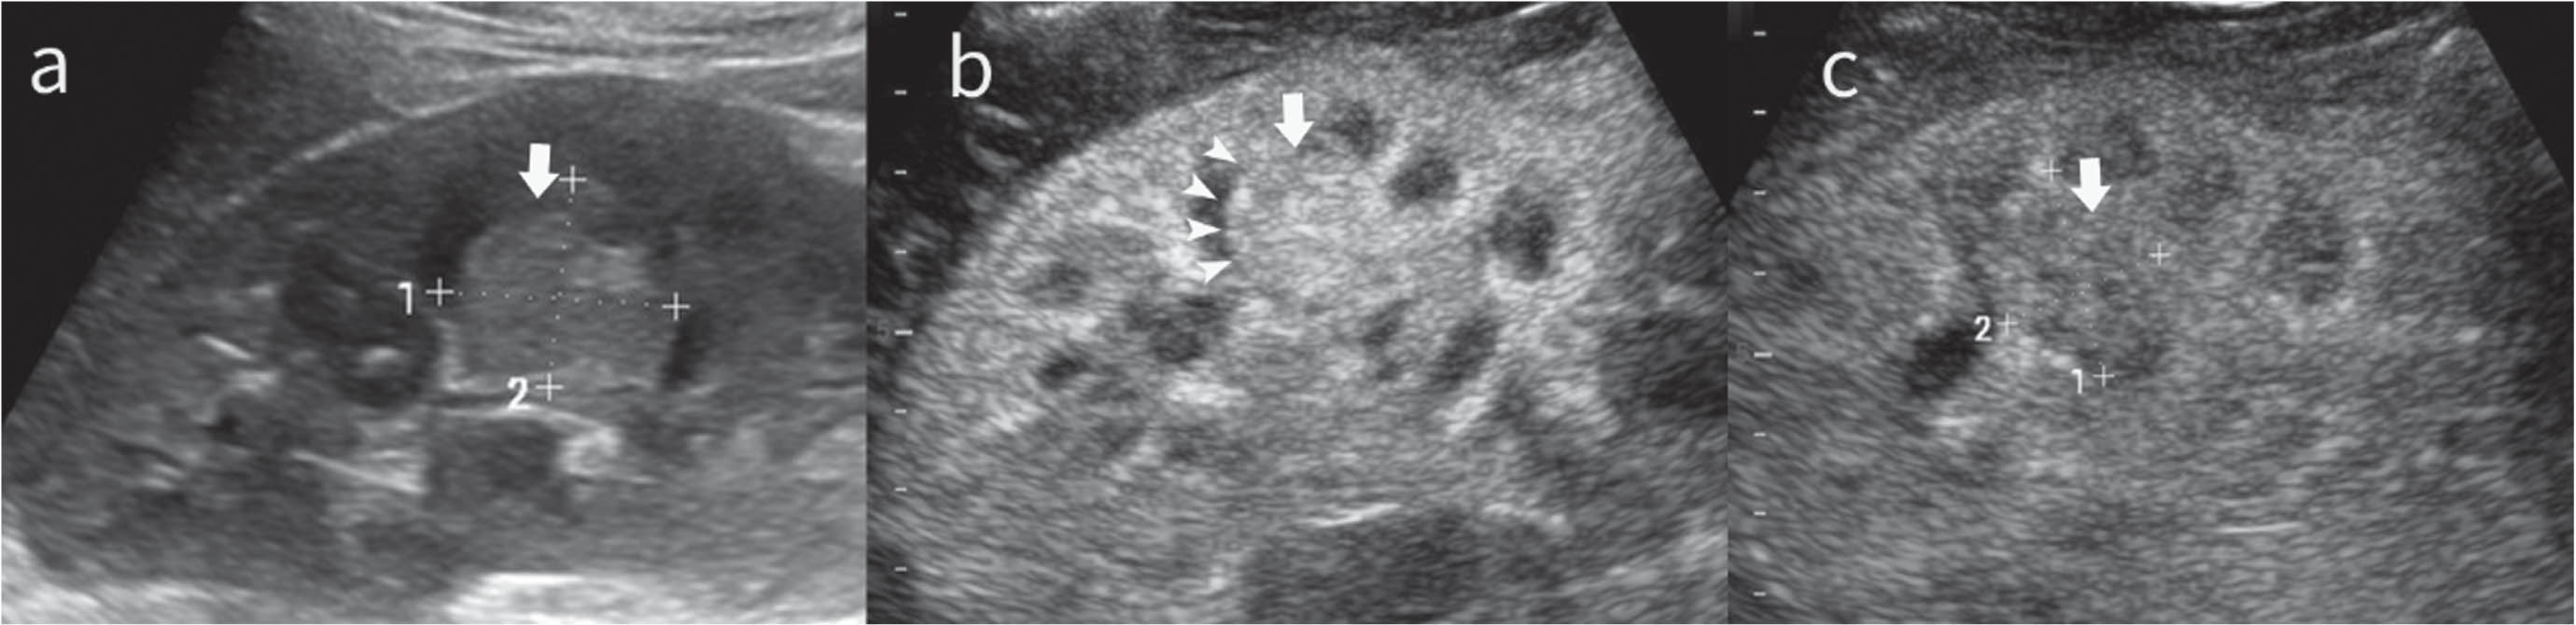
Endophytic clear cell renal cell carcinoma in a 25-year-old woman without hematuria for 1 month. (a) The conventional sonogram showed a hyperechoic round mass in the middle of the right kidney(arrow). (b) At 11 s after the injection of the contrast agent, the initial enhancement of the mass was slightly higher than that of the renal cortex, with a ring of enhancement (arrowhead) surrounding the tumor. Meanwhile, the mass enhanced heterogeneously. (c) In the parenchymal phase, the degree of enhancement of the lesion turned low (image from 2 min 7s).
On CEUS, a higher proportion of RUC (61/72, 84.7%) showed hypo-/iso-enhancement during cortical phase compared to EccRCC tumors. The frequency of non-enhancement areas was lower in RUC (3/72, 4.2%; P < 0.001) than in EccRCC tumors (51/120, 42.5%). Most RUC (69/72, 95.8%) showed hypo-enhancement during parenchymal phase, as did the majority of EccRCC (90/120, 75.0%). There was no significant difference in the enhancement homogeneity between RUC and EccRCC (homogeneous enhancement, 45.8% [33/72] vs 38.3% [46/120], P = 0.364). Fewer RUC exhibited rim-like enhancement (5/72, 6.9%; P < 0.001) than did EccRCC tumors (65/120, 54.2%). The comparison of CEUS features between the groups was shown in Table 4 (Figs. 2b, 2c, 3b and 3c).
CEUS characteristics of all patients
CEUS characteristics of all patients
RUC, renal urothelial carcinoma; EccRCC, endophytic clear cell renal cell carcinoma; CEUS, contrast-enhanced ultrasound.
Multivariable logistic regression analysis showed that hematuria (OR = 23.96, 95% CI 7.80–73.65, P < 0.001), age (OR = 1.07, 95% CI 1.03–1.10, P < 0.001), hypo-echogenicity (OR = 4.678, 95% CI 1.292–16.936, P = 0.019), irregular shape (OR = 24.062, 95% CI 7.519–77.000, P < 0.001), hydronephrosis (OR = 16.421, 95% CI 3.839–70.244, P < 0.001) and iso-enhancement (OR = 5.587, 95% CI 1.821–17.140, P = 0.003) or hypo-enhancement (OR = 4.289, 95% CI 1.533–11.999, P = 0.006) in cortical phase are the positively associated features for RUC, while tumor size (OR = 0.623, 95% CI 0.443–0.877, P = 0.007), non-enhancement area (OR = 0.044, 95% CI 0.011–0.171, P < 0.001) and rim-like enhancement (OR = 0.071, 95% CI 0.024–0.214, P < 0.001) are the negatively associated features for RUC (Table 5).
The independent variables associated with RUC by multiple logistic regression analysis
The independent variables associated with RUC by multiple logistic regression analysis
RUC, renal urothelial carcinoma; CUS, conventional ultrasound; CEUS, contrast-enhanced ultrasound.
Based on multivariate analysis results, we established diagnostic criteria for predicting RUC and EccRCC using three methods: (A) clinical, (B) CUS, and (C) CEUS. The criterion for RUC in the clinical criteria included both hematuria and age >50 years old. The conventional US criterion for RUC consisted of any two of the four factors, which included hypo-echogenicity, size < = 4.0 cm, irregular shape, and hydronephrosis. The CEUS criterion for RUC included all the following features: absence of non-enhancement area, absence of rim-like enhancement, and hypo/iso-enhancement in cortical phase. To improve the effectiveness of differential diagnosis, we developed an integrated criterion (D) that incorporates the combination of any two existing diagnostic criteria mentioned above.
The areas under the ROC curve (AUC) (Fig. 4) of diagnostic criteria (A) clinical, (B) CUS, and (C) CEUS were 0.804 (95% CI, 0.738–0.870), 0.847 (95% CI, 0.790–0.904), and 0.857 (95% CI, 0.796–0.918), respectively. The AUC value of the integrated criterion (D) increased to 0.914 (95% CI, 0.873–0.961). Moreover, the sensitivity, specificity, and accuracy were 83.3%, 80.0%, and 77.5% (A); 94.4%, 75.0%, and 82.3% (B); 80.5%, 90.8%, and 87.0% (C); and 95.8%, 87.5%, and 90.6% (D), respectively. The details of the diagnostic performance are summarized in Table 6 and presented in Fig. 5. The cross-validation of criterion (D) had good reproducibility with AUC ranging from 0.830 to 0.958 (Fig. 6).

Receiver-operating characteristic (ROC) curves showed the diagnostic performance of clinical characteristics, conventional ultrasound (CUS), contrast-enhanced ultrasound (CEUS), and the integrated criterion in differentiating between renal urothelial carcinoma (RUC) and endophytic clear cell renal cell carcinoma (EccRCC).
Classification performance of different diagnostic criteria for RUC
A: Clinical. Hematuria + age >50 years old. B: CUS. Meet any two of the four elements (size <4.0cm, hypo-echogenicity, irregular shape, hydronephrosis). C: CEUS. Absence of non-enhancement area + iso- or hypo-enhancement in the cortical phase + absence of rim-like enhancement. D: combination of any two above criteria. *Compared with criterion D on AUC. P values were calculated using Delong’s test. RUC, renal urothelial carcinoma; AUC, the area under receiver-operating characteristic curve; CUS, conventional ultrasound; CEUS, contrast-enhanced ultrasound.
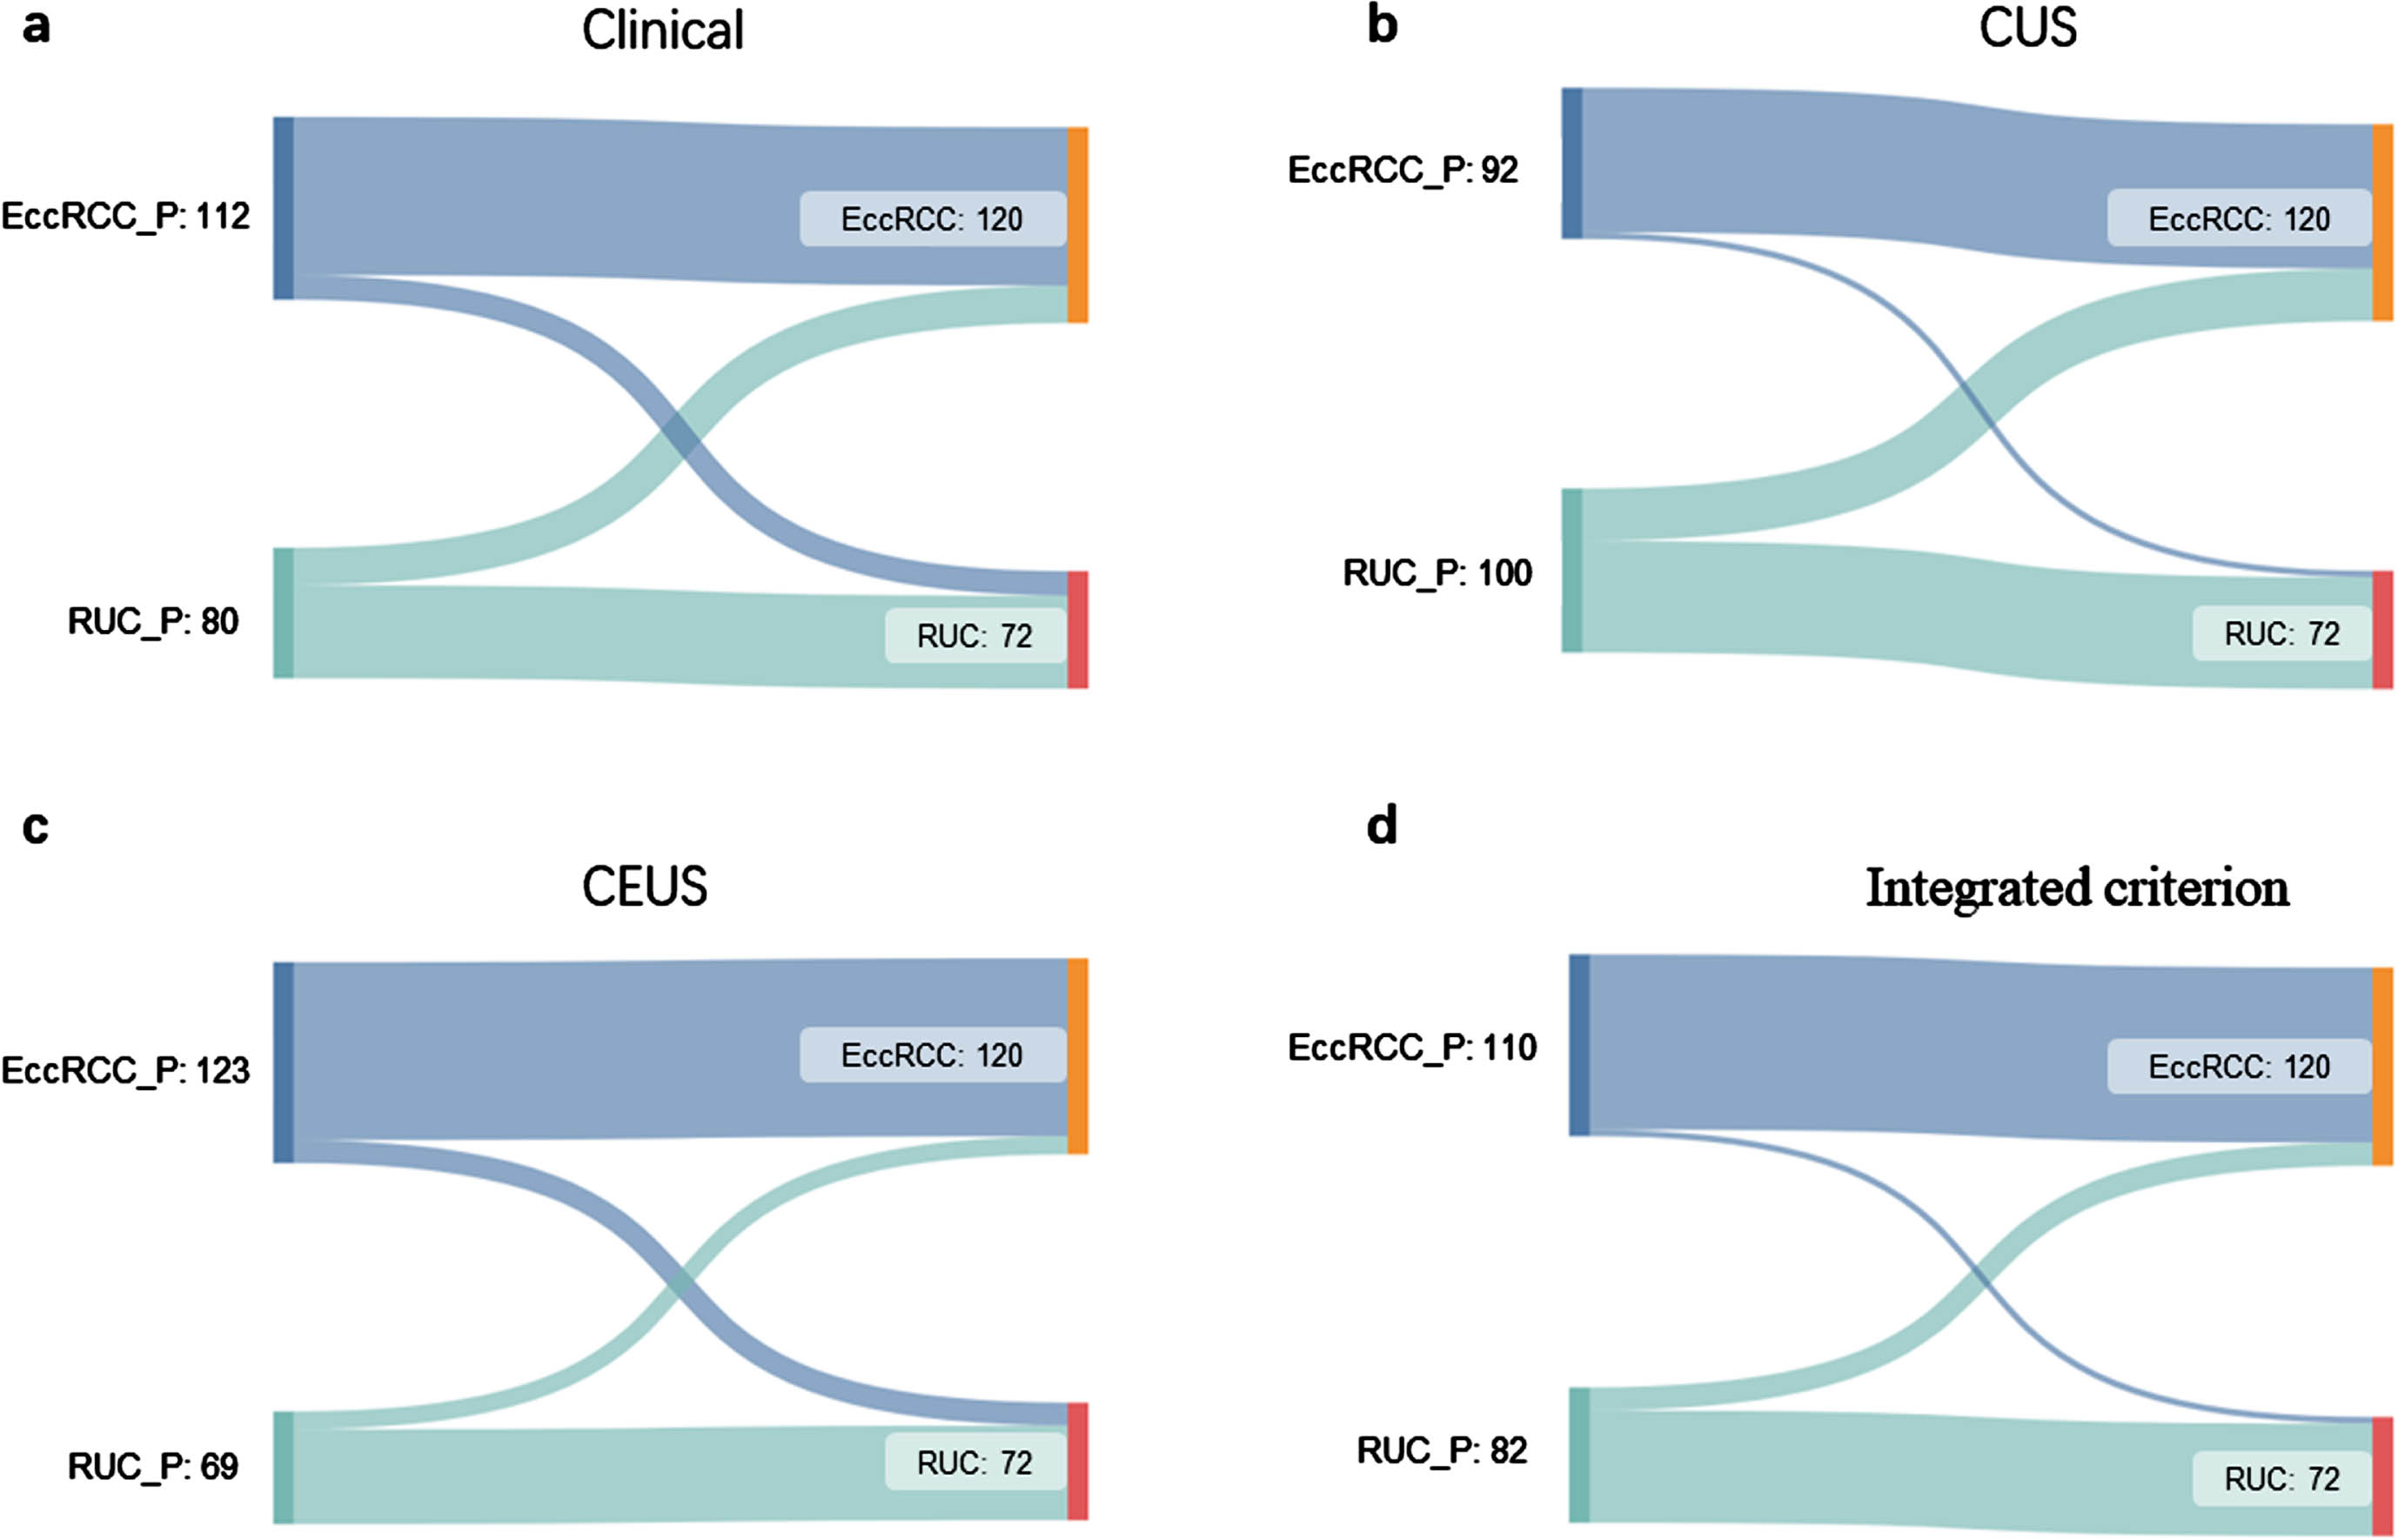
Sankey diagrams showed the distribution of patients. EccRCC or RUC with the suffix “_P” meant the prediction result using respective diagnostic criteria. EccRCC or RUC without any suffix refers to the pathological result. EccRCC, endophytic clear cell renal cell carcinoma; RUC, renal urothelial carcinoma; CUS, conventional ultrasound; CEUS, contrast-enhanced ultrasound.
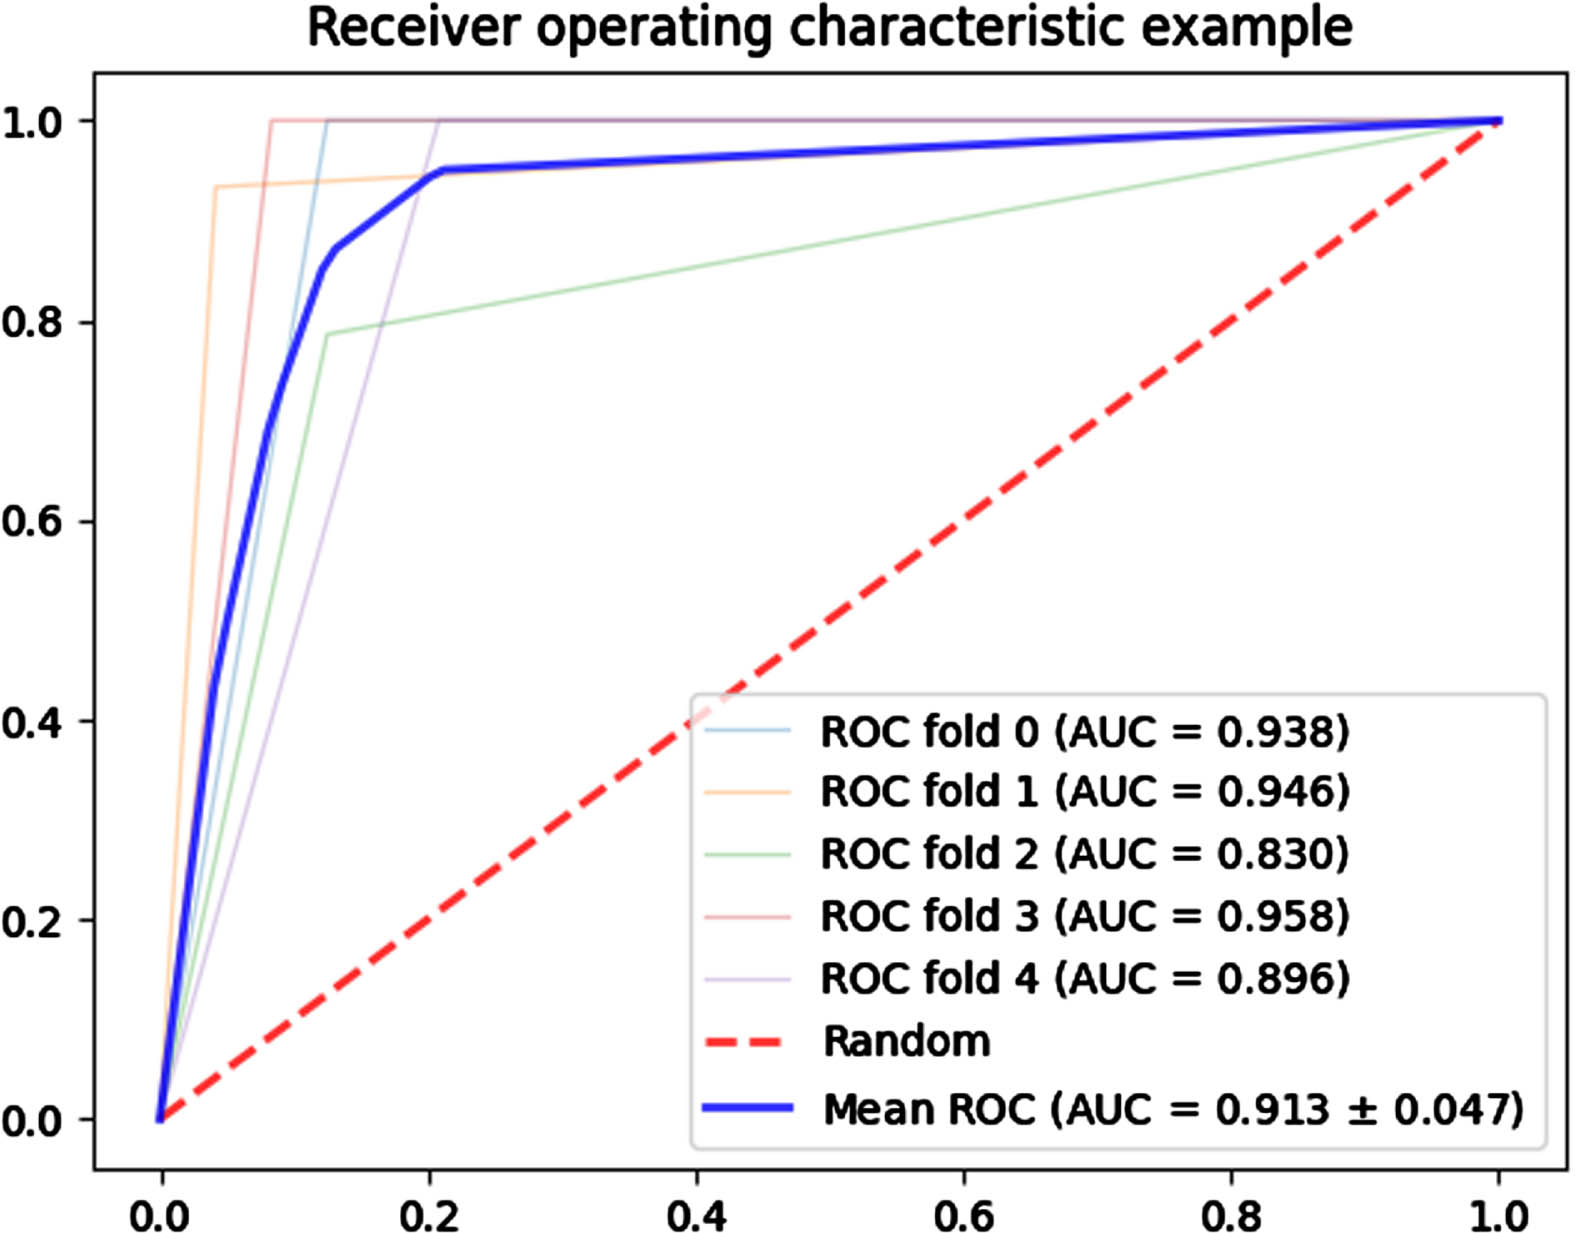
Cross-validation AUC curve. The figure illustrated five Receiver Operating Characteristic (ROC) curves generated by our diagnostic model D through a 5-fold cross-validation process. Each of these curves corresponded to the outcome of each iteration in the 5-fold cross-validation. As evidenced in the figure, all AUC values closely approach 0.9, signifying a high level of diagnostic accuracy of our model.
Both the inter-observer agreement and intra-observer agreement between observers were satisfactory regarding the features of CUS (inter-observer agreement, ICC 0.756–0.907; intra-observer agreement, ICC 0.791–0.918) and CEUS (inter-observer agreement, ICC 0.777–0.873; intra-observer agreement, ICC 0.906–0.934. There was excellent reliability between readers for morphology (ICC, 0.907; 95% CI: 0.879, 0.930) and good reliability for parenchyma phase (ICC, 0.873; 95% CI: 0.835, 0.903) measurements. Excellent intra-observer agreement was observed for vascularity (ICC, 0.918; 95% CI: 0.893, 0.938) and non-enhancement area (ICC, 0.934; 95% CI: 0.913, 0.950). More details can be seen in Table 7.
ICCs for inter-observer and intra-observer agreement according to features of conventional ultrasound and contrast-enhanced ultrasound
ICCs for inter-observer and intra-observer agreement according to features of conventional ultrasound and contrast-enhanced ultrasound
ICC, intra-class correlation coefficient; CI, Confidence Interval; CUS, conventional ultrasound; CEUS, contrast-enhanced ultrasound.
It has been reported that 3–14% of RCCs have collective system invasion [25, 26], which may easily be misdiagnosed as RUC. However, RUC generally necessitates more intensive therapeutic interventions in comparison to EccRCC, owing to its predisposition towards greater invasiveness and metastasis. Therefore, an accurate diagnosis is of crucial importance in devising an effective therapeutic strategy. In this study, multivariate logistic regression analysis aided in screening for characteristics of statistical significance between RUCs and EccRCCs. Our results showed that a combination of clinical features and CUS/CEUS features as a criterion was able to differentiate between RUC and EccRCC with an AUC of up to 0.914 (95% CI 0.868–0.959), corresponding sensitivity of 94.4%, and specificity of 88.3%.
In terms of clinical feature, our study found that RUC is more prone to cause hematuria due to its high possibility of urothelium invasion, which is consistent with prior studies that have reported the incidence of hematuria in RUC to be 70–80 % [27, 28]. Moreover, according to previous studies [29, 30], UTUCs occur 10–20 years later than RCCs. Our research additionally identified older median age among the RUC group, corroborating earlier reported findings.
In the CUS, we have observed that the distinctive features of RUC compared to EccRCC were an irregular shape, hypo-echo, and hydronephrosis. By contrast, EccRCC exhibits a regular shape, perhaps due to its less invasive nature. Moreover, some previous reports considered hypo-echo as an important feature of RUCs [23, 31]. We speculated that urothelial tumors have relatively smaller vessels, lacking large arteries or veins, resulting in regions of diminished echogenicity [31]. In our study, hypo-echo was found in 73.6% of RUCs. Spearman correlation analysis was performed to found that there was a positive correlation between RUCs /EccRCCs and echogenicity (rho = 0.382, P < 0.001), indicating that this feature could aid in differentiating RUCs and EccRCCs.
In our study, the proportion of iso-/hypo-enhancement in cortical phase of RUC was significantly larger than that found in EccRCC, which was consistent with previous reports [4, 32]. The enhancement intensity in cortical phase is related to reflux from the renal vein or arterio-venous fistulas [33]. Non-RCC renal malignancies are mostly hypo-vascular tumors with low blood supply [34]. Therefore, RUCs typically show persistent hypo-enhancement in cortical phase. On the contrary, most ccRCCs are characterized by extensive angiogenesis and thus feature a “fast wash-in” in cortical phase [35]. Both RUCs and EccRCCs exhibited hypo-enhancement in the parenchyma phase, the former demonstrated this due to poor blood supply, while the latter may be attributed to the presence of abundant micro-vessels and arterio-venous fistulas, which resulted in rapid wash-out of the contrast agent [36].
Rim-like enhancement was associated with EccRCC. The feature referred to as the pseudo-capsule sign is a crucial diagnostic clue for identifying EccRCC. Pseudo-capsules are formed due to the deposition of ischemic necrotic fibrous tissue that is highly vascularized [37]. This may be attributed to the expansive growth of renal carcinoma compressing the surrounding renal parenchyma, which is predominantly observed in early-stage, low-grade RCC [38]. It is worth noting that 5/72 of RUCs in the present study also exhibited the pseudo-capsule sign, which may lie in that the renal pelvis wall was squeezed and stuck close to the tumor, mimicking a tumor capsule.
Non-enhancement areas on CEUS are often associated with hemorrhage, necrosis, and cystic changes in the tumor [34]. Cystic necrosis is size-dependent and is mainly observed in renal tumors larger than 3 cm [39, 40]. During the vascularized phase of tumor growth, the tumor tends to proliferate, and ischemic necrosis may occur when the new blood vessels cannot meet the tumor’s growth requirements, resulting in non-enhancement areas on CEUS [34]. In our study, we found that non-enhancement areas in RUCs were less common compared to EccRCCs. The smaller tumor size in the RUC group (median diameter, 3.4 cm vs 4.2 cm) in our study and the tendency of RUC to grow slowly and rarely undergo necrosis changes may explain the discrepancy of the different proportions of the non-enhancement area.
There were several limitations in our study. Firstly, our retrospective study was conducted in a single center, and only EccRCC and RUCs were evaluated in this study. A larger dataset acquired from multiple centers could potentially improve the diagnostic performance of our criterion further. Secondly, exclusion criterion of “poor image quality that prevented clear display of lesions throughout the process” may incur selection bias. Thirdly, to our knowledge, there is no clear definition of what constitutes a centrally infiltrating renal mass, and the definition we used may be contentious. To reduce ambiguities, this paper references other studies and developed similar criteria for inclusion and exclusion [3, 22].
Conclusion
In conclusion, combining clinical features of age >50 years old and hematuria with imaging features of CUS (size <4.0 cm, hypo-echogenicity, irregular shape, hydronephrosis) and CEUS (absence of non-enhancement area, iso- /hypo-enhancement in cortical phase and absence of rim-like enhancement) was associated with RUC diagnosis. We have defined an appropriate diagnostic criterion of clinical characteristics combined with CUS and CEUS features for differentiating these RUC and EccRCC. Future studies should be conducted in a prospective manner, using larger cohorts to validate our results and to assess whether incorporating CUS/CEUS features into clinical models will improve the ability of practitioners to predict the nature of renal pelvis invasive renal tumors and optimize therapy for these patients.
Footnotes
Acknowledgments
The authors of this research would like to express their gratitude to all the participating clinicians for their support.