Relationship of TNF α -238 G/A (rs 361525) genotypes with TNF α gene expression in liver and pancreas disorders in sample of beta thalassemia major adult Iraqi patients
Available accessResearch articleFirst published online June, 2024
Relationship of TNF α -238 G/A (rs 361525) genotypes with TNF α gene expression in liver and pancreas disorders in sample of beta thalassemia major adult Iraqi patients
Tumor necrosis factor- (TNF) is a crucial physiologic regulator of immune responses, and several disorders have been associated with its dysregulation.
OBJECTIVE:
This study aimed to understand TNF gene expression in adult patients with liver and pancreas disorders and examine the impact of TNF-238 genotypes on this population.
METHODS:
At the Ibn Al-Baladi Hospital in Baghdad, blood samples were collected from forty patients who were diagnosed with beta thalassemia together with pancreatic disease, forty patients who were diagnosed with thalassemia together with liver disorder, and forty patients who were diagnosed with thalassemia without pancreas or liver disorder. For the purpose of establishing a control group, forty samples were collected from persons who were of the same age and gender and seemed to be in good health. All of these individuals were deemed to be older than 18 years old. Through the utilization of real-time polymerase chain reaction (PCR), the level of TNF- gene expression was investigated and assessed. The T-ARMS-PCR method was performed for detection and genotyping of TNF-238 in thalassemia patients and healthy control samples.
RESULTS:
The result showed that TNF gene expression assessment showed that group B (thalassemia patients with liver disorder) had higher folding than other groups while the lowest gene expression was in group D (as control group). Furthermore, the relationship between TNF gene expressions folding with TNF-238 genotypes in beta thalassemia major patients, discovered a considerable increase at GA genotype patients in TNF gene expression level, followed by AA genotype compared to the GG genotype. Furthermore, the results of the current study showed an association between the presence of the mutant (A) allele whether heterozygous (GA) and homozygous (AA) with the TNF- gene expression in thalassemia patients with liver and pancreatic disorders.
CONCLUSION:
Based on the results, it can be concluded that there is a relationship between the presence of the mutant (A) allele, whether heterozygous (GA) or homozygous (AA) of TNF- 238, and TNF- gene expression in liver and pancreatic diseases as well as in patients with thalassemia.
Beta thalassemia is a genetic recessive autosomal dominant blood condition results from decreased or missing synthesis of beta globin chains in hemoglo-bin [1, 2]. It is consider as most prevalent genetic disease worldwide common in certain populations [3, 4, 5]. Severe anemia is caused by major type of thalassemia, involving frequent and systematic blood transfusions [6]. TNF is a potent pro-inflammatory cytokine that amplifies cytokine production and plays a critical role in immune responses [7]. It is a versatile cytokine released by many immune cells, such as macrophages [8]. TNF has a wide range of complex biological actions, including the ability to cause clinical consequences and provide resistance against diseases [9]. Numerous single nucleotide polymorphisms have been discovered in the promoter region of the human TNF gene. One of these SNPs, 238 G/A is change G-to-A SNP at position 238 [10]. The regulatory regions of the gene may change structurally as a result of these SNPs [11, 12], which could impact TNF production or function. The purpose of this study was to ascertain the level of TNF gene expression and the influence of TNF-238 genotypes on the levels of gene expression in adult patients who suffered from liver and pancreatic disorders and had been diagnosed with beta thalassemia major.
Material and method
At Ibn Al-Baladi Hospital in Baghdad, blood samples were collected from a total of 120 patients. Group A consisted of 40 patients with beta thalassemia and pancreatic disease, group B consisted of 40 patients with thalassemia and liver disorder, and group C consisted of 40 patients with thalassemia but without pancreas or liver abnormalities. For the control group D, 40 samples were collected from persons who were older than 18 years old and matched in terms of age and gender. These individuals appeared to be in good condition.
The type of thalassemia was determined after reviewing all medical records at Ibn Al Baladi Hospital for patients, and patients with beta thalassemia major were selected. The groups of patients include both male and female without hepatitis, and checked the levels of ferritin, ALT and amylase for all groups to confirm liver and pancreas disorders.
A volume of 0.25 ml of blood was placed into a sterile 1.5 ml tube containing 0.75 ml of Trizol. The mixture was gently mixed and then stored at 20∘C until it was ready to undergo RNA extraction, using the standard process described by Rio et al. [13]. The Real-Time PCR method was utilized, and the methodology that was published by Teran et al. [14] was carried out appropriately. Using the housekeeping gene GAPDH, this analysis was standardized to an acceptable level. The concentration and purity of RNA were determined using Nanodrop (Bioneer/Korea). The primers for the TNF and housekeeping (GAPDH) genes were built using the NCBI-Gene Bank database and the Primer 3 design tool available online. The primers were supplied by Bioneer, a company based in Korea, as shown in Table 1. In order to prepare the qPCR master mix, the GoTaq® qPCR Master Mix kit was utilized. This kit makes use of SYBR green dye for the purpose of target identification and amplification of the GAPDH gene in a Real-Time PCR system. Table 2 provides a visual representation of the components that make up qPCR reactions. The cycling procedure for the TNF- gene was designed based on the temperature profile provided in Table 3. The T-ARMS-PCR method was performed for detection and genotyping of TNF-238 in thalassemia patients and healthy control samples. This method was carried out as described by Khadim [15]. The data results of q RT-PCR for target and housekeeping gene were analyzed by the relative quantification gene expression levels (fold change), by using the Livak formula where:
Real-time PCR thermal program for gene expression
qPCR step
Temperature
Time
Repeat cycle
Initial Denaturation
95∘C
5 min
1
Denaturation
95∘C
20 sec
45
Annealing/Extention Detection(scan)
60∘C
30 sec
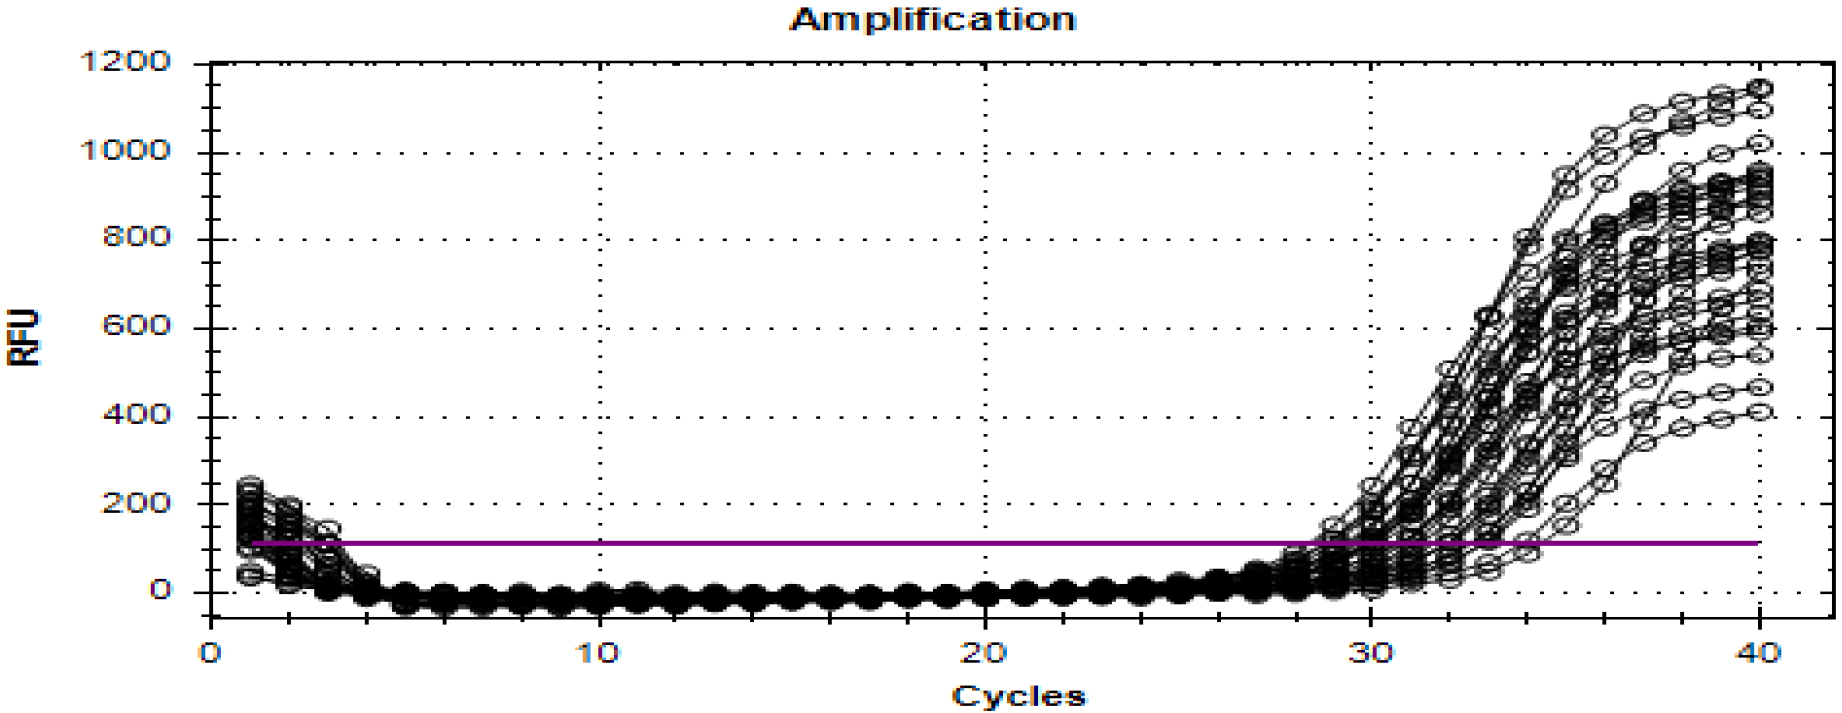
The real time amplification plots of TNF- gene in A group samples.
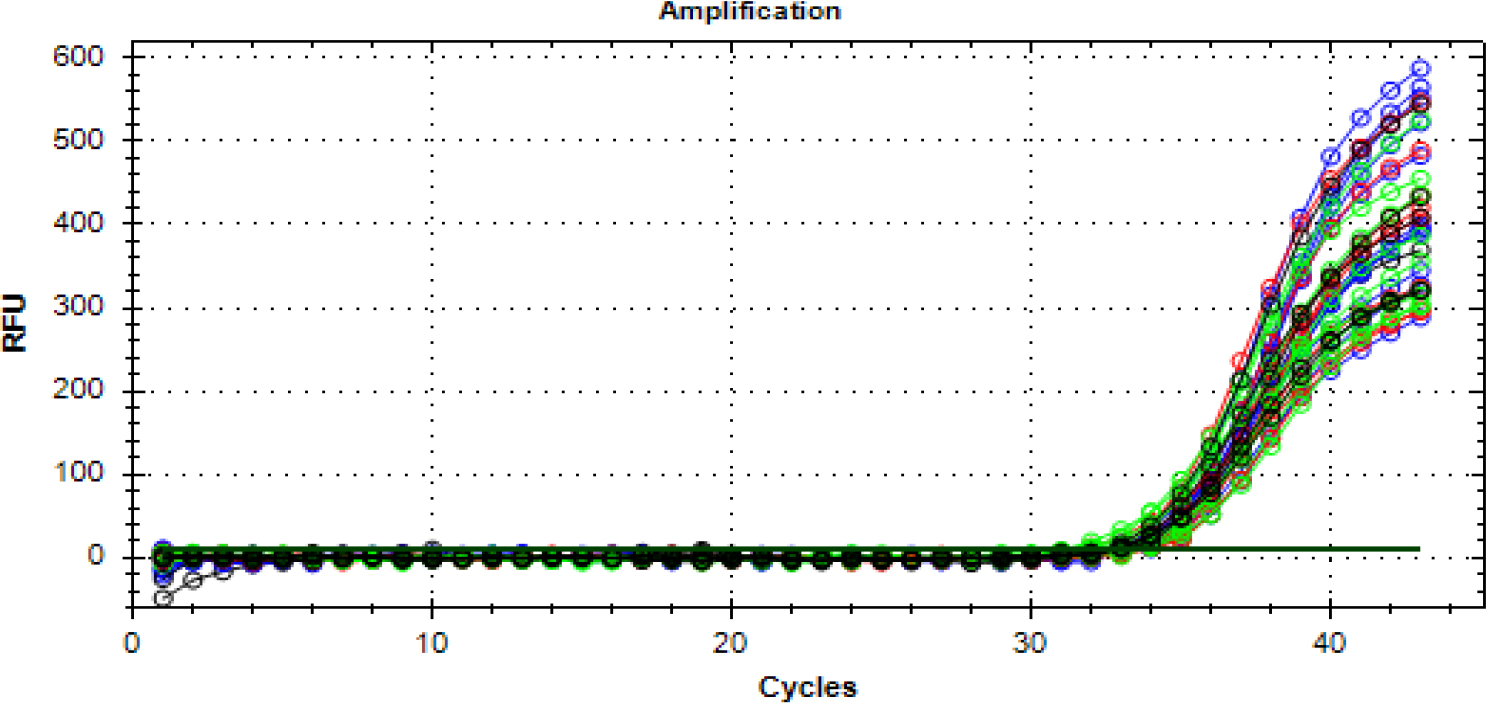
The real time amplification plots of TNF- gene in D group samples.
The results of this study were analyzed by using factorial analysis. The first factor represents four groups, pancreas group A, liver group B, thalassemia group C, and control group D and the second factor represents three genotypes of 238 (GG, GA and AA). General Linear Model was used according to SAS [16]. An analysis known as the Least Significant Differences Test (L.S.D.) was utilized to assess the differences that existed between the means. T. test was used to compare the differences between GAPDH and TNF- genes expression in different groups (A, B, C and D).
Results
According to the analysis of TNF- gene expression between patients with thalassemia and pancreatic abnormalities (group A) and the control group (group D), it was shown that the average folding of TNF- in (group A) was much higher (17.719 2.634) compared to the D group (1.893 0.294). Table 4 and images 1, 2, and 3 demonstrate that these changes were statistically significant ( 0.01), as demonstrated by the statistics.
Comparison between GADPH and TNF- genes expression in A and D groups
Group
Mean SE
CT (GADPH)
CT (TNF)
CT
CT
TNF- folding
Group A
33.456 0.152
28.623 0.183
4.834 0.224
3.934 0.224
17.719 2.634
Group D
33.221 0.182
32.133 0.282
1.088 0.354
0.188 0.354
1.893 0.294
-value
0.325 NS
0.0001**
0.0001**
0.0001**
0.0001**
-test
( 0.05)
( 0.01)
( 0.01)
( 0.01)
( 0.01)
**P0.01, *P⩽ 0.05, NS: Non significant, Group A: thalassemia with pancreas disorders patients, Group D: control.
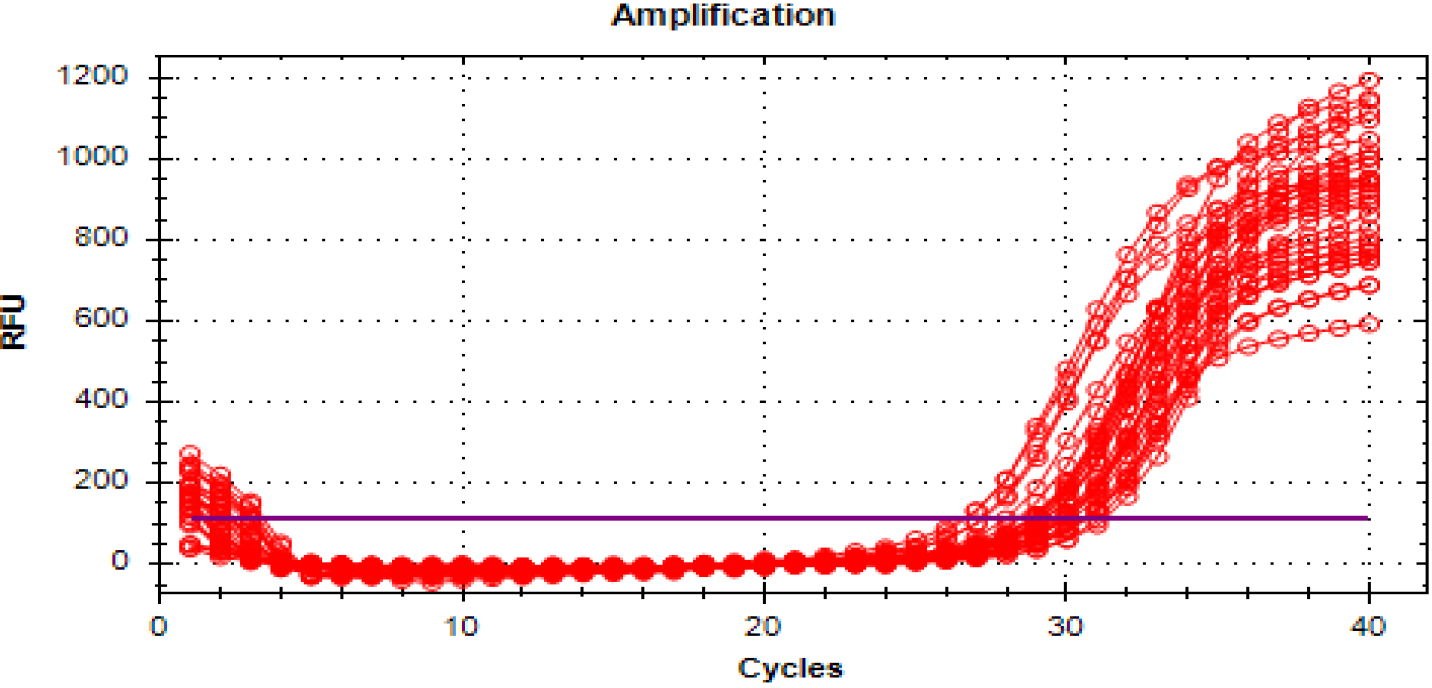
When comparing the TNF- gene expression in patients with thalassemia combined with liver disease (Group B) and the control group (Group D), it was found that the average fold of TNF- in the patients was significantly increased (22.149 2.349) compared with the control group (1.893 0.294). Consistent with the results in Table 5 and Fig. 4, these differences were statistically significant (0.01).
Comparison between GADPH and TNF genes expression in B and D groups
Group
Mean SE
CT (GADPH)
CT (TNF)
CT
CT
TNF folding
Group B
33.423 0.193
28.248 0.140
5.174 0.181
4.274 0.181
22.149 2.349
Group D
33.221 0.182
32.133 0.282
1.088 0.354
0.188 0.354
1.893 0.294
-value
0.450 NS
0.0001**
0.0001**
0.0001**
0.0001**
-test
( 0.05)
( 0.01)
( 0.01)
( 0.01)
( 0.01)
Comparison between GADPH and TNF genes expression in C and D groups
Group
Mean SE
CT (GADPH)
CT (TNF)
CT
CT
TNF folding
Group C
32.752 0.190
28.565 0.194
4.186 0.277
3.286 0.277
14.636 2.215
Group D
33.221 0.182
32.133 0.282
1.088 0.354
0.188 0.354
1.893 0.294
-value
0.079 NS*
0.0001**
0.0001**
0.0001**
0.0001**
-test
( 0.05)
( 0.01)
( 0.01)
( 0.01)
( 0.01)
The real time amplification plots of housekeeping gene GAPDH gene in patient groups and healthy control samples.
The Real time amplification plots of TNF- gene in B group samples.
When comparing the expression of the TNF gene in patients with thalassemia who did not have pancreatic or liver diseases (group C) to the control group (group D), it was observed that there was a notable increase in the average folding of TNF in patients (14.636 2.215) in contrast to the control group (1.893 0.294). In accordance with the data shown in Table 6 and Fig. 5, these differences were found to be statistically significant ( 0.01).
Comparison of TNF- gene expression in A, B, C and D groups
L.S.D (0.01) 6.692**
Groups
TNF expression (folding)
Mean SE
Group A
17.719 2.634a
Group B
22.149 2.349a
Group C
14.636 2.215b
Group D
1.893 0.294c
**( 0.01), different small letters in same column mean significantly differed Group A: pancreas disorder, Group B: liver disorder, Group C: thalassemia without pancreas or liver disorders, Group D: control.
The Real time amplification plots of TNF- gene in C group samples.
The result of comparison of TNF gene expression in patients and control groups showed high gene expression of TNF (fold expression) in all patient groups compared with control group with significant difference ( 0.01), whereas the gene expression of TNF was reached to (22.149 2.349 Fold) in group B which included patients suffered from thalassemia with liver disorders, followed by (17.719 2.634 Fold) in group A which included patients suffered from pancreas disorders, and (14.636 2.215 Fold) in group C which included patients suffered from thalassemia without liver or pancreas disorders, while in group D (Control) was (1.893 0.294) as illustrated in Table 7.
Effect of TNF- 238 genotypes on TNF gene expression in BTM patients
TNF-238
TNF expression (folding)
L.S.D (0.01) 8.970**
genotypes
Mean SE
GG
10.117 3.127c
GA
29.138 1.741a
AA
19.249 3.199b
Relationship between TNF- 238 genotype and TNF- gene expression in A, B and C groups
Groups
Genotypes 238
L.S.D
GG
GA
AA
(0.05)
Group A
17.296 5.743
26.290 2.427
9.571 4.854
10.207*
Group B
17.615 3.872
31.499 2.678
17.335 5.243
Group C
10.441 4.281
17.625 2.738
15.841 4.281
Table 8 showed that TNF- 238 genotypes had a significant effect on TNF- gene expression in BTM patients. GA had the highest level of gene expression, followed by AA genotypes (29.138 1.741 and 19.249 3.199) and GG genotype (10.117 3.127) with significant differences ( 0.01).
The result of the relationship between TNF- gene expression folding with TNF- 238 genotypes in group A, B and C groups, the results discovered a considerable increase in TNF- gene expression level at patients with GA genotype ( 0.05), followed by AA genotype and finally GG genotype. TNF- gene expression was linked to the presence of the mutant (A) allele in liver and pancreatic diseases in thalassemia patients, as shown in Table 9.
Discussion
Thalassemia patients suffer from damage in the liver or pancreas and endocrine glands, the reason is due to thalassemic patients with multiple blood transfusions may have iron deposits that are greater than ferritin’s capability for storage and detoxifying. Furthermore, the extra iron completely saturates transferrin. Thus, free iron (or non-transferrin bound iron NTBI) starts to build up in the blood and tissues. This (free) iron has the potential to catalyze the development of harmful substances, such as (OH), which is produced when substances like hydrogen peroxide [17]. Which hydroxyl radical considered as highly reactive [18].
Each of these molecules has an initial reaction that results in the production of peroxides, which can then interact with other molecules to create cross linkages. These cross-linked molecules either poorly or not at all carry out their typical functions. The reticuloendothelial system is where iron deposits are most commonly seen, but they can also be found in the parenchyma of visceral organs, which can cause serious organ dysfunction. The most often injured organs are the heart, liver, and endocrine glands. The main causes of liver problems in thalassemia are chronic iron overload, biliary blockage, and venous thrombosis. These factors can result in acute hepatic syndromes, but when they become chronic; all three processes can result in fibrosis, cirrhosis, and even, in thalassemia, hepatocellular carcinoma [19]. Given that the body only has a very limited ability to manage these losses, normal daily iron losses are on the range of 1–2 mg, while total body iron stores are approximately 4 g.
The positioning of the TNF- gene within the major histocompatibility complex and its biological functions have led to the suggestion that variations within this region may have a role in the development of many disorders. The TNF- has diverse and intricate biological roles, as it both provides protection against diseases and also leads to the development of pathological problems. TNF- may have an opposing role due to genetic variations in the genes controlling its production and impact [20]. An overproduction of TNF- can also trigger the creation of Reactive Oxygen Species, which are free radicals that can lead to further liver damage and genomic instability [21]. Furthermore, several writers have proposed that the primary factor contributing to the increase in TNF- is the activation of macrophages caused by an excess of iron and the antigenic stimulation resulting from long-term transfusion treatment [22]. No prior studies have addressed this topic, but Crespo et al. [23] found a significant increase in TNF- mRNA expression in nonalcoholic steatohepatitis patients. In addition, a research conducted by Eskandari et al. [24] found that levels of TNF were elevated in patients with heart disease. The study concluded that the production of the proinflammatory cytokine TNF is a significant indication of the severity and prognosis of chronic heart disease patients. Due to its dual properties as both pro- and anti-inflammatory cytokines, TNF is involved in defensive responses. However, when the balance is disrupted, it can cause organ damage. Over expression of TNF is believed to contribute to various diseases. Elevated TNF level in thalassemia patients may be due to iron overload and antigen stimulation due to continuous transfusion therapy [25]. The increase in TNF may be due to excessive iron accumulation and macrophage activation due to long-term transfusion therapy induced antigen stimulation. Activated macrophages engulfed apoptotic erythroid precursors, causing ineffective erythropoiesis [26]. The current study’s findings revealed a significant up regulation of TNF gene expression in all patient groups, which closely aligned with the study conducted by Nasser et al. [27] they found a substantial and statistically significant rise in TNF- levels in patients with beta-thalassemia major (-TM) compared to healthy individuals. The investigation also examined the correlation between TNF- levels, serotonin levels, and ferritin levels in beta-thalassemia major patients in Kut province.
Many researches have studied TNF-linked gene polymorphisms that may directly or indirectly control TNF expression. Abraham and Kroeger [28] and Huizinga et al. [29] observed that the 238 G allele was linked to increase TNF- expression in MS patients. On the other hand, Kaluza et al. [30] reported that the 238A allele down regulates TNF expression. Additionally, Wilson et al. [31] suggested that the A allele does influence TNF gene transcription.
Authors’ contributions
H. A. L. played a significant role in the conceptualization of the study, interpretation and analysis of data, software implementation, validation, formal analysis, investigation, resources, data curation, preparation of the manuscript, and writing-review and editing. B. J. M. also made substantial contributions to the research, including interpretation and analysis of data, validation, writing-review and editing, and supervision of the study. The authors confirm that all authors have read and agreed to the published version of the manuscript, and their combined efforts have resulted in the completion of this work.
Accessibility of information and resources
The authors acknowledge that the data utilized in this study to support its findings are accessible and can be procured from the University of Baghdad’s Institute of Genetic Engineering and Biotechnology for Postgraduate Studies. Requests for data access may be submitted by researchers or individuals with an interest in the subject matter to the corresponding author. The author will oversee the process and offer additional direction.
Ethical considerations
To conduct this research, ethical approval or informed consent was be obtained from the Graduate Institute of Genetic Engineering and Biotechnology, University of Baghdad (Reference number: 15 /5 /2022 – 1304).
Footnotes
Conflict of interest
The authors claim no conflicts of interest.
References
1.
KhalafM.A.Al-SaadiB.Q. and MohammedH.Q., Evaluation of TLR-3, TLR4, IL-7, and IL37 Immunological Markers in β-Thalassemia Major Iraqi Patients, Iraqi Journal of Biotechnology21(1) (2022), 7.
2.
KhalafM.A.Al-SaadiB.Q. and EwaidS.H., Evaluation of AHSP Gene Expression and Its Serum Level in Iraqi β-thalassemia Major Patients.Iraqi Journal of Biotechnology21(2) (2022).
3.
LaftaR.K.SadiqR. and MuhammedZ.B., Burden of Thalassemia in Iraq.Public Health Open Access (PHOA)7(1) (2023), 000242.
4.
Al-AliS. and Al-MusawiR., The relevance of rs 34598529 SNP of HBB gene among β-thalassemic patients dependent on blood transfusions in Thi-Qargovernate.Iraqi Journal of Biotechnology21(2) (2022), 668–676.
5.
IbrahimM.S.FatalG.A. and RasheedM.N., Polymorphism within the 5’UTR genomic region of hepatitis G virus (HGV) isolated from beta-thalassemia population in Iraq.Biomedicine43(1) (2023), 477–481.
6.
ShawkatA.J. and JwaidA.H., Clinical complications of beta-thalassemia major.Iraqi Journal of Pharmaceutical Sciences28(2) (2019), 1–8.
7.
AmeenE.M. and MohammedH.Y., Correlation between Tumor Necrosis Factor – Alfa and Anti-tyrosine Phosphatase with Obesity and Diabetes Type 2. Iraqi Journal of Science63(8) (2022), 3322–3331.
8.
MohammedB.J., TNF-alpha gene polymorphism and its relation to vitamin D, calcium, alkaline phosphatase and ferritin status in Iraqi beta thalassemia patients.Biomedicine42(5) (2022) 14; 906–11.
9.
HusseinA.M. and AliH.Z., Detection of TNF Alpha Level 284 as Biomarker in Different Stages of Cutaneous Leishmaniasis 285 Infection, Iraqi Journal of Science (2022), 3313–3321.
10.
AbdulhameedS.A. and MohammedB.J., The Relationship of Gene Expression between TNF and TNF-Like Cytokine 1A Genes in Sample of Multiple Sclerosis Iraqi Patients.Iraqi Journal of Biotechnology21(2) (2022), 88–95.
11.
AbedR.M.AbdulmalekH.W.YaaqoobL.A.AltaeeM.F. and KamonaZ.K., Genetic Polymorphism of TLR5 and TLR6 in Iraqi Patients with Heart Failure Disease.Iraqi Journal of Science64(4) (2023), 1662–1674.
12.
LuaibiH.A. and MohammedB.J., Does TNF-α 308 G/A (rs1800629) gene polymorphism associate with liver and pancreas disorders in Iraqi adults with beta thalassemia major? Human Antibodies31(4) (2024), 99–105.
13.
RioD.C.AresM.HannonG.J. and NilsenT.W., Purification of RNA using TRIzol (TRI reagent).Cold Spring Harbor Protocols (6) (2010), pdb–prot5439.
14.
TeránM.M.MónacoM.E.LazarteS.S.HaroC.LedesmaE.AchemN.AsensioA. and IsséB.A., Genetic Regulation of Redox Balance in β-Thalassemia Trait.Hemoglobin44(2) (2020), 122–127.
15.
KhadimS.A., Biological Correlation Between TNF-α 238 G/A Gene Polymorphisms and Gallstone Formation among IRAQI Patients.World Journal of Pharmaceutical Research4(3) (2015).
16.
SAS. Statistical Analysis System, User’s Guide. Statistical. Version 96th ed. SAS. Inst. Inc. Cary. NC. USA, (2018).
17.
GutteridgeJ.M.RowleyD.A. and HalliwellB., Superoxide-dependent formation of hydroxyl radicals in the presence of iron salts. Detection of ‘free’ iron in biological systems by using bleomycin-dependent degradation of DNA.Biochemical Journal199(1) (1981) 1, 263–5.
18.
BaconB.R. and BrittonR.S., The pathology of hepatic iron overload: a free radical – mediated process? Hepatology11(1) (1990) 1, 127–37.
19.
Kassab-ChekirA.LaradiS.FerchichiS.KhelilA.H.FekiM.AmriF.SelmiH.BejaouiM. and MiledA., Oxidant, antioxidant status and metabolic data in patients with beta-thalassemia.Clinica Chimica Acta338(1-2) (2003) 1, 79–86.
20.
ElahiM.M.AsotraK.MatataB.M. and MastanaS.S., Tumor necrosis factor alpha- 308 gene locus promoter polymorphism: an analysis of association with health and disease.Biochimica et Biophysica Acta (BBA)-Molecular Basis of Disease1792(3) (2009), 163–172.
21.
WangZ.LiZ.YeY.XieL. and LiW., Oxidative stress and liver cancer: etiology and therapeutic targets. Oxidative medicine and cellular longevity, (2016).
22.
LombardiG.MateraR.MinerviniM.M.CascavillaN.D’ArcangeloP.CarotenutoM. and MustoP., Serum levels of cytokines and soluble antigens in polytransfused patients with beta-thalassemia major: relationship to immune status.Haematologica79(5) (1994), 406–412.
23.
CrespoJ.FernP.HernM.MayorgaM. and Pons-RomeroF., Gene expression of tumor necrosis factor [alpha] and TNF-receptors, p55 and p75, in nonalcoholic steatohepatitis patients.Hepatology34(6) (2001), 1158–1163.
24.
EskandariV.AmirzargarA.A.MahmoudiM.J.RahnemoonZ.RahmaniF.SadatiS. and RezaeiN., Gene expression and levels of IL-6 and TNFα in PBMCs correlate with severity and functional class in patients with chronic heart failure, Irish Journal of Medical Science187 (2018) (1971-), 359–368.
25.
HassoonI.J., Study of Some Innate Immune Parameters Associated with B-Thalassemia in Basrah Province, MSc-thesis submitted College of Science, University of Basrah, (2021).
26.
AngelucciE.BaiH.CentisF.BaftiM.S.LucarelliG.MaL. and SchrierS., Enhanced macrophagic attack on beta-thalassemia major erythroid precursors, Haematologica8716 (2002), 578–583.
27.
NasserM.M.MaleekM.I. and Al-BadriZ., Relationship of TNF-α gene expression with serotonin and ferritin levels in Beta thalassemia major patients.HIV Nursing23(3) (2023), 1622–1626.
28.
AbrahamL.J. and KroegerK.M., Impact of the-308 TNF promoter polymorphism on the transcriptional regulation of the TNF gene: relevance to disease.Journal of Leukocyte Biology66(4) (1999), 562–566.
29.
HuizingaT.W.WestendorpR.G.BollenE.L.KeijsersV.BrinkmanB.M.LangermansJ.A. and PenaA.S., TNF-α promoter polymorphisms, production and susceptibility to multiple sclerosis in different groups of patients.Journal of Neuroimmunology72(2) (1997), 149–153.
30.
KaluzaW.ReussE.GrossmannS.HugR.SchopfR.E.GalleP.R. and HoehlerT., Different transcriptional activity and in vitro TNF-α production in psoriasis patients carrying the TNF-α 238A promoter polymorphism.Journal of Investigative Dermatology114(6) (2000), 1180–1183.
31.
WilsonA.G.SymonsJ.A.McDowellT.L.McDevittH.O. and DuffG.W., Effects of a polymorphism in the human tumor necrosis factor α promoter on transcriptional activation.Proceedings of the National Academy of Sciences94(7) (1997), 3195–3199.