
Abstract
The purpose of our study is to evaluate an analysis indices and fuzzy decision method for human relationships using fuzzy models. Many studies have been conducted on human relationship analysis in various fields which are sociology, psychology, information science and so on. Most popular analysis method in sociology is sociometry analysis. It was proposed by Moreno. Sociometry analysis is a general method for social network analysis and this method is used in various studies. Sumida has detailed results by studying a group of elementary school students from the perspective of pedagogy. Yamashita et al. proposed a fuzzy model for human relationships based on sociometry analysis. Yamashita’s method is generated a partition tree from survey question results and to analyze human relationships based on the partition tree. When sociometry analysis is carried out, there is the disadvantage that it depends on the analyst. As preconditions for analysis, the nodes belonging to the same similarity in the partition tree have already been analyzed. In previous studies, the relationships among the groups belonging to different similarity levels was not specified. Therefore, we have newly developed an analytical method to solve the problem based on Yamashita’s research. In order to evaluate these new analysis indices and fuzzy decision method, we used one example of data and its results. As a result of verification, we were able to obtain results equivalent to those done by experts and confirmed the usefulness of this new method.
Introduction
Many studies have been conducted on human relationship analysis in various field which are sociology, psychology, information science and so on. Most popular analysis method in sociology is sociometry analysis and it was proposed by Moreno [8]. In sociometry analysis, the analyst conducts a questionnaire survey and analyzes based on the survey results from the subjects selected. The results are represented by a diagram called a sociogram. A sociogram is a graph representation of the obtained data. An analyst analyzes sociograms. The method used for analysis differs depending on how the analyst wants to grow the group. In sociometry analysis, one result (sociogram) is obtained for one question. Sociometry analysis is a common analytical method in the field of sociology and pedagogy. However, in sociometry analysis, analysts mostly subjectively analyze on their own, based on their own knowledge. Therefore, analysts are required to have a very high level of knowledge about the field to be analyzed and can-not easily analyze. Yamashita et al. applied fuzzy theory to sociometry analysis [2, 11, 5, 4, 6]. Yamashita’s method consolidated the results obtained from multiple questions into one fuzzy graph. There are differences between the two methods. Sociometry analysis analyzes one-way relationships between subjects. On the other hand, Yamashita’s analysis method analyzed mutual relationships between subjects.
As a result, sociometry analysis revealed superficial consciousness, whereas Yamashita’s method revealed the subconscious mind of the subject indirectly by consolidating multiple question results. The edge value is 0 (non-connection) or 1 (connection) in the sociogram, whereas it is between 0.0 and 1.0 in the fuzzy graph.
Yamashita’s method provided basic methods for automatically analyzing subgroups, opinion leaders, and isolated members. However, human relationships are complex, and analysts are not satisfied only with the results obtained from a quantitative analysis method. For this reason, the method used for analysis differs depending on the purpose of the analyst. Depending on the purpose of the analyst, a directed graph like the sociogram may be more effective or the undirected graph may be more desirable. Therefore, there are both merits and demerits to using either method. Therefore, we aim to provide a new foundation that can analyze both of the two analysis methods.
Also, Yamashita’s method analyzes human relations based on the partition tree. As a precondition for analysis, only nodes belonging to the same similarity level in the partition tree are targets for analysis. Also, the optimal degree of similarity is calculated for which similarity is to be analyzed, and only the optimal similarity is the target of analysis [6]. We also aim to eliminate preconditions and provide a method that can analyze nodes belonging to any degree of similarity. In addition, we will compare the results of analysis using sociometry analysis and the analysis results using fuzzy theory. We evaluate the effectiveness of the analysis method applying fuzzy theory.
This paper is organized as follows: in Section 2 we introduce an analysis method for human relationships, while Section 3 explains the fuzzy model for human relationships. In Section 4, we propose an advanced analysis method for group relationships in human relationships and describe various analysis indices for fuzzy graphs. Section 5 presents a case study and the description of some results obtained through the proposed method. The results of comparative evaluation with sociometry analysis are also shown. Finally, conclusions and plans for future work are presented in Section 6.
Analysis method for human relationships
Various research studies have been made applying human relationships [3, 12]. Therefore, it is very important to analyze human relationships. Various analysis methods for human relationships have been proposed. In this section, we introduce existing analysis methods and their problems.
Sociometry analysis
Sociometry analysis is a measurement method proposed by Moreno as a way of measuring and evaluating the group structure of human relations using tables and figures [8]. Human society consists of mutually related groups and the group consists of social, economic and cultural ties between individuals. Sociometry analysis focuses on structural analysis in smaller groups, for example, classrooms and workplaces, rather than society as a whole. For analysis, the analyst uses data obtained by asking people to be surveyed: “Who will you choose as a friend (or colleague, advisor, etc.)?”. A graph representation of the obtained data is called a sociogram. In the sociogram, individuals are represented as nodes and selective relationships are represented by an arc.
An example of a sociogram is shown Fig. 1 [17]. Figure 1 shows a relationship between the first and second selected persons, who selected their preferred partners for dinner. The solid line represents the first and the dotted line represents the second selected persons.
An example of sociogram.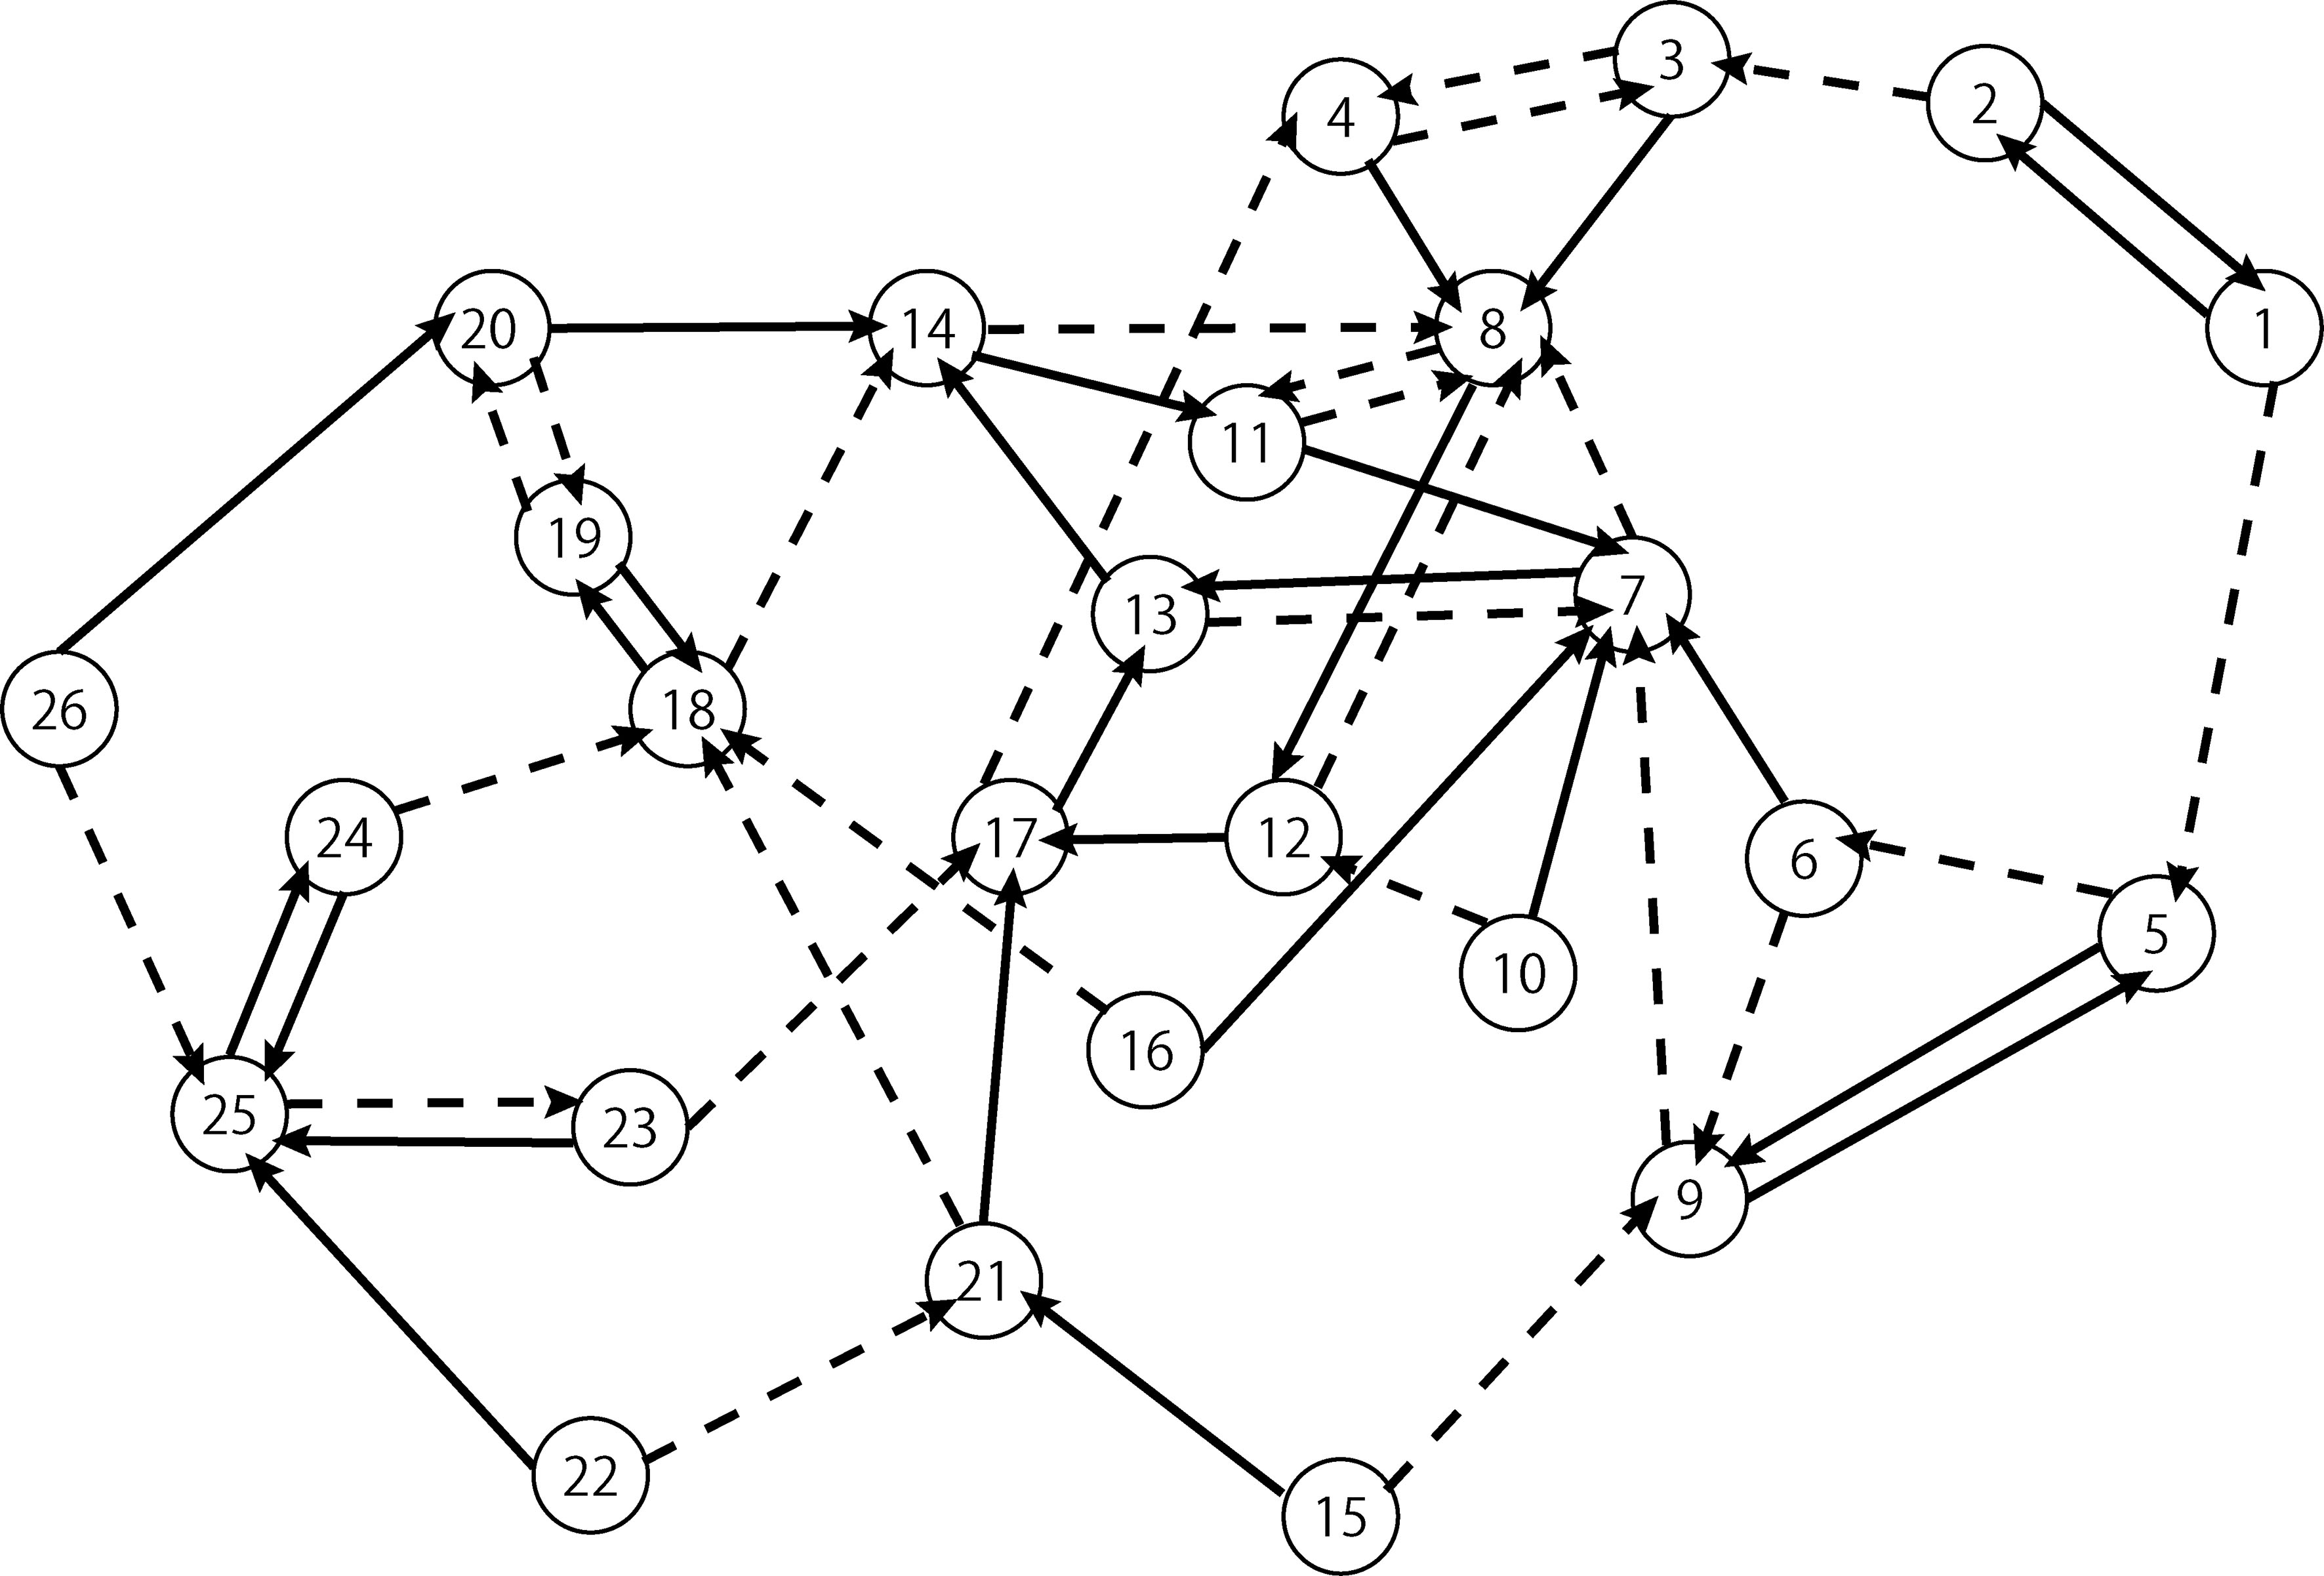
In analyzing human relationships, the most appropriate method for grasping the boundaries of peer group membership and analyzing internal structure is the observation and interview method [9]. In the observation method, the analyst observes the activity of the group for a certain period and confirms the existence of the group by direct external observation. Then, analysts interview each member and check the group boundaries.
From the results of the survey using the observation and interview method, it is possible to analyze the internal structure of the peer group as shown below.
The moment and timing of group formation The purpose of the group The moment of joining the group Emotional relationship to other members
In sociometry analysis, it is possible to analyze and evaluate group structure using only data obtained from simple questions. Sociometry analysis is a method of measuring and analyzing human relations and group structure. Therefore, it is not desirable for grasping the group itself or for clarifying the boundaries of group membership.
Analysis by the observation and interview method allows more detailed analysis than sociometry analysis, such as analysis of inner group structure. On the other hand, the fact that it takes a long time to investigate is a demerit. In a research study on the structure of a peer group of children by Sumida [9], it required approximately 2 weeks to obtain the results of the observation method investigation, and about 5.5 months to obtain results from the survey using the interview method. It takes a long time just for the survey, and presumably, even more time to include analysis. Also, in analysis using the observation and interview method, it is difficult to analyze unless the analyst possesses sophisticated knowledge, such as a specialist in sociology might have. Other methods include extracting interpersonal relationships using motion picture processing [13, 10]. In this method, it is necessary to prepare places and equipment for recording as motion pictures, and it is necessary to consider that the psychological state that results from being recorded affects subjects’ behavior.
In contrast, for human relations analysis applying fuzzy graphs, it is possible to analyze human relationships in a short time using a short question survey.
Fuzzy model for human relationships
In the sociometry analysis, human relationships are evaluated using tables and figures. However, it is not easy to show their features clearly using this method. Also, with the observation and interview method, it is difficult to analyze easily due to the precondition that it requires much time and advanced expertise. By applying fuzzy graph theory to the sociogram, human relationships can be quantitatively analyzed [2, 11, 5, 4, 6, 18].
Fuzzy graph model
Human relationships within the group can be analyzed using data obtained from a simple questionnaire. It is possible to analyze human relationships rationally and more clearly within the group by constructing fuzzy models from results obtained from a simple questionnaire and applying fuzzy clustering and fuzzy similarity.
Response table and response matrix
If we ask on the
Where
Examples of questions are as follows.
Please write your you would like to study in group you would like to take lunch together you would like to do club activities you would like to do volunteer activities
Analyzing the matrix
Analyzing the matrix
On the other hand, a fuzzy graph is defined mathematically as
Cluster analysis for fuzzy graph
Let
The relation
Partition tree from the question survey results.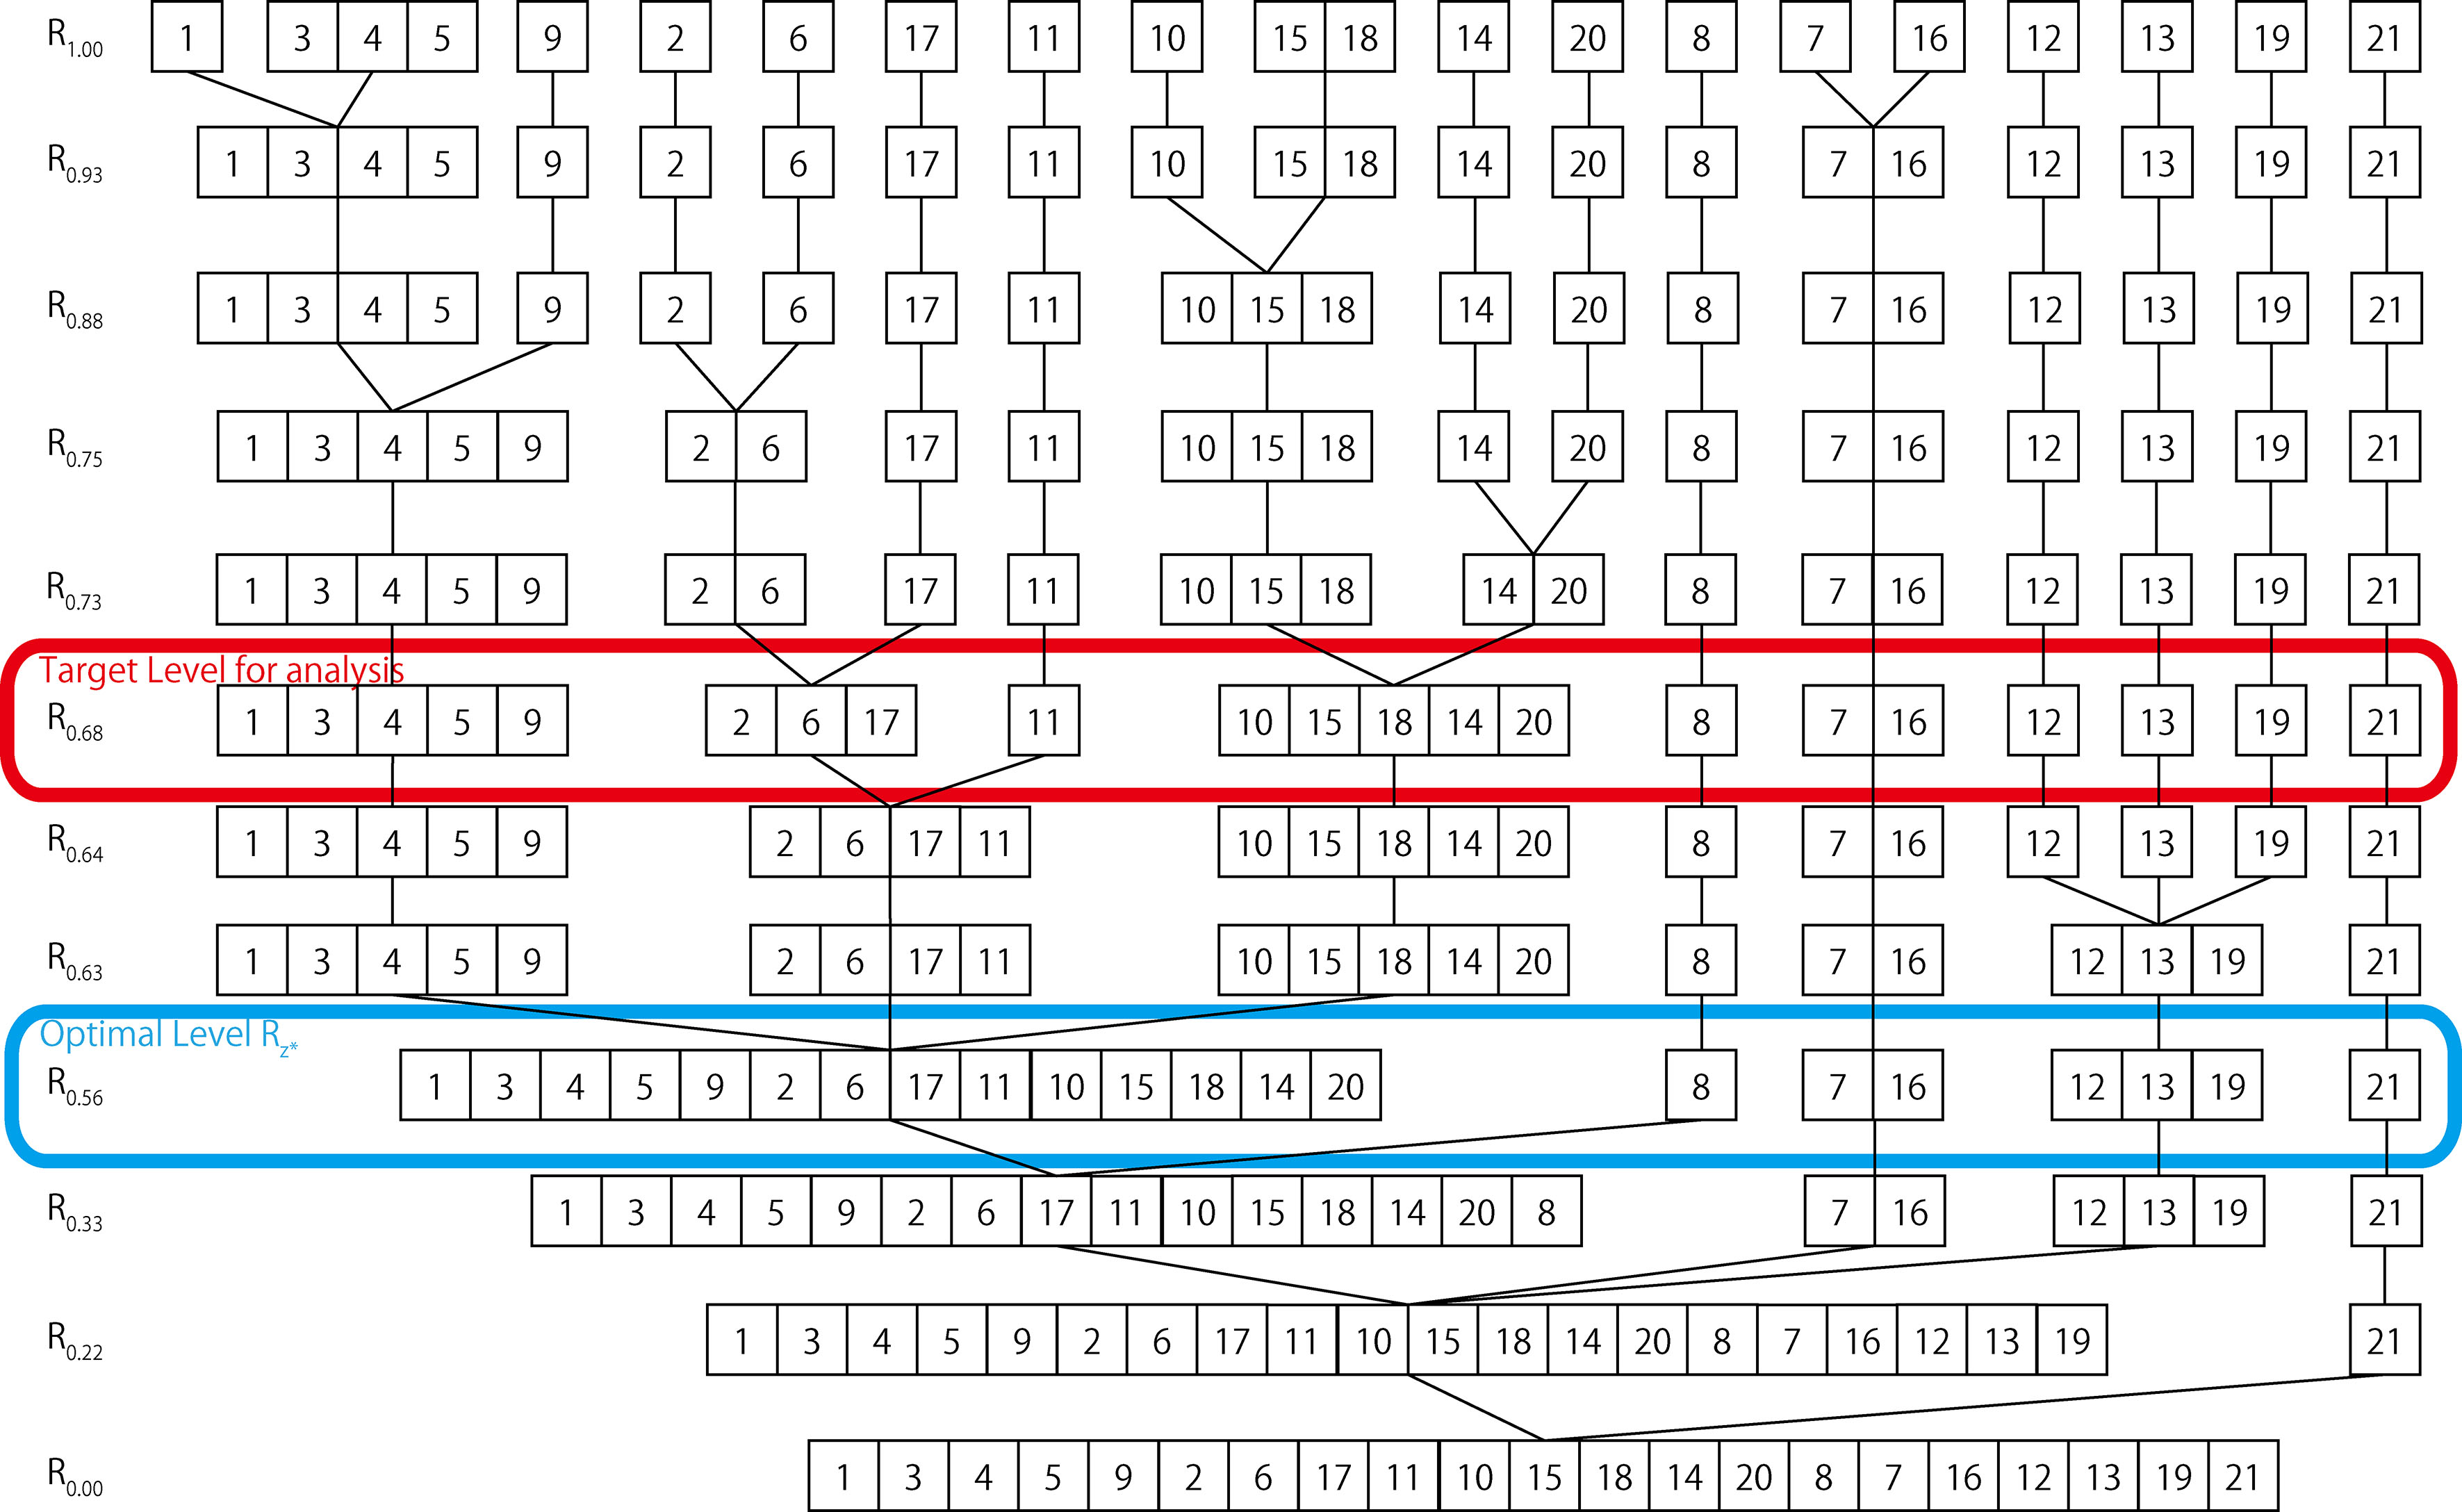
Number of clusters 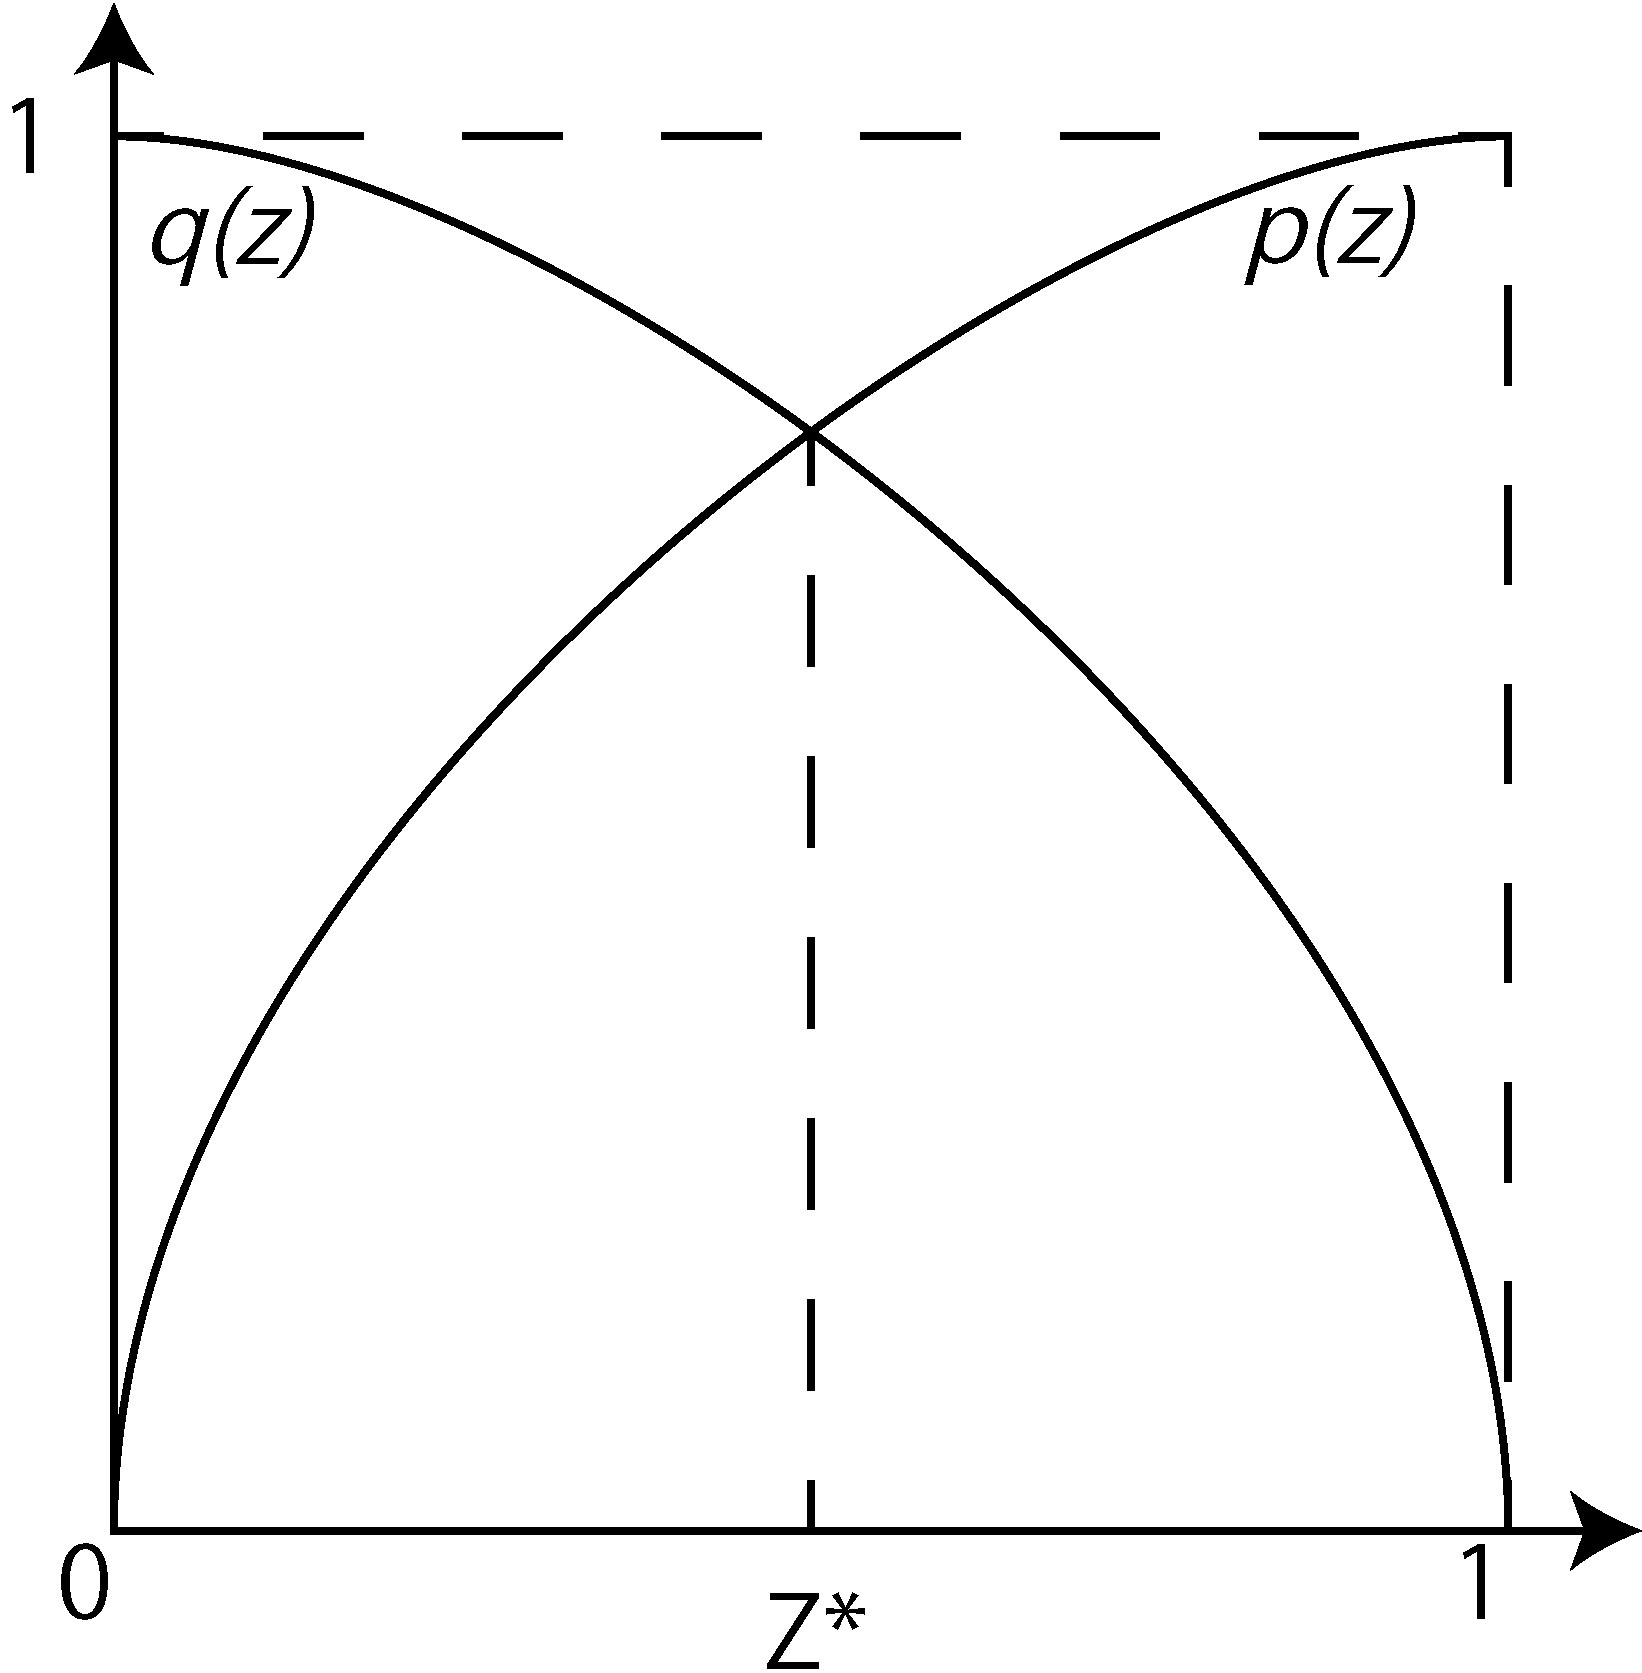
There are multiple similarity levels in the partition tree. It is necessary to decide the similarity level to be used in the analysis. As a method of deciding the to similarity level, various methods were proposed. Shinkai proposed a method applying the fuzzy decision [6].
The number and size of clusters in similarity level
As similarity level
There is a trade off relationship between
There are various indices for analyzing graphs and networks. Besides general analytical indices, there are also indices specialized for the analysis of human relationships. The target fuzzy graph to be analyzed is defined mathematically as
In this section, we introduce the analysis method in which we proposed an advanced analysis method for group relations based on the fuzzy graph and described various indices for analyzing the fuzzy graph [7, 16, 14].
Fuzzy graph density
This is an indicator of closeness and complexity in a relationship. The existing index is the number of links divided by the number of links when all nodes are connected. Generally, edge values of graphs and networks are represented by 0 (no connection) or 1 (connection). However, in fuzzy graphs, edge values range from 0.0 to 1.0. Therefore, the fuzzy density (
This identifies that there is a reachable route from one node to another node. It is possible to identify an isolated member (
Measures centrality from the number of edges connected to the node and identifies the node with the widest relationship to other nodes. Degree Centrality (
The similarity between centrality (SBC) [14] in the two clusters
Thus, in the route from one cluster to another cluster, the degree of contribution to the route with the highest degree of association is specified.
In the fuzzy graph, a group is replaced as one node (hereafter referred to as a cluster node).
At this time, the number of elements (cluster size)
When aggregating is based on the average, setting arbitrary cluster nodes
In human relationship analysis applying the fuzzy graph, a partition tree is used. In the partition tree, it is clustered for each similarity level. The existing analysis method is a relation analysis of nodes belonging to the same similarity level. When the similarity level of the partition tree changes, the cluster structure also changes according to the similarity level. When analyzing the relationship between clusters, one cluster size may be too large or too small. Therefore, by analyzing two clusters belonging to different similarity levels, it is possible to analyze them with the same cluster size. Let the clusters to be analyzed be
Fuzzy graph (similarity level 
In this section, we analyze using a fuzzy graph model based on the collective question survey from 21 students in an elementary school class which was carried out by Sumida [9].
Question survey
M. Sumida conducted the question surveys for 21 elementary school students. Considering that it is a collective question survey in elementary school, he excluded negative selection/nomination criteria. The 8 questions used for question survey are shown below.
Please write your favorite friend’s name in this class. There is no limit on the number of selections. Please write the name of a friend who always plays with you. There is no limit on the number of selections. Please write the name of a friend who played with you after you returned home yesterday. There is no limit on the number of selections. Who are the group members with whom you play together in this class? Please write the names of all group members. Who are your friendly group members in this class? Please write the names of all group members. Please write the name of a friend who always plays with you after you go home. There is no limit on the number of selections. Who are the group members with whom you play together after going home? Please write the names of all group members. Who friendly group members with whom you are friendly after going home? Please write the names of all group members.
SBC from cluster 89 to cluster 90.
In this section, we will show the result of analyzing the question survey with 21 students.
The partition tree created from the response matrix from the above question survey results is shown in Fig. 2.
Also, Fig. 4 that we show is a fuzzy graph showing similarity level
Analysis of SBC
The results of SBC analysis from cluster 89 to cluster 90 are shown in Fig. 5. From Fig. 5, it is possible to give the greatest influence by mediating node 1.
Analysis of CLR
The results of CLR on the two clusters 89 and 90 of Fig. 4 are shown in Fig. 6. According to the analysis result of CLR, the relationship between the two clusters was 0.35. From this result, it can be read intuitively that these two clusters have slightly friendly relations.
CLR between cluster 89 and 90.
DCR between cluster 2 and 90.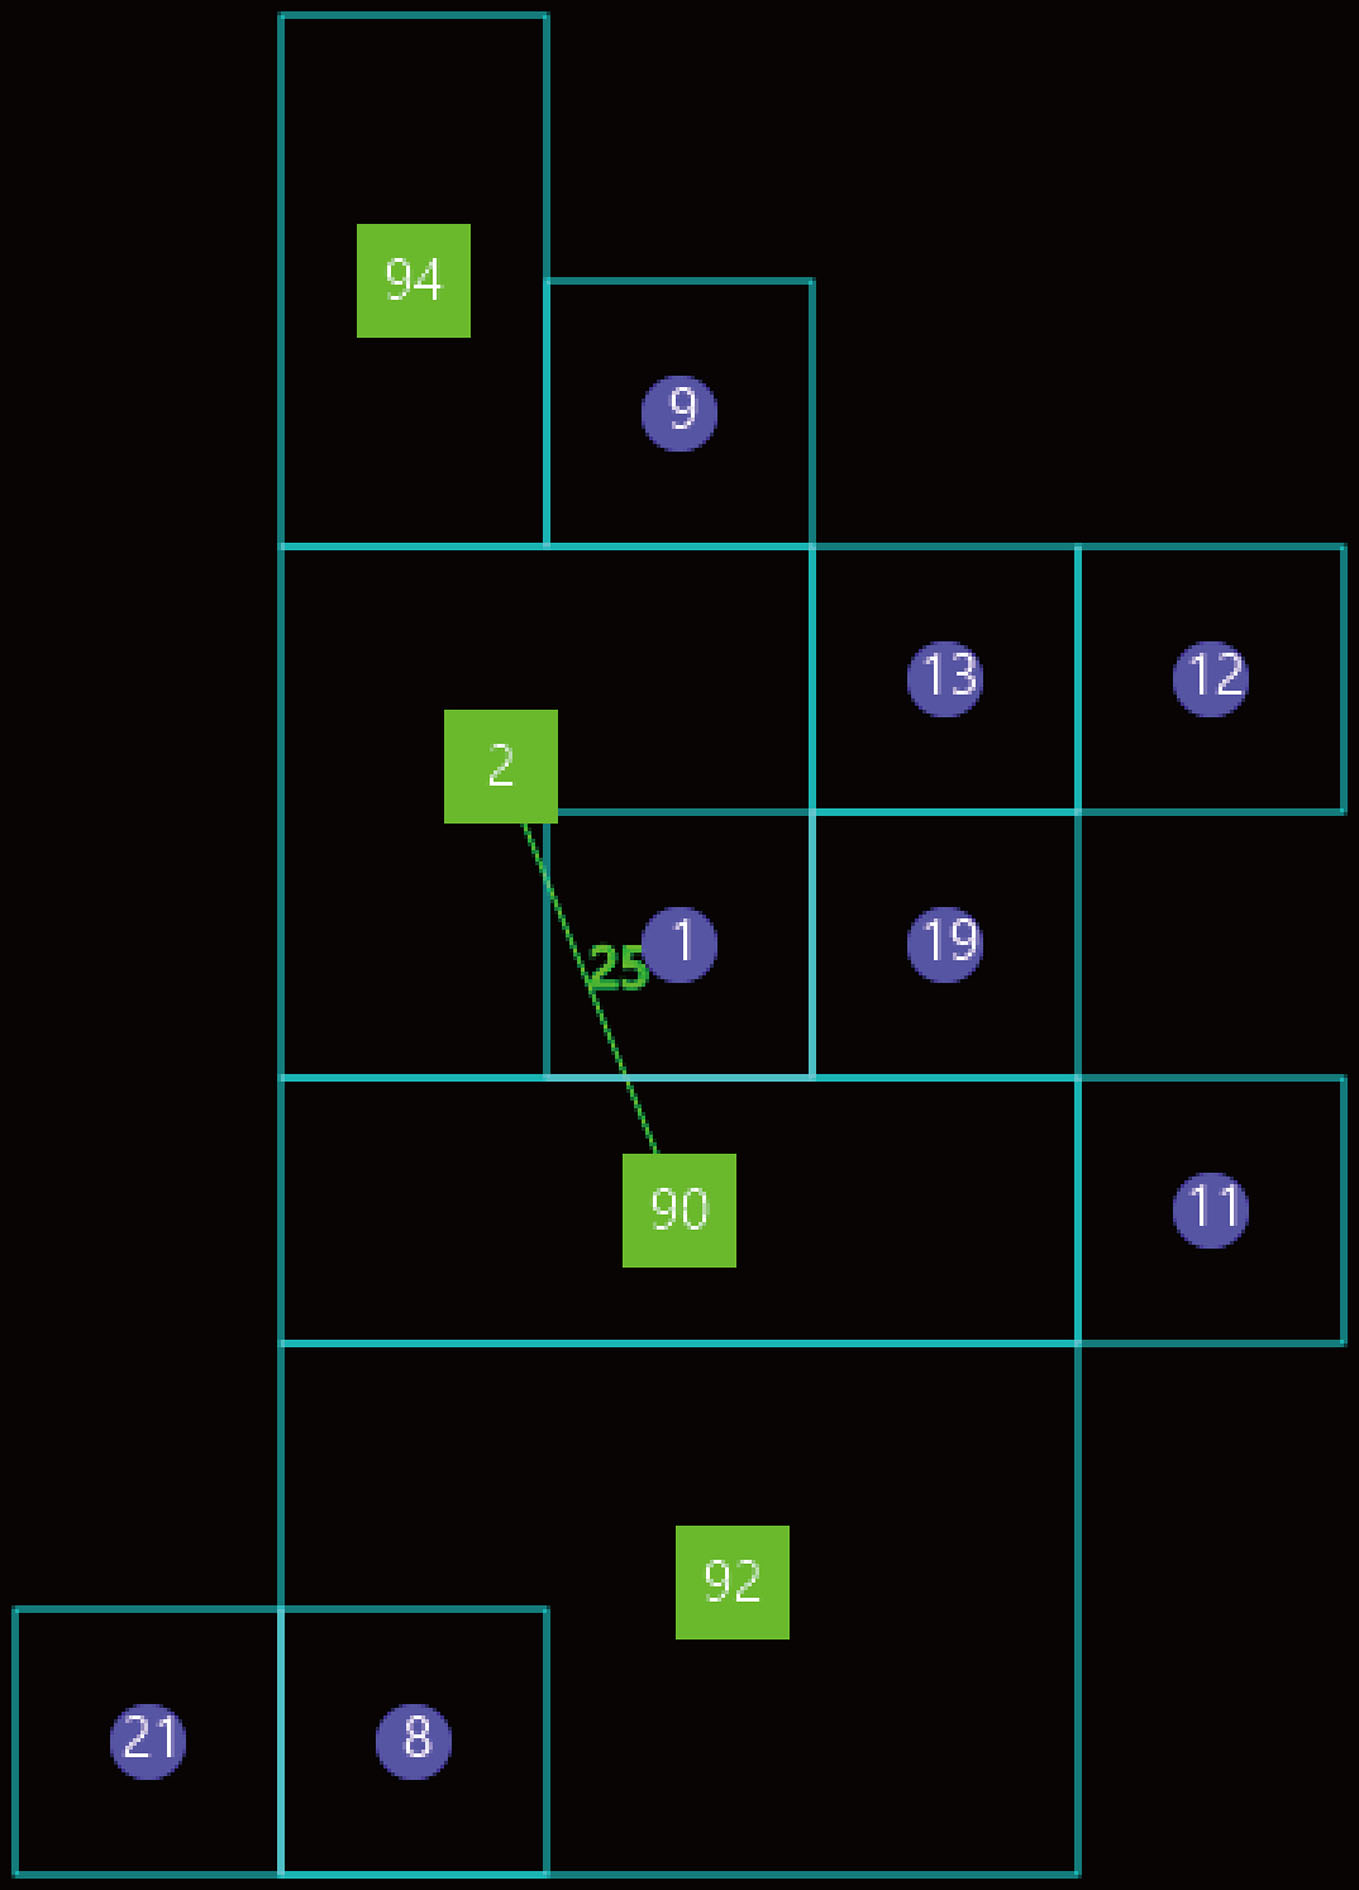
DCR between node 1 and cluster 90.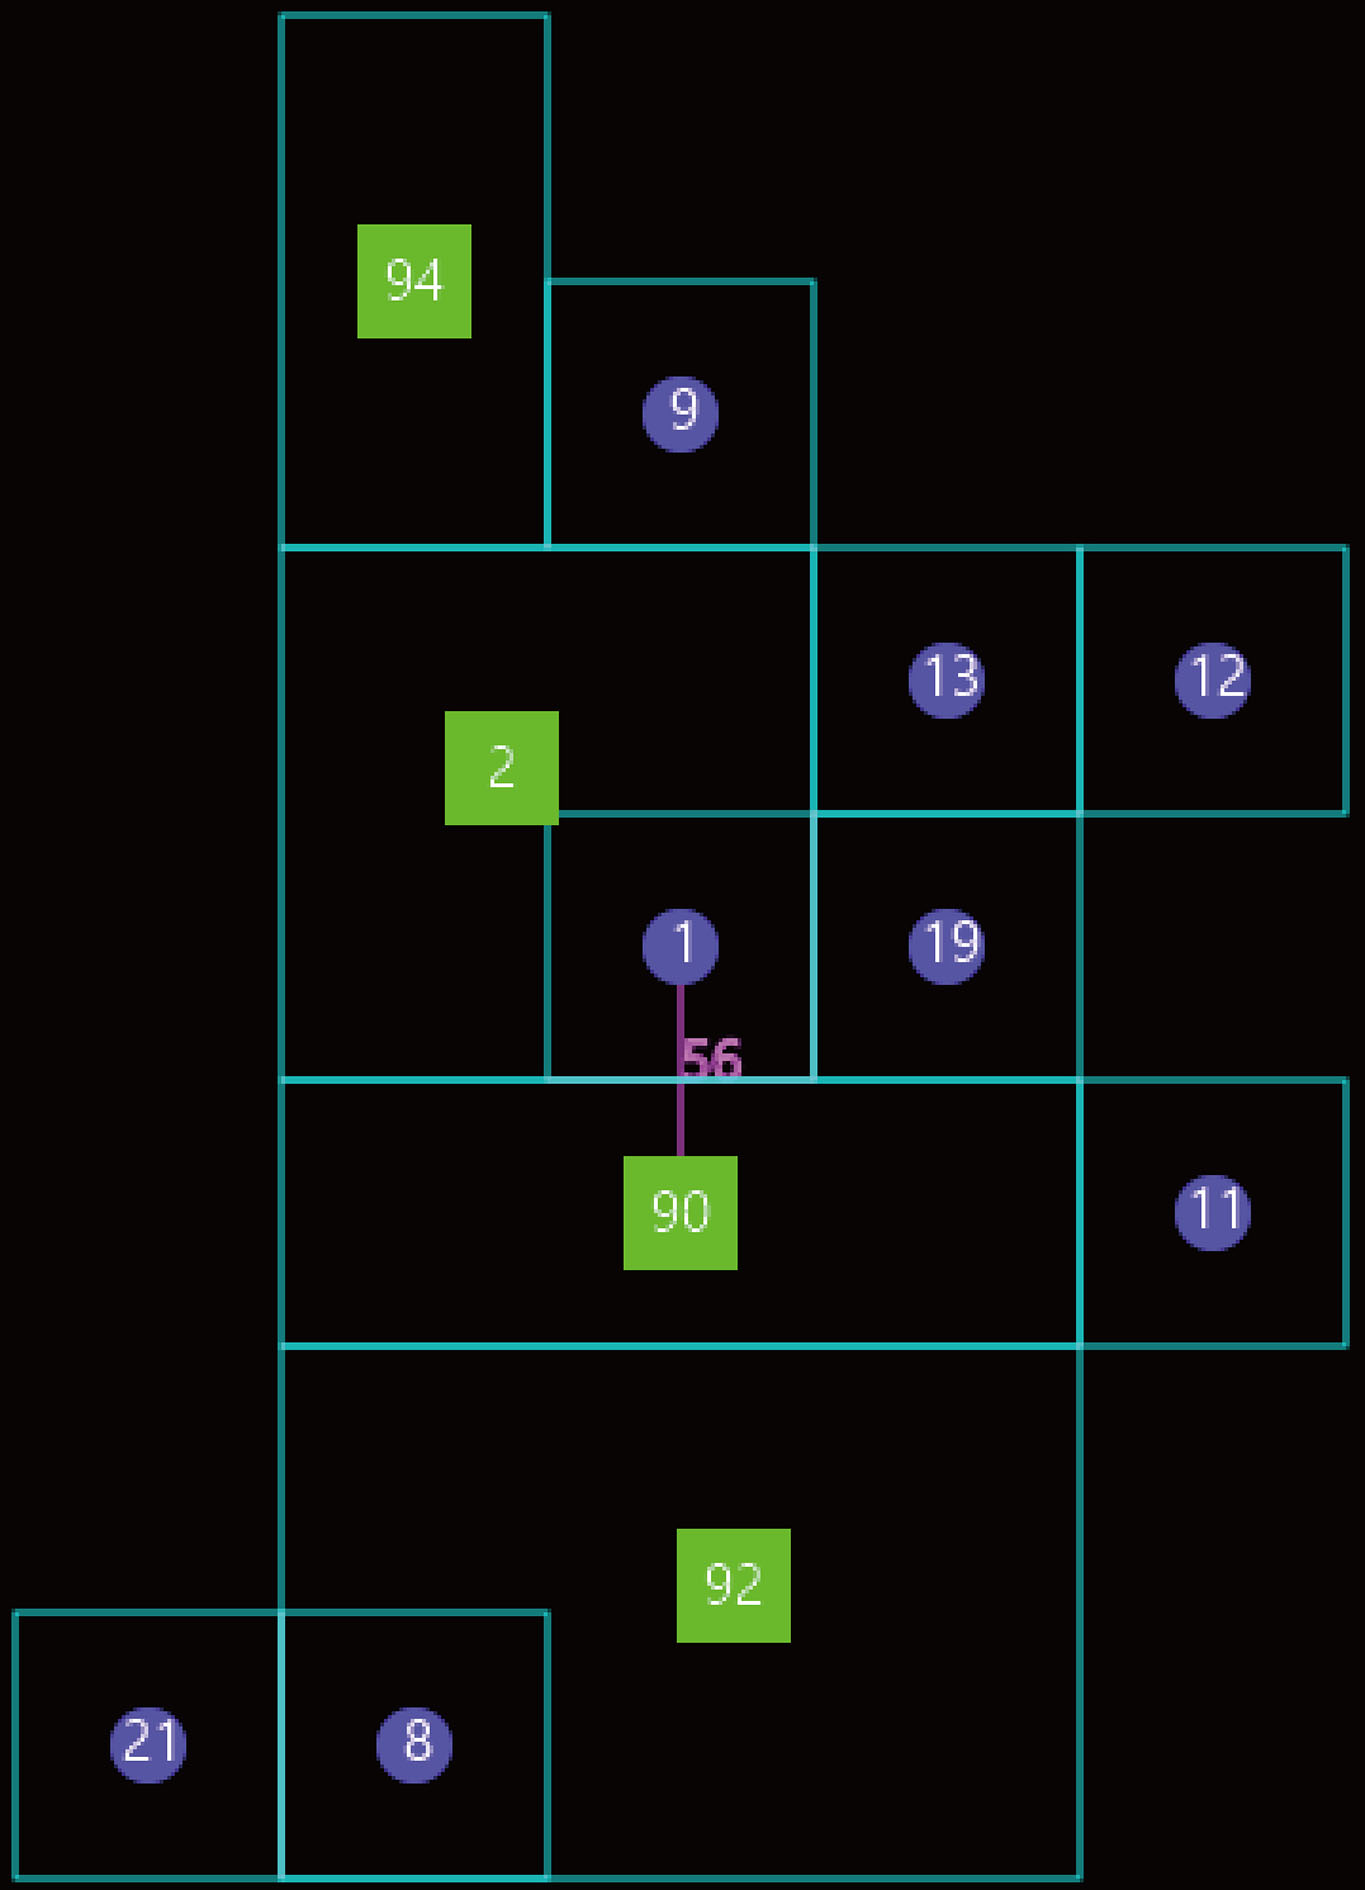
Fuzzy graph (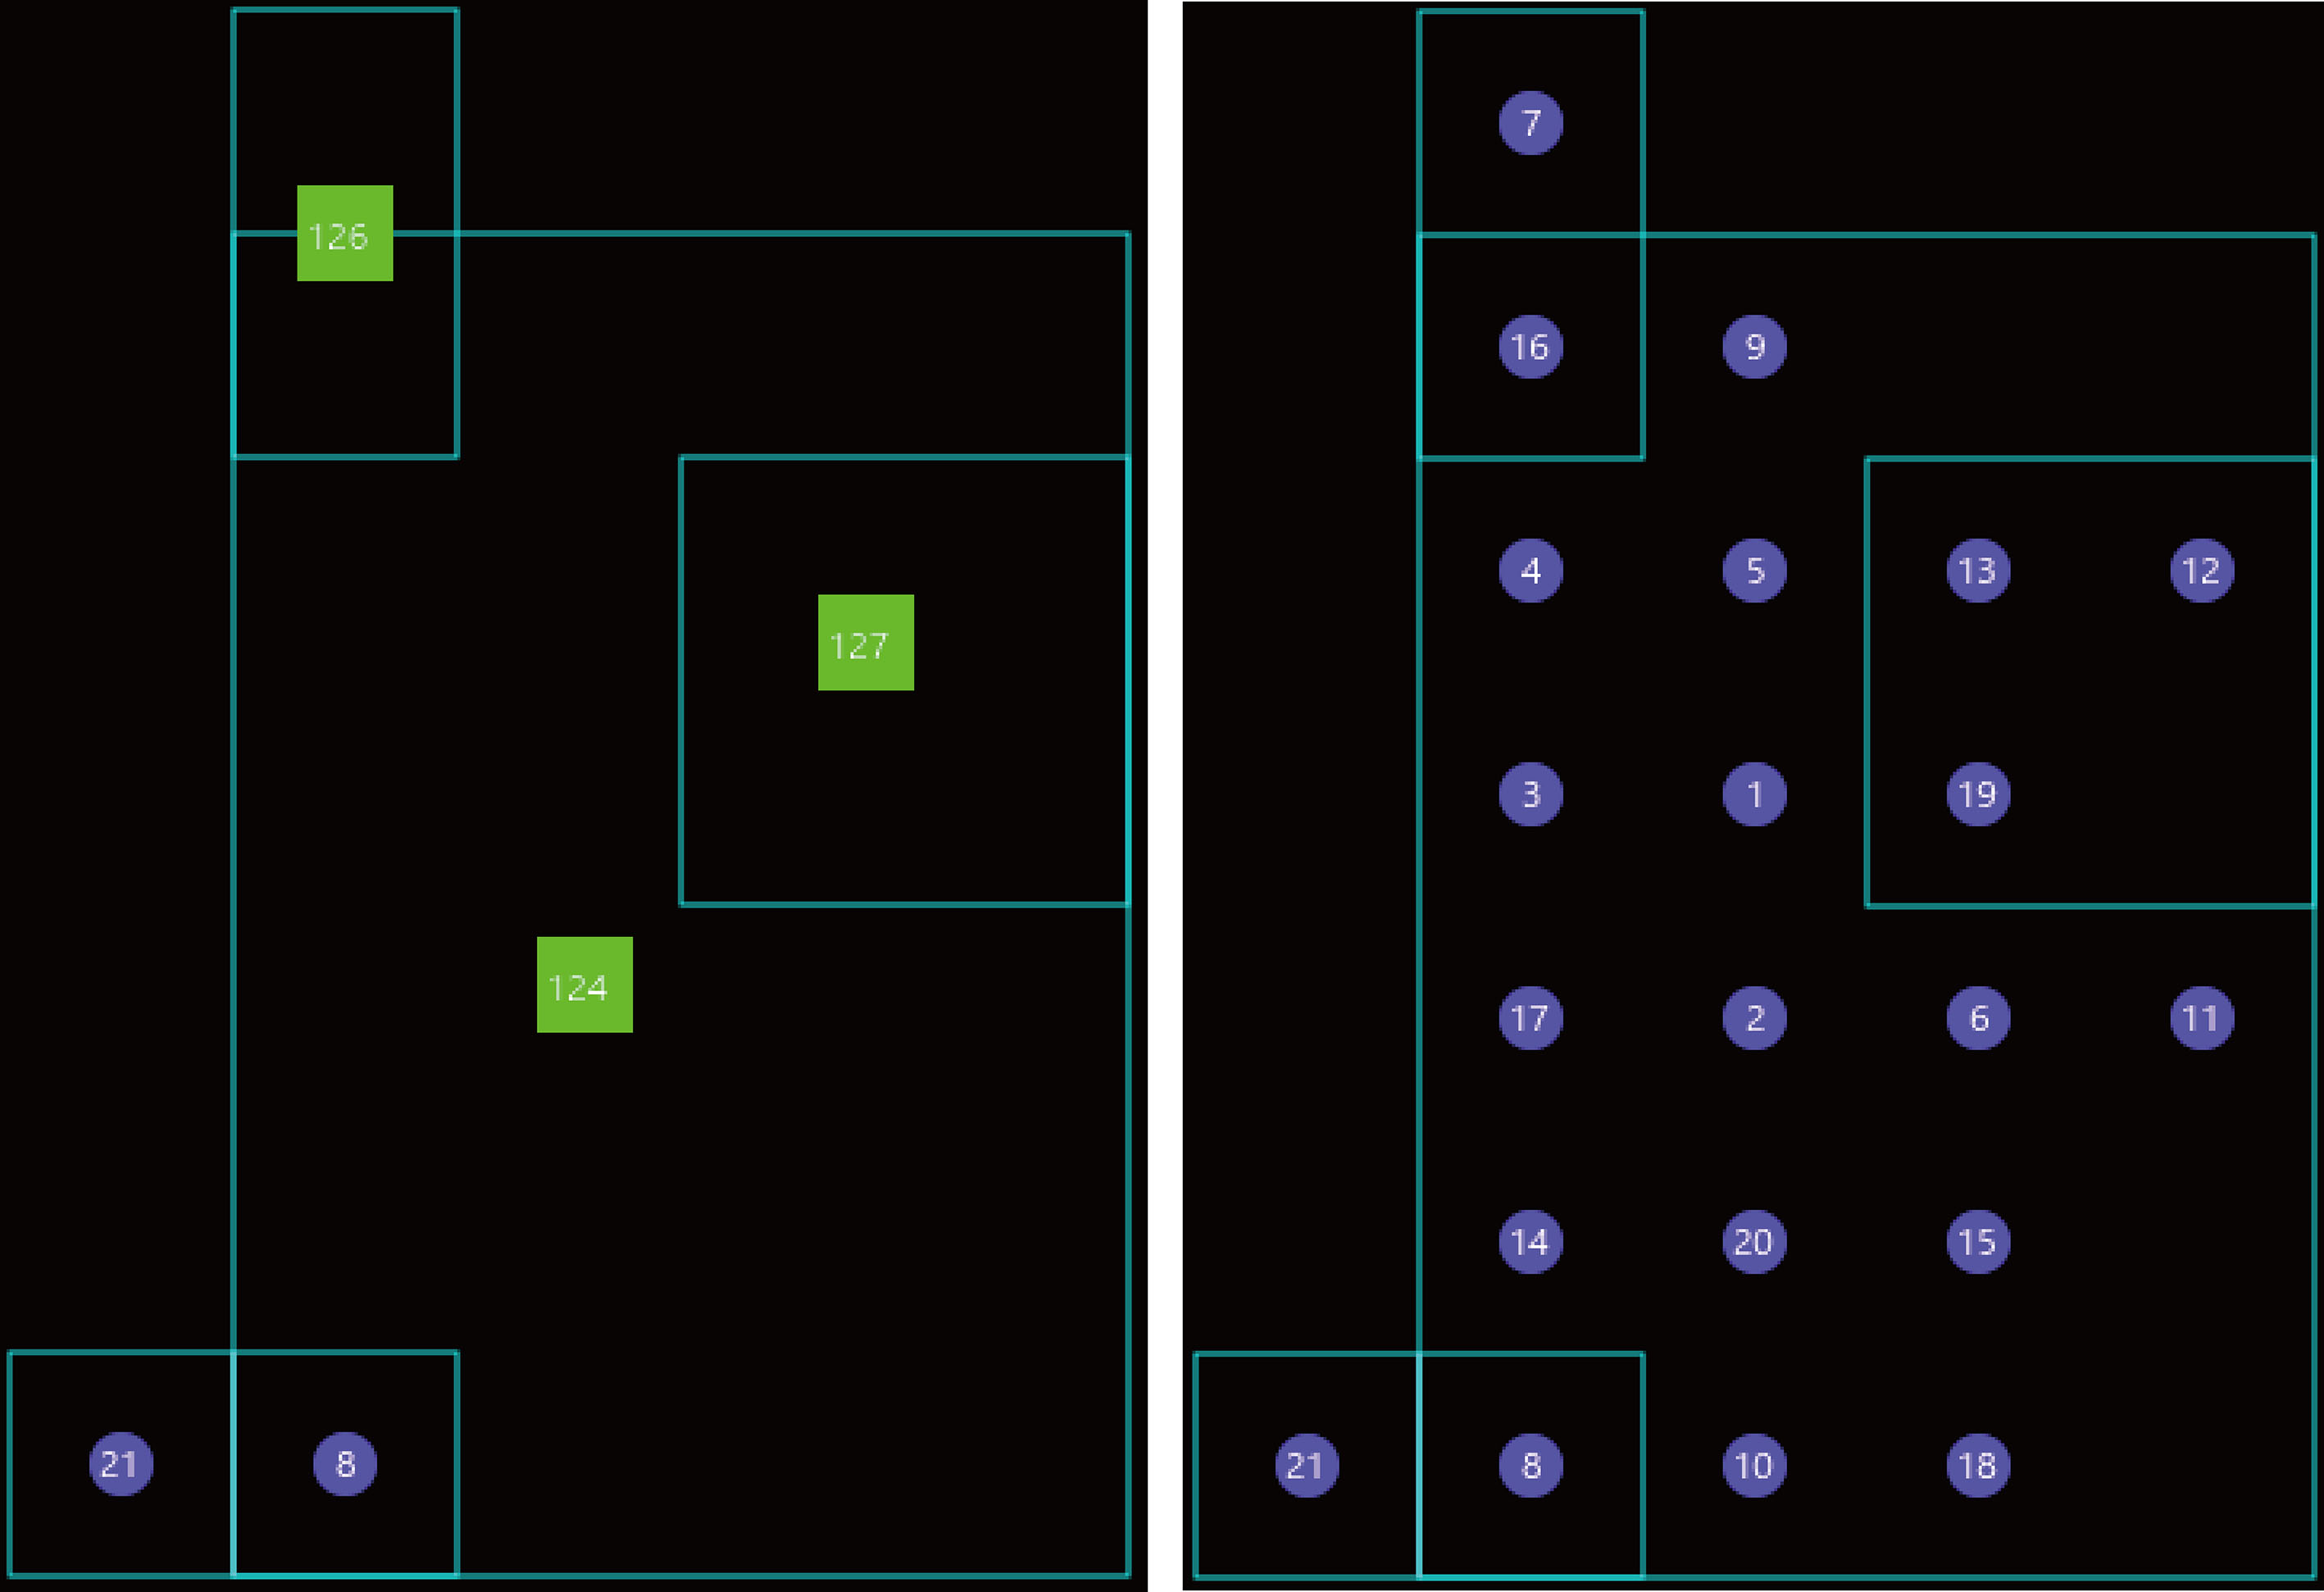
Two clusters (89, 90) do not indicate friendly relations. We will further analyze the relationship between these two clusters. The similarity level of cluster 89 changes from level 0.68 to 1.00. Cluster 89 is divided into the node 1, 9 and cluster 2. Figures 7 and 8 show the result of DCR on divided clusters or nodes and cluster 90. DCR between node 9 and cluster 90 is 0.00, and the analysis result screen is omitted. DCR between cluster 2 and cluster 90 is 0.25. DCR is lower than in the case of clusters of the same similarity level. Therefore, it turns out that these two clusters truly do not get along well. Also, DCR between nodes 9 and cluster 90 is 0.00, which shows that they do not get along as well as cluster 2. On the other hand, DCR between node 1 and cluster 90 is 0.56, which shows that they have a certain degree of friendly relations.
Consideration
In this subsection, we consider optimal similarity level and analysis results.
The value of the
The value of evaluate function
and
The value of evaluate function
By the calculated result,
Figure 9 that we show is afuzzy graph showing optimal similarity level
The clustering result of
On the other hand, we use the similarity level
Furthermore, we compared our analysis result with Sumida’s result [15]. About the analysis method, Sumida performed clustering of friendly relationships using not only the question survey but also the observation method and the interview method. However, his clustering model is undefined. Therefore, the quality of analysis results depends on the analysts. Sumida analyzed class mates using the results of a question survey, the observation method and the interview method, and members 1, 3, 4, and 5 are analyzed as one group. Analyzing only the results of the question survey, member 9 was also selected from group members (1, 3, 4, 5). However, the observation method showed that member 9 did not participate in group play. Therefore, member 9 is not included in the group members. It was a false recognition of the members that member 9 was selected as a group member even though they were not playing together. Sumida confirmed this through the interview method. Therefore, it was judged an incorrect result that member 9 was a group member, and member 9 was excluded. However, although member 9 does not belong to the group, s/he dose have a mutual selection relationship with other group members. Based on this, Sumida concluded that they have an intimate relationship.
On the other hand, the number of group members is 5 (1,3,4,5,9) from the partition tree in our analysis system. Members belonging to the group are different from Sumida’s analysis result. Sumida judged this to be an incorrect result from the participation degree of actual play and excluded member 9 from the group. However, in the question survey, there was the response that s/he was a member of the group, and this was a mutual selection relationship. Therefore, it is considered that no great error occurred in clustering as a clustering of friendly relations.
For other groups, clustering results similar to Sumida’s clustering result could be obtained. From that, it can be considered that there is reliability equivalent to the clustering results of experts with advanced knowledge.
In addition, we developed a method to identify the degree of influence among groups and influence of people using SBC. Sumida does not do the same research and analysis as these. It is an analysis method that has not been done in other studies which use sociometry analysis. It is possible to decide the route for efficiently communicating information to other groups and people using SBC. Furthermore, by repeatedly analyzing the SBC for the group or person who received the information, it is considered possible to find a route that can efficiently transmit information in a secondary and tertiary manner. We focused on subgroups existing in the group and divided the group into subgroups to analyze more detailed human relationships.
In this paper, we evaluate analysis indices and a fuzzy decision method to analyze human relationships using the question survey result by Sumida [9]. The clustering results of