
Abstract
Climate change, rainfall, weather forecasting is of great concern during the past two decades as scientists and researchers are cautious in building standard numerical models to simulate and forecast the weather parameters in efficient and reliable way. In India, the monsoon is largely responsible for rainfall. India experiences three distinct seasons throughout the year as a result of the monsoon, which originates from the reversal of the predominant wind direction from Southwest to Northeast. Between June and October, the Southwest monsoon, sometimes known as the “wet” season, brings significant rainfall across the majority of the nation. The focus of this research work is to analyse the data of rainfall existed in the past 100 years (1901–2000) and implementing artificial intelligent methods to frame certain classification of algorithm which can forecast the level of rainfall in the future. Data from 1901–2000 of Chennai district has been taken into account for this research. Statistical evaluations are done based on the database and the tabulated results shows the significance of rainfall. Wavelet analysis of multi resolution criteria is obtained to extract the information of heavy rainfall. Mann Kendall (MK) test statistics is utilized for classifying the rainfall data in four levels viz., very-low, low, moderate, high and very high. Trend analysis for the 17 years is tested using Neuro Fuzzy optimisation algorithm. The efficient training of Neuro fuzzy algorithm forecasts the possible trend using the classification analysis of MK test.
Introduction
In India, monsoon rainfall contributes 80% of annual rainfall spreading from June to September [12, 7]. The monsoon hits southern India during May and first week of June and spreads north India during first week of July. Rainfall in India plays major part in economic well-being, earth-atmosphere system, agriculture, farming and disaster management in India. Rainfall patterns of India (1871–1990) were mapped using time series analysis of proximity correlation techniques, fuzzy C-relates to clustering and orthogonal functions [30], and Kulkarni (1992).
Forecasting rainfall is not a simpler task. It requires lot of parameters to be involved in it. Precipitation, temperature, wind speed and wind direction play key role in forecasting rainfall. Forecasting accurate value is very difficult because of these multiple parameters. Thus, using Neuro Fuzzy logic rainfall has been classified into Very Low (VL), Low (L), Medium/Normal (M), High (H), Very High (VH) and their linguistic values are given as an input to this algorithm. The proposed linguistic values arranged in such a way that the values represent the Mann-Kendall Test statistics output values. The input values are coined to have linguistic variables and then fed to ANFIS algorithm to predict rainfall in ranges of value. Thus, in evident, training data was taken from 1900–2014. The testing results proved that the algorithm works well to predict the rainfall in particular range fixed on the Mann-Kendall Test statistics.
Challenges in rainfall prediction
The history of Indian Seasonal Rainfall (ISMR) prediction is extensive. Sir Henry Blanford started it in 1886 after taking into account the snowfall in the Himalayas. Rao [46], Banerjee [8], Kung and Sharif [31], Bhalme [9], Gowariker [18], Parthasarathy [39, 40, 41], Kumar [27, 28], and Rajeevan [44] are just a several of the researchers who have attempted to create an accurate forecast model. There has been a lot of study done on forecasting ISMR, and some studies have revealed that climate and hydrological cycles are connected [24, 15, 5, 6, 35, 34]. Despite all the efforts made by experts to predict rainfall, the issue still needs to be looked into using artificial intelligence approaches [48, 56]. This study concentrates on the artificial intelligence approach ANFIS in combination with MK statistics to forecast rainfall range for a specific time period. This effort is successful, and the outcomes are solid. The researchers conducted numerous investigations to determine the effects of anthropogenic activities on climate change [21, 16].
The Indian Meteorological Department (IMD) recorded day-to-day rainfall data between 1951 and 2007 [45], which is helpful for agriculture, hydrology, ecology, weather forecasting, monitoring, and analysing rainfall fluctuations [54]. Sontakke et al. [55] documented a recent decline in seasonal rainfall, with winter months experiencing rainfall rates of 47%, 17%, 75%, and 38% less than summer months. Several research on rainfall for drought analysis were presented [13, 50, 20, 38], Sinha and Shwale (2001). The Mann-Kendall mode test, which is grounded on Sen’s method [49], was used by Naresh Kumar et al. to analyse spatiotemporal drought analysis because it can be used to analyse time series data without the use of statistical evaluation functions [17, 19, 42]. The Central Water Commission [11] reported that India’s per-capita water consumption decreased from 5176 m
Methodology
It’s indispensable to study the rainfall data analysis and forecasting using efficient tools.
Study area
The city Chennai, the Coromandel Coast and the capital of Tamil Nadu, is situated in latitude 13.0827
Location map of study area.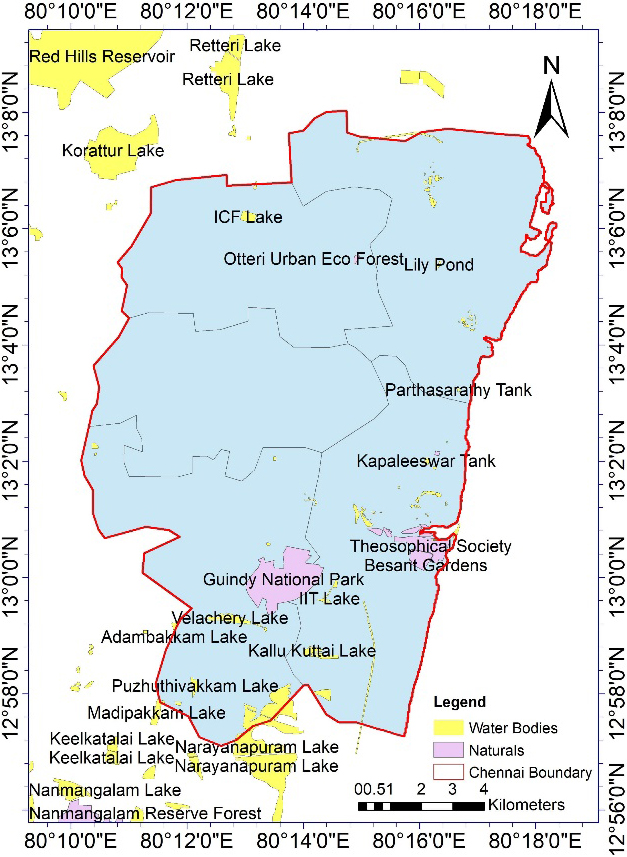
Flow chart showing the ANFIS classified MK test statistics.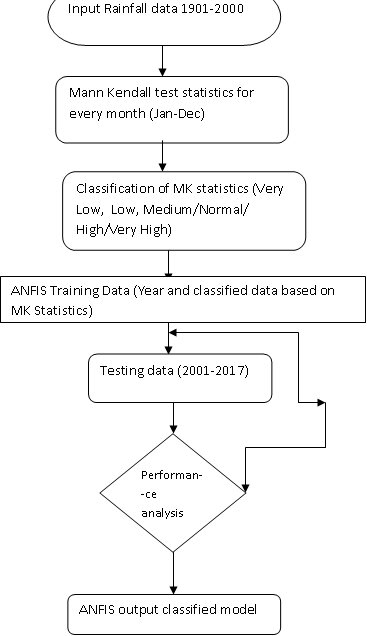
Wavelet analysis is indispensable for effectively analysing time series data. This transformation simplifies the process of determining the potential for an event to occur. The spatial and temporal data will give an eagle’s eye view of the real-time data approach. The signal of time-frequency multiresolution functions is disintegrated has advantages over standard time-frequency analysis [32]. The following is the requirement for eligibility:
Depending on the wavelet’s scale parameter, CWT involves discrete data for sampling in order to extract the prime features. Increased processing time and more memory are needed to calculate the coefficients with finer resolution. Orthonormal supported wavelets are the basis of multiresolution analysis (MRA). Since the representation of specific information provides a clearer image compared to other alteration algorithms similar to Fourier and Short-Term Fourier Transform, its applications are expanding quickly in a variety of scientific domains (STFT). Wavelet has been used in numerous scientific fields, such as river flow models and the analysis of flood forecasts [1, 2, 3]. Wavelet coefficients of rainfall data from the years 2001 to 2017 are displayed in Fig. 3. The multiresolution rainfall scalogram is shown in Fig. 4. Heavy rainfall in the years 2005 and 2015 had greater energy spectrogram dispersion, according to multiresolution. In Fig. 3, the red lines are separated to show the variation for each month of the year.
Continuous Wavelet transforms coefficients for the rainfall pattern analysis for Chennai district 2001–2017.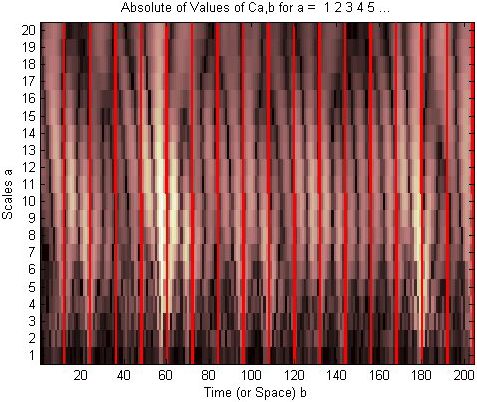
Multiresolution analysis shows the peak rainfall variations in 2005 and 2015 in Chennai district.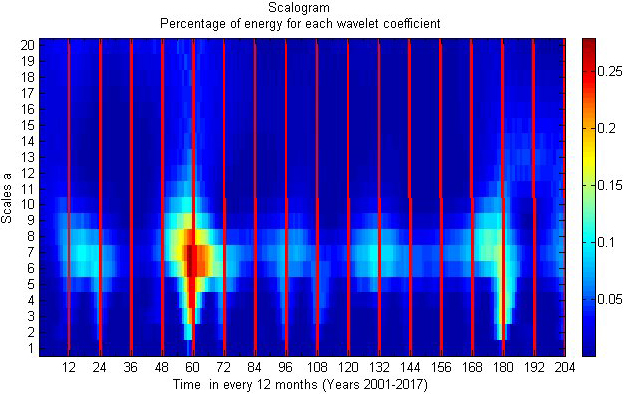
The most widely used form used among researchers is the MK test [14, 58, 10, 51, 52], Kumar and Jain (2011). The MK test is used to calculate the variations in rainfall fluctuation trend are statistically analysed. In this investigation, Sen’s estimator [49] and the Mann-Kendall (MK) test were applied to analyse the amplitude of rainfall fluctuations from the years 2001 to 2017 [33, 26]. The MK test determines whether a trend is there and whether it is increasing or decreasing in direction.
where the number of data points are denoted by
Assuming
Before using the ANFIS algorithm, subtractive clustering technique was first applied to the data as part of a clustering analysis. The resulting membership functions have been mapped to increase the firing strengths for each membership function and a specific degree of membership grade between the input and output. Each function includes a key component for the framing of rules and related parameters. Stanley [57] applied ANFIS for comparing time series and non-time series states.
The subtractive clustering algorithm is utilized to the imported rainfall data (using the MATLAB programme “genfis2”). A specific membership function has been assigned to the cluster centres (in this case, the MATLAB command “gaussmf” or “Gaussian membership function”) Each rule has a corresponding membership function. Following the formulation of the rules, a hybrid learning methodology using gradient descent and least square evaluation was used to initialise the ANFIS network.
The ANFIS system has five levels, and each layer’s output is represented by the symbols
Layer 1 serves to increase the degree of membership, and the Gaussian membership function is applied in this case.
and
with
by {
Layer 2 serves to multiply each input signal in order to induce firing-strength.
Layer 3 makes the firing strength more common
Layer 4 calculates the output using the
Layer 5 combining all incoming signals, the ANFIS output signal is counted.
ANFIS makes use of the MATLAB command
Step 1:
The data is imported to MK – neuro fuzzy algorithm assigned as
Step 2:
The training data is allotted by applying the Gaussian membership function
where
Step 3:
Following the Mann Kandell test statistics
Step 4:
Classification of rainfall associated with linguistic variables.
Step 5: Error estimation:
The algorithm now determines the relative difference between the real and fake data. This is equivalent to the error percentage (e). It will follow the trend and noise can be reduced if it is nearer to the integer of synthetic data, or the neighbouring data points.
Thus
where
ANFIS predicted MK test statistics classification.
ANFIS predicted MK test classification for monsoon.
Step 5:
Neuro fuzzy considers the synthetic data and generates membership functions to find multi-layer model at this stage [Stanley (2015)].
Step 6:
The final firing phase of the ANFIS algorithm allows for the acquisition of the regressed layer model.
Statistical variation of rainfall for the year 2001–2017 for Chennai district
Wavelet analysis for monsoonal variations.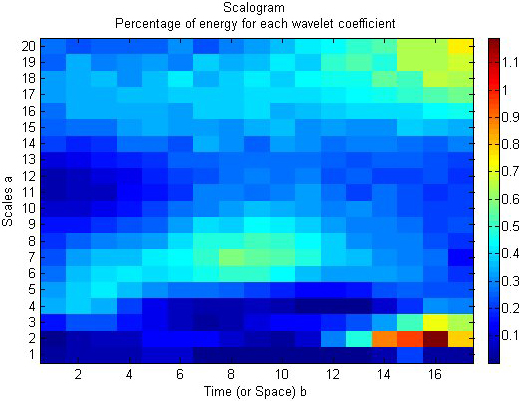
Pre monsoonal classification using ANFIS-MK test.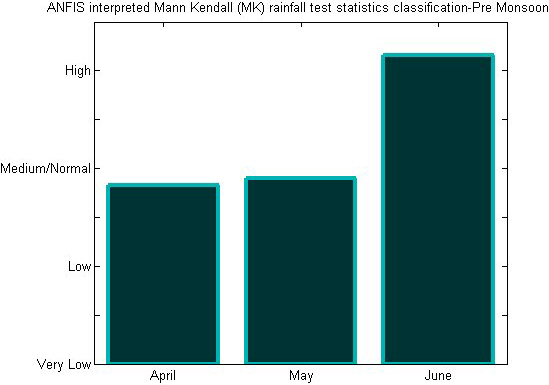
ANFIS Training and testing performance for different range of data with the constraints after fixing number of epochs and network size
Wavelet analysis for Premonsoonal Variations.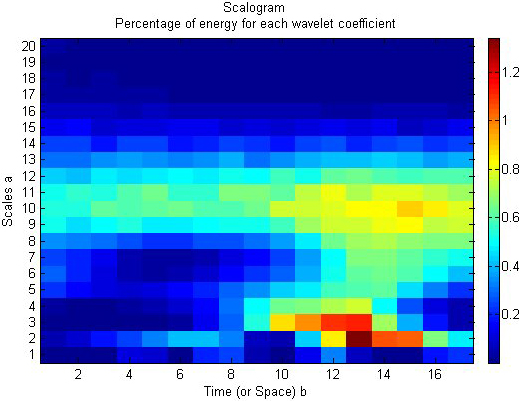
Post monsoonal variations using ANFIS-MK test statistics.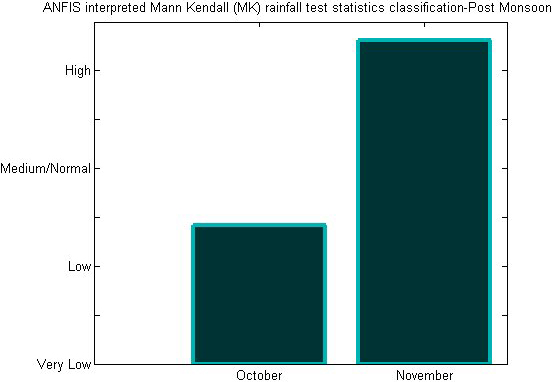
Wavelet analysis for Post monsoonal variations.
ANFIS-MK test statistics for winter season.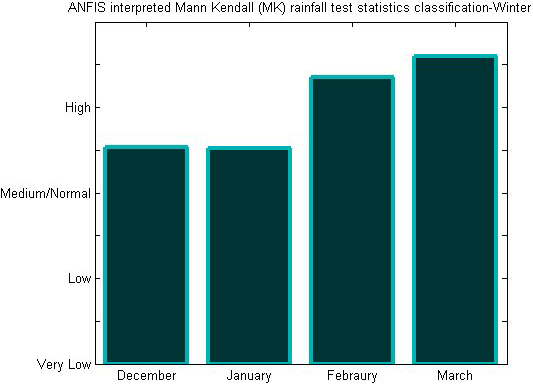
Wavelet analysis for variations during winter season.
Table 1 displays a statistical analysis of Chennai district rainfall data from 2001 to 2017. As anticipated by the MK test related with neuro fuzzy, November month consistently has excessive rainfall, as shown by least square fitting and polynomial fitting. There is a shifting of rainfall fluctuations from the years 2005 to 2015, according to least square estimations and estimates from polynomial fitting. The findings show that there is a good correlation linking the parameters as shown by the alternation curve that complies with the conditions present in the occurrence of rainfall in the research location. Chennai is experiencing an upsurge in rainfall during the northeast monsoon throughout the post-monsoon seasons (October to December). Although, it reveals that there is a little decline in comparison with the premonsoon and monsoon seasons of Chennai district when compared with the linear regression analysis. According to polynomial fitting, the trend gets stronger throughout the post-monsoon season. ANFIS obtained input values from MK test statistics for the previous 100 years’ worth of data, and the test results were verified using monthly data for the years 2001–2017. (Fig. 5). The monsoon season in Chennai district is connected with the classification outcomes anticipated by ANFIS. The ANFIS projected Monsoonal fluctuations and wavelet analysis are shown in Figs 6 and 7, respectively. According to the studies mentioned above, it is possible to analyse the variability in monthly rainfall using the ANFIS technique in conjunction with MK test statistics and handle the results effectively for classification and interpretation. Predictions from the ANFIS-MK test for the premonsoon, post monsoon, and winter seasons are demonstrated in Figs 8, 10, and 12. The wavelet analysis for the corresponding seasons is shown in Figs 9, 11, and 13. Table 2: ANFIS Training and testing results for various data sets.
Conclusion
In this study, the continuous wavelet transform was used to analyse the amount of rainfall that fell in the Chennai area between the years of 2001 and 2017 (CWT). Actual data is split using continuous wavelet transforms into precise coefficients that provide the majority of the statistics, which in turn aids in sensing the issue. By breaking down the time series data into distinct levels, wavelet transformations can extract information from noisy or erratic time series data. The researchers can more easily understand the statistical model thanks to this study, and the outcome will make it easier to interpret the rainfall time series data. The seasonal and annual rainfall patterns of Chennai district show multi-time scale properties. The trend study over the course of 12 years reveals very small-time scale fluctuations, despite the fact that there will always be a periodic trend that exists between January and December of every month of the year. The results of this study make it abundantly evident that the trends in monsoon’s variation and change in phase have not significantly affected the Chennai district’s yearly rainfall. The direct trends in the rainfall in the Chennai district between 1901 and 2002 are identified by MK test statistics. Monthly trend tests display patterns for various months and seasons.
Future works
This paper presented ANFIS based MK statistics for rainfall forecasting algorithm and the efficiency with training and validation is checked while applying the ANFIS algorithm. This research predicts the range of rainfall in Chennai after training with large number of training datasets. This method integrated statistical and soft computing approach to forecast the output values. Thus, it supports the conventional and modern approach in bringing out the best performance in forecasting. The only constraint of this algorithm is that it depends only on the linguistic values of the membership functions. If the classes of the linguistic variables are further distinct and precise then the accuracy will be more. Moreover, this research can be improved by adding other meteorological parameters (evaporation, mean temperature, humidity, and soil temperature) to forecast the values accurately.
Footnotes
Acknowledgments
The authors wish to thank the anonymous reviewers for their comments and suggestions.