
Abstract
The search for unfamiliar experiences and novelty is one of the main drivers behind all human activities, equally important with harm avoidance and reward dependence. A recommender system personalizes suggestions to individuals to support and guide them in their exploration tasks. Personalization mechanisms and recommender systems limit serendipitous encounters by selectively guessing the next item to show to users and potentially leading them into so-called filter bubbles. In the ideal case, these recommendations, except of being accurate, should be also novel. However, up to now most platforms fail to provide both novel and accurate recommendations. For example, a well-known recommendation algorithm, such as matrix factorization (MF), tries to optimize only the accuracy criterion, while disregarding the novelty of recommended items. In order to counteract the filter bubble, we propose two models, denoted as popularity-based and distance-based NMF, that allow to trade-off the MF performance with respect to the criteria of novelty, while only minimally compromising on accuracy. Our experimental results demonstrate that we attain high accuracy by recommending also novel items.
Introduction
The filter bubble is the unique universe of information created around the users by prediction engines or recommendation algorithms [26]. Based on the principle that users consume media of their interest, the filter bubble creates a tinted view of the world around the users by recommending items from the catalogues. A concrete example of the filter bubble is when a user buys a book on an e-commerce platform and repeatedly receives recommendations only about books discussing the same topic. This kind of recommendation engine are based on incomplete evidence of interest and neglect the inherent need of users for non-obvious recommendations [31].
Recommender systems research aims primarily at providing accurate item recommendations [19] while ignoring many times additional quality criteria such as the novelty of a recommended item [3]. There are many definitions of item novelty [3]. For example, the popularity-based novelty focuses on discovering non-popular products that match the crowd’s interest. In terms of MF for providing novel item recommendations, related work [9, 32] observed that by raising the dimensionality of the MF model (i.e., by increasing the number of latent factors), we can recommend items coming from the long tail (i.e. more novel items), but with big losses in terms of accuracy. In addition, an increased number of latent factors directly affects the efficiency of MF models. Generating novel recommendations lead to the following benefits: Provide non-trivial recommendations. Discover items that could not have been found by the users themselves and increasing the array of choices (avoids the filter bubble). The business can leverage revenues from market niches (sales diversity).
In this paper, we extend our previous work on generating novel item recommendations based on matrix factorization [7]. We propose a MF method that simultaneously recommends accurate and novel items. Our proposed method, denoted as NMF, has the advantage of controlling through a regularization term how novel items will be recommended, without increasing the number of latent factors of MF [9, 32]. Moreover, we introduce an integrated way to evaluate novelty, denoted as Novelty-nDCG, which is based on the well-known nDCG [4], but adjusted for our case-scenario in recommender systems, and distinguishes a more novel item from a less novel item. N-nDCG also can be used with different definitions [3, 30] of item novelty, as will be described later. However, item novelty should not be considered equal to the diversity of a recommendation list.
In the remainder of this paper, Section 2 discusses the related work. In Section 3.1, we define item novelty, and the evaluation of a recommendation list of items. Then, we propose a framework for novel MF. Section 4 presents our experimental results on two well-known datasets. Finally, Section 5 concludes and describes future work.
Related work
Recommender systems’ effectiveness cannot be measured by considering only the accuracy of recommendations. Jannach et al. [18], outline that the research community is becoming increasingly aware of this problem, and that aspects related to the users’ experience like explanations, novelty and serendipity are starting to receive more attention.
Furnas et al. [13] proposed Singular Value Decomposition (SVD) to factor a matrix into three matrices. An instance of SVD, known as classic matrix factorization (MF), searches for two matrices (U and V), whose multiplication gives an approximation of the original matrix A. That is, if we have a matrix A with n rows and m columns, we can find two matrices, one U with n rows and k columns and one V with m rows and k columns, such that UV⊤ produces A with the blank entries filled and a small deflection of the initial values. Another MF method is known as CUR Matrix Decomposition [23], because the initial matrix is factorized to 3 matrices (C, U and R). One quick observation about CUR decomposition is that row and column that are used to construct matrices C and R are randomly selected from matrix A. It is obvious that this selection will affect CUR-approximation.
Several methods have been proposed to compute matrices U and V. For example, Lee and Seung [21] proposed the definition of a cost function (i.e., ∥A - UV ∥ 2), which can be minimized either by using multiplicative update rules or by using additive update rules of the well-known gradient descent method. In addition, Dhillon and Sra [11] proposed multiplicative update rules that incorporate weights for the importance of each element of the approximation predicted matrix
As far as item novelty is concerned, Jannach et al. [17] mention in their research that recommender systems aim at boosting recommendations from the long tail of the item popularity distribution, as it increases sales of novel items. There are several works that try to provide both accurate and novel [3, 30] or diversified item recommendations [4, 5], where a diversified item recommendation list tries to capture more aspects of the user’s interest. In terms of MF, related work [9, 32] has claimed that by increasing the number of latent factors of the basic MF model [20], we can more accurately recommend novel items. A different research direction in MF formulates the item recommendation problem not as a classification problem, but as a ranking problem using pairs of positive items (in the train set) and negative items (not in the train set) as pairwise input. For example, Bayesian Personalized Ranking (BPR) [27] optimizes a simple ranking loss such as AUC (the area under the ROC-curve) and uses matrix factorization as the ranking function, that can be directly optimized using a stochastic gradient algorithm. Similarly to BPR, Ning and Karypis [24, 25] proposed a set of Sparse LInear Methods (SSLIM), which involve an optimization process to learn a sparse aggregation coefficient matrix based on both a user-item purchase matrix and side information on items.
In contrast to the aforementioned work of Cremonesi et al. [9], and Yin et al. [32], our proposed method incorporates an additional constraint term for novelty into the basic MF formula. Note, that this is in analogy to [6] where an additional constraint term models the perceived utility of users of the different parameters of the rating summary statistics like the average rating value or the total number of rating. In contrast, here the information on the novelty of an item is taken from an external resource of a user-item novelty matrix, which will be defined in the next section. While novelty and accuracy of recommended items are seen as a key feature of the recommendation utility in real scenarios, to our knowledge, there is not much work relating them and systematically measuring trade-offs.
It is useful to make a clear distinction between novelty, diversity and serendipity. Vargas et al. [30] explain that the novelty of an item refers to how different an item is with respect to what has already been experienced by a user or the community. While diversity refers to a set of items, and it is related to how different items are with each other. While serendipity [10] refers to how surprising and interesting is an item for a user. Tomeo et al. [28] extended the regression tree to generate diversified recommendations lists in a multi-attribute setting. In the same direction, Di Noia et al. [12] proposed a method for diversified recommendations by introducing an adaptive multi-attribute diversification method according to the hypothesis that a user who selected many diverse items in the past could be more willing to receive diverse recommendations. Wasilewski and Hurley [16] have proposed a matrix factorization framework to trade-off between the accuracy of item recommendations and the diversity of the items in the recommendation list. In the following, we argue why there is very small overlap between their and our work, by identifying two important differences. The first is that similar to the previous approaches, their MF model computes the pair-wise ranking loss of the objective function (not the element-wise square loss like our methodology). In other words, our MF model is element-wise and predicts the missing values of the user-item rating matrix, whereas their model tries to optimize items’ pairwise ranking. The second difference is that we are exploring the trade-off between item recommendation accuracy and item novelty, whereas they explored the trade off between item recommendation accuracy and item diversity. This difference is discussed further in the discussion section. De Gemmis et al. [10] proposed a methodology to propose non-obvious items and to measure their serendipity by measuring via web-cam the facial expressions of users.
Novelty
In this section, we will define the novelty of an item for a target user. We want to be able to measure if an algorithm will recommend more novel items to the users. Table 1 summarizes the symbols used in the following sections.
Symbols and definitions
Symbols and definitions
The premise of recommender systems is to suggest to users non-trivial items that match their interest, i.e. to make novel item recommendations. By doing this, businesses can increase their profits, since these novel items usually might have higher profit margins. Moreover, users will not get bored and disappointed by just getting trivial recommendations of popular items. In the following, we will define the novelty of a recommended item and how to measure the novelty of a recommendation list.
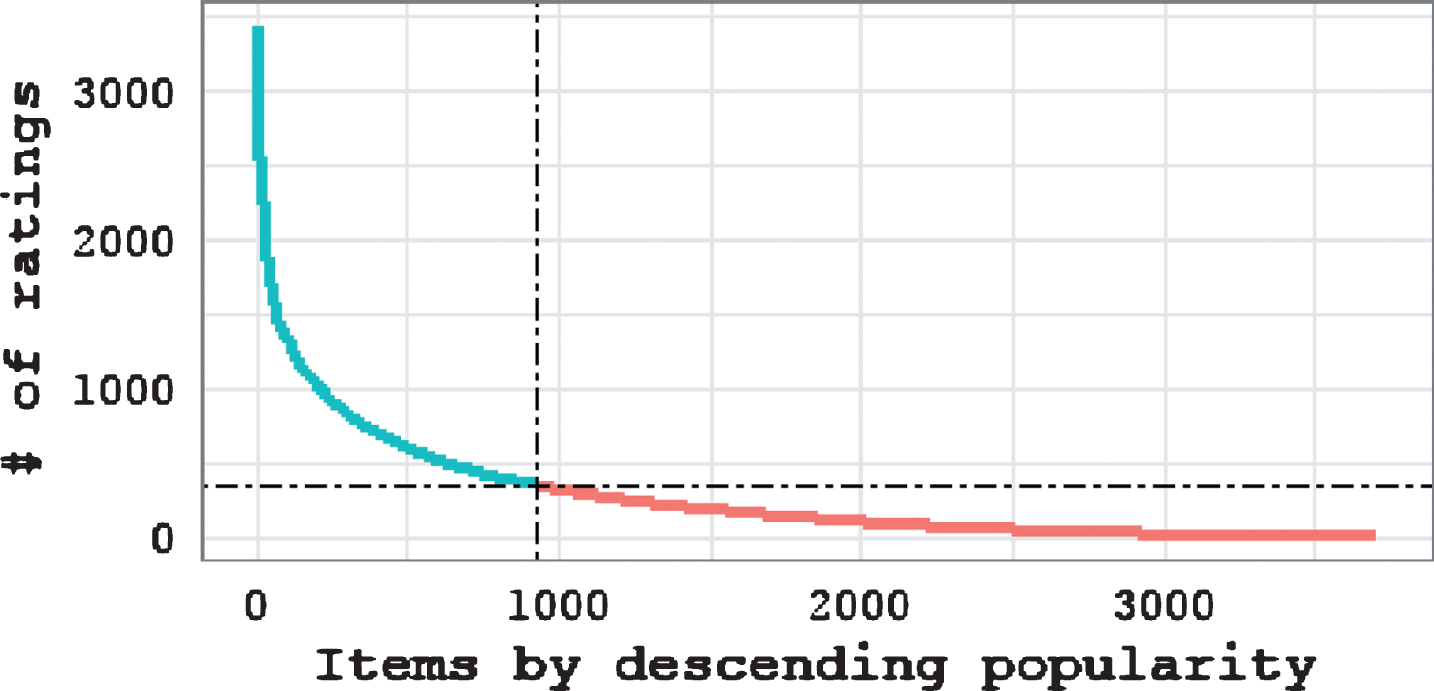
Figure 1 depicts the item popularity distribution of a well-known dataset, MovieLens 1ML [14], where items are ranked depending on how frequently they have been rated by users. As it is shown in Fig. 1, the ratings of items follow a long-tailed distribution and the novel items correspond to the long-tail items of this item popularity distribution, where few users have rated or interacted with, whereas items of low novelty correspond to popular items.
Popularity distribution of items.
Related work [3] in recommender systems has proposed a lot of definitions of item novelty. However, for a recommender system that consists only of a user-item rating matrix (without any other information about categories of items, domains of users’ interests, etc.), the simple popularity-based novelty definition [3] is more suitable, also known as global long-tail novelty, which focuses on discovering relatively unknown items (coming from the long-tail of the item popularity distribution). Based on the aforementioned arguments, novelty can be defined as the opposite of popularity, which means that an item is more novel if fewer people are aware of it. Thus, we adopt the notion of user inverse frequency [3, 30] to measure the novelty N
i
of a recommended item i, by taking the inverse of its popularity, as can be shown by Equation 2:
Based on Equation 2, an item can be considered as more novel, if the users have interacted less with it (i.e., it received less ratings, or it is not enough purchased or it is less observed/viewed). In order to highlight the existence of highly novel items (favoring few very novel items and penalizing many less novel items), we can consider the logarithm of the novelty, as it is shown in Equation 3 [3]:
The maximal novelty achieved on an items will be considered as:
There are recommender systems which possess information - except the user-item rating matrix - about the categories that the items’ belong to, or the focus of users’ interests. For example, in news articles recommendation, we know the category that each article belongs to (i.e., politics, sports, etc.). Thus, when we recommend a news article about sports to a user that has seen a lot of articles about sports, this recommendation cannot be considered to be the same degree of novelty than in case we provide the same article to a person that has never seen an article about sports before. That is, for every user the same item may be differently novel. In the following section, we will define how we can capture this notion of novelty of an item for a user.
Differently to the case of popularity-based item novelty, in the distance-based model [3], also known as unexpectedness, for capturing an item’s novelty we define a distance function between the target item i from the set of items I and the set of items I
u
that a user has already interacted with (the user’s past experience). We can formulate this novelty as shown in Equation 5:
Please notice that the distance between two items can be also considered as the complement (i.e. d (i, j) =1 - sim (i, j)) of any similarity measure (cosine-based, Jaccard coefficient, etc.) in terms of the item features (i.e., the category that an item belongs to, the features of an item, etc.) or the user’s item categories profile
1
(i.e. the item categories that a user prefers). To capture how novel a topic category is for a user, we can use Equation 6, which is based on the well-known subtopic recall metric (S-recall) [3], but adjusted to our case scenario:
An item will be novel if it belongs to a category that has never been seen before, thus, N max = 1 . 2
For a user u who is recommended N different items, we define as novelty of the L
u
recommendation list of items, as follows:
Thus, to obtain a more fine-grained level of granularity we adopt the notion of Novel - normalized Discounted Cumulative Gain (N - DCG u ) [4], which also takes under consideration the relative position of the recommended items inside L u .
The first step in the computation of N - DCG
u
is the creation of the gain vector. In our case, the gain vector for each item l in Lu, consists of its Novelty (N
l
) (i.e. as defined in Equation 3 or Equation 6). The second step in the computation of N - DCG
u
applies the Discounted Cumulative Gain to the aforementioned gain vector, as shown in Equation 8.
The third step is to normalize the N - DCG
u
against the “ideal” gain vector. In our case, the “ideal” gain vector considers all recommended items in L
u
as having maximum Novelty, N
max
(i.e. as defined in Equation 3 or Equation 6). That is, all recommended items in L
u
are considered as never seen by any user. Thus, the ideal N-IDCG is calculated as:
Finally, the N - nDCG
u
is the ratio between N - DCG
u
to N-IDCG:
In this section, we adopt two additional metrics for evaluating the novelty. From the work of Vargas et al. [31] we use Expected Popularity Complement (EPC) to measure the popularity based novelty and the Expected Profile Distance (EPD) to measure the distance based novelty, as follows:
Matrix factorization methods are used in recommender systems to derive a set of latent factors, from the user × item rating matrix, to characterize both users and items by this factor vector. The user-item interactions are modeled as the inner product of the latent factors space [20]. Accordingly, each item j will be associated with a vector of factors v
j
, and each user i is associated with a vector of factors u
i
. An approximation of the rating of a user i on an item j can be derived as the inner product of their factor vectors:
The u(user) and v(item) factor matrices are cropped to k features and initialized at small values. Each feature is trained until convergence (where convergence specifying the number of updates to be computed on a feature before considering it converged, it can be either chosen by the user or calculated automatically by the package). On each loop the algorithm predicts
The attribute λ represents the learning rate, while γ corresponds to the regularization term.
In this section, we propose an algorithmic framework to trade-off between accuracy and novelty in matrix factorization.
For popularity-based novelty, to provide more novel item recommendations, we add an additional soft constraint for novelty into the classic regularized matrix factorization formula as shown in Equation 16:
Henceforth, we call this method Novel Matrix Factorization (NMF). Please notice that MF is just a simplified special case of NMF and can be easily derived from it.
In this section, we compare experimentally our approach NMF with the Matrix Factorization [20] algorithm (MF). Moreover, we will use the Maximal Marginal Relevance re-ranker (MMR) [2] combined with the MF algorithm, such that we have in our experiments also a variation of MF, which focuses on providing novel item recommendations. In particular, for re-ranking the item recommendation list provided from classic MF algorithm with MMR, we adapt the following greedy objective function of Saúl Vargas [29], as shown by Equation 17:
where
We implemented the experiment using the functionalities of rrecsys [8] and proxy. 4 To ensure reproducibility of experimental results we share our implementation. 5
Our experiments are performed with four datasets, MovieLens 100K (ML100K), MovieLens 1ML (ML1M), MovieLens 20 ML (ML20ML) [15], and Yelp 6 (see Table 2).
Dataset
Dataset
ML100K consists of 100,000 ratings assigned by 943 users on 1,682 movies. ML1M contains 1,000,209 anonymous ratings of approximately 3,900 movies made by 6,040 users. ML20ML consists of 20 million plus ratings, consisting of 27,278 items rated by 138,493 users. All the MovieLens datasets have at least 20 ratings per user (∀u ∈ U : |I u |>20). The Yelp dataset consists of a large collection of ratings on businesses. We took a sub-dataset of the dataset consisting only of restaurants, where the novelty hypothesis is more plausible (e.g. if a user eats pizza one day, the next time she might want to try something else). In addition, we limited the recommendations to Las Vegas since the dataset contains more businesses from this city. Still, the dataset displays large sparsity, thus we took a sub-sample of 40 ratings per user (∀u ∈ U : |I u |>40).
Our evaluation considers the division of items of each target user into two sets: (i) the training set E T is treated as known information and, (ii) the test set E P is used for testing and no information from the test set is allowed for learning for computing predictions. It is obvious that, and . Therefore, for a target user we generate the recommendations based only on the items in E T .
In addition to the N-nDCG metric introduced in Section 3.3 we use classic precision and nDCG metrics for measuring the accuracy performance of recommendations. We perform all experiments with 4-fold double-cross validation, with a training-test split percentage, 75% -25%. The default size of the recommendation list N is set to 10, except to the cases where written differently. All algorithms predict the items of the target users’ in the test set. For ML100K, ML1M and ML20M the number of latent factors, update cycles, the regularization term β, the learning rate η to 80, 100, 0.001 and 0.001, respectively. For Yelp-L.V. we set the number of latent factors, update cycles, the regularization term β and the learning rate η is set to 80, 50, 0.0001 and 0.001, respectively. For MMR we keep the trade-off at 0.5, while for the NMF we variate the Novelty-regTerm.
Sensitivity analysis of NMF
In this section, we want to explore how the performance of both popularity-based and distance-based NMF in terms of providing novel and accurate recommendations is affected, as we increase the impact of the regularization term δ, which controls novelty in Equation 16. Figures 2a, 2b, 2c and 2d show the Popularity-based NMF as we increase δ. As shown, N-nDCG and nDCG are negatively correlated, which signifies that as we increase N-nDCG the nDCG drops. In Figures 3a, 3b, 3c and 3d we depict the distance-based NMF as we increase δ. For the first three datasets, the trend that we noticed with the popularity-based NMF can be also noticed with the distance-based NMF. That is, as N-nDCG increases, accuracy drops and vice versa. While on the Yelp dataset, Fig. 3c, we notice that novelty (both in terms of N-nDCG and EPD) and precision increase together. Given the scenario, this could relate to the users’ inherent need for novelty and the notion of discovery [31]. Although, this first experimental result requires further and intensive investigation. Please notice that the difference in terms of N-nDCG between distance-based and popularity-based NMF is related to the different notions of novelty (see Section 3.1 and 3.2). In summary, for all Movielens datasets, as we increase δ, NMF recommends more novel items but the recommendation accuracy drops drastically, while for the Yelp dataset on the distance-based NMF novelty and precision seem correlated.
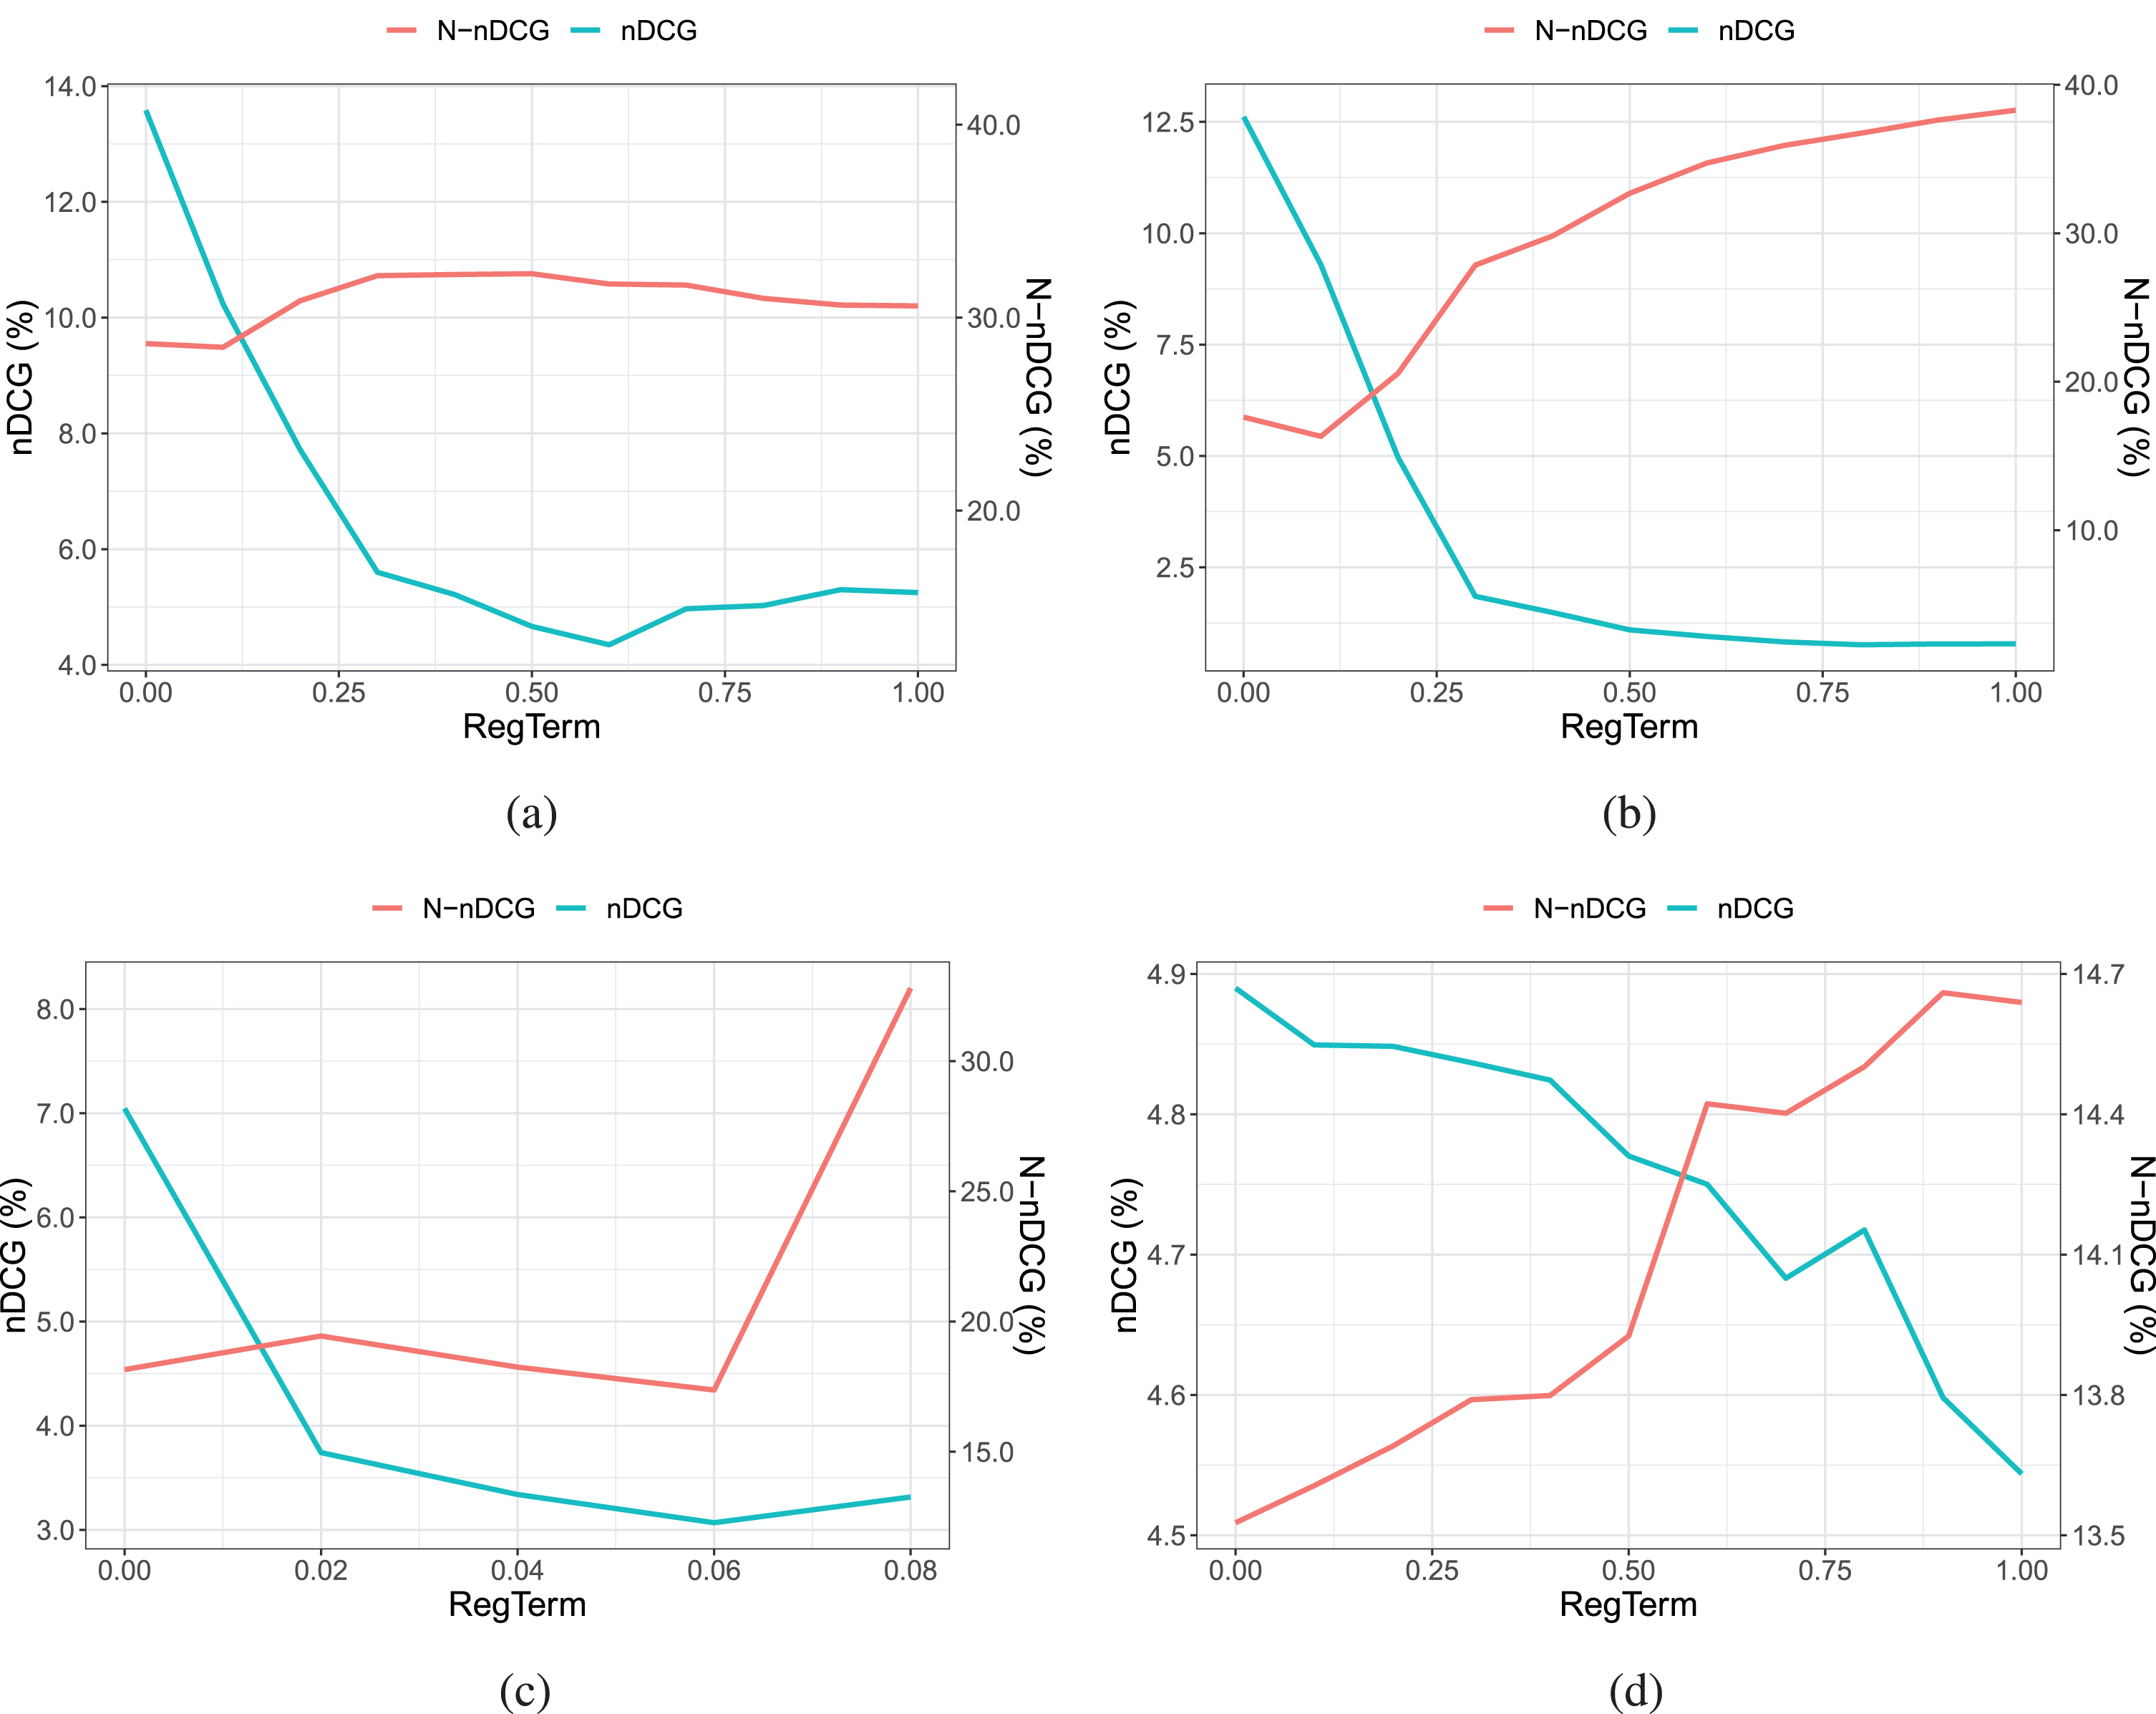
Sensitivity Analysis of Popularity-based NMF for (a) the ML100K, (b) the ML1M, (c) the ML20M and (d) Yelp - Las Vegas data sets.
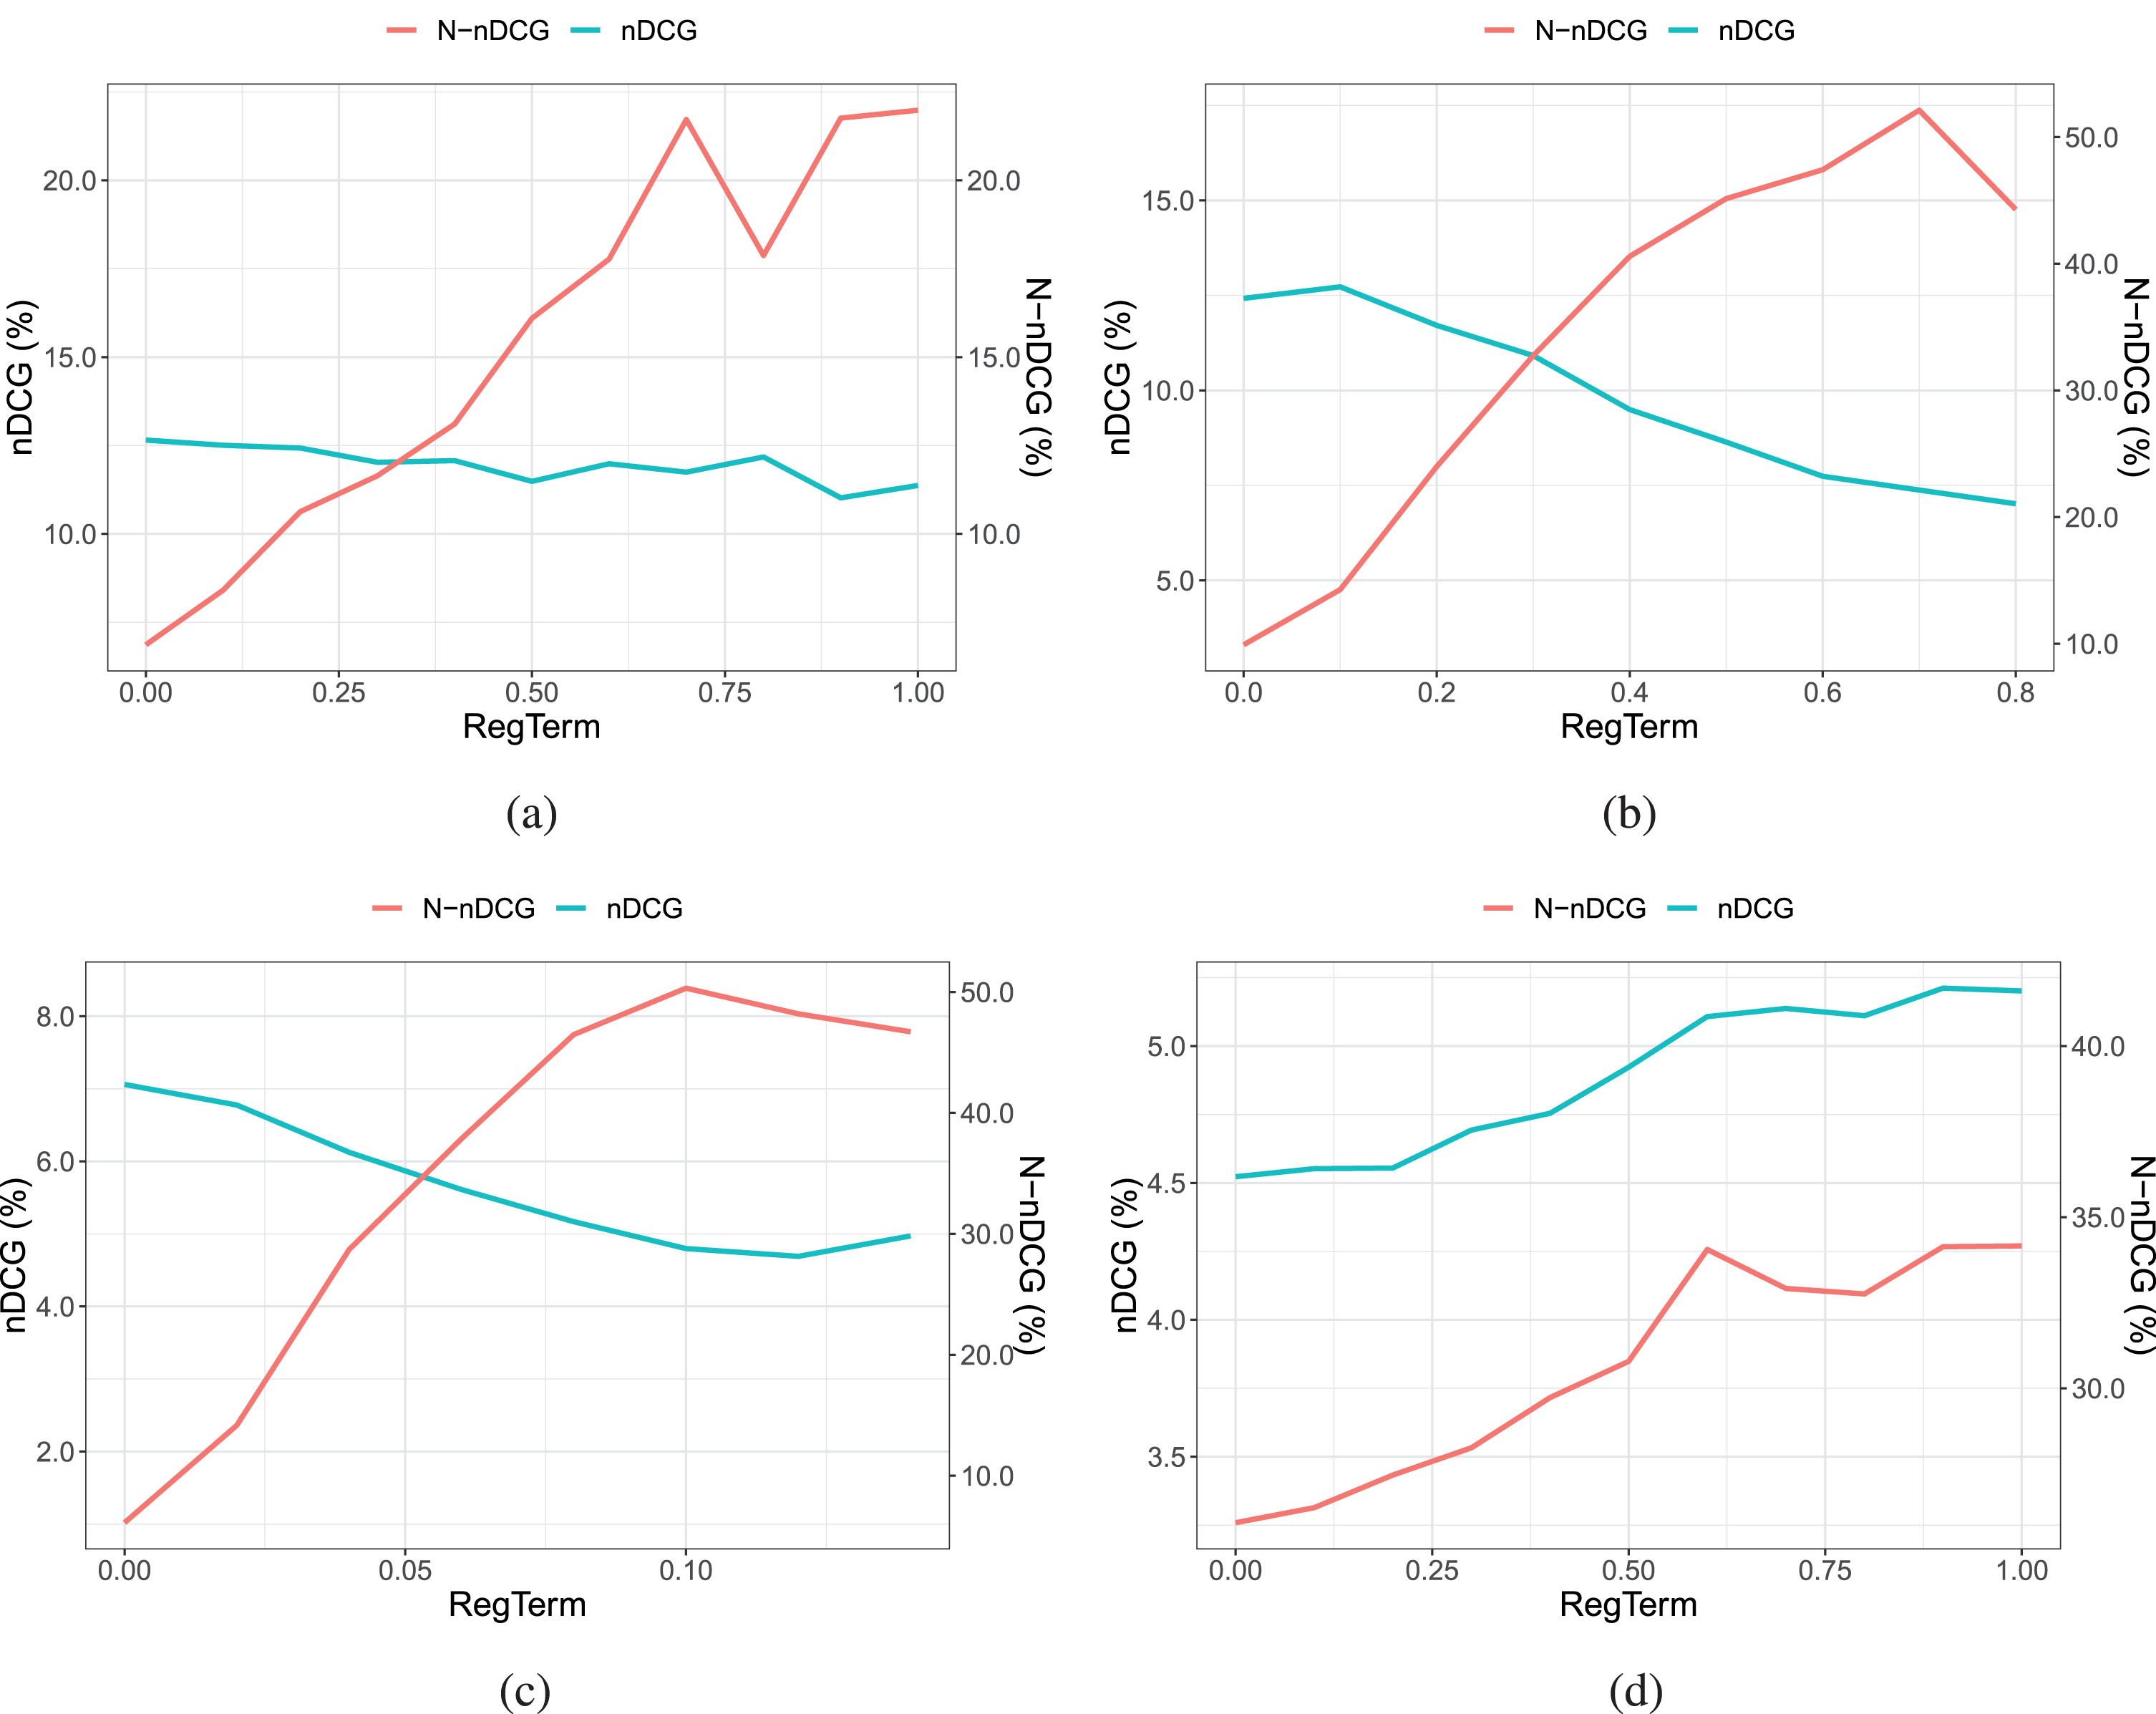
Sensitivity Analysis of Distance-based NMF for (a) the ML100K, (b) the ML1M, (c) the ML20M and (d) Yelp - Las Vegas data sets.
Table 3 shows the performance results for popularity-based novelty (ie., pop-NMF) and MF on four datasets, respectively, when we provide top-10 item recommendations. As it is shown in Table 3, our pop-NMF outperforms MF in terms of a more balanced performance between accuracy and novelty in all four data sets. The reason is that we put in the objective function of the classic matrix factorization and additional soft constraint, which pushes the more novel items to be recommended to the target user. These recommended items are those items which have not been seen by the users in the database (not the popular ones).
Algorithms’ comparison performance with top-10 recommended items on 4 data sets
Algorithms’ comparison performance with top-10 recommended items on 4 data sets
*Trade-off set at 0.5. †Server terminated the process due to resource starvation.
While compared to MMR, for ML100K, ML1M and Yelp, our proposed approach displayed again a balanced trade-off between novelty (N-nDCG and EPC) and precision (precision and nDCG).
Lastly, for the distance-based NMF as shown in Table 4, our Cat-NMF method provides in both data sets (ie., ML and Yelp) more novel item recommendations, when it is compared with MF + MMR, with minimum losses in terms of precision/nDCG. We were not able to get results on ML20M with MMR due to size of the dataset, it either required too much time (>5 days) or incurred in memory starvation.
Algorithms’ comparison performance with top-10 recommended items on 4 data sets
*Trade-off set at 0.5. †Server terminated the process due to resource starvation.
In this paper, we proposed a new framework for novel matrix factorization, denoted as NMF, that provides both novel and accurate item recommendations. In particular, this article introduced the distance-based item novelty, which extends the simple popularity-based item novelty model. Our empirical results have revealed the trade-off relationships between algorithmic item accuracy and novelty, and our proposed distance-based NMF effectively deals with both of these two aspects. In future work we also want to consider the diversity of recommendation lists. Finally, we want to perform more offline experiments with additional datasets, but also online evaluations of our NMF algorithm with real users to assess if and how users notice the increased novelty according to our proposed measure.
Footnotes
To capture the interaction between users and the item categories they have interacted with, we can build a user-category profile, composed of the user-item rating profile and the item-category profile (e.g., their dot product).
Please notice that every item in our datasets belongs to at least 1 category.
Jaccard similarity is particularly adequate for binary data. In this case we are considering the similarity in the context of the topic coverage.