
Abstract
Multi-center clustering algorithms have attracted the attention of researchers because they can deal with complex data sets more effectively. However, the reasonable determination of cluster centers and their number as well as the final clusters is a challenging problem. In order to solve this problem, we propose a multi-center clustering algorithm based on mutual nearest neighbors (briefly MC-MNN). Firstly, we design a center-point discovery algorithm based on mutual nearest neighbors, which can adaptively find center points without any parameters for data sets with different density distributions. Then, a sub-cluster discovery algorithm is designed based on the connection of center points. This algorithm can effectively utilize the role of multiple center points, and can effectively cluster non-convex data sets. Finally, we design a merging algorithm, which can effectively obtain final clusters based on the degree of overlapping and distance between sub-clusters. Compared with existing algorithms, the MC-MNN has four advantages: (1) It can automatically obtain center points by using the mutual nearest neighbors; (2) It runs without any parameters; (3) It can adaptively find the final number of clusters; (4) It can effectively cluster arbitrarily distributed data sets. Experiments show the effectiveness of the MC-MNN and its superiority is verified by comparing with five related algorithms.
Introduction
With the development of information technology, it is not difficult to collect data. However, how to better understand and utilize the collected data is a problem faced by various fields. Machine learning methods are effective tools for this problem. Classification and clustering are two of the most widely used machine learning methods. Classification is the division of data sets with prior knowledge. To improve the accuracy and efficiency of classification, many methods have been proposed [1, 2, 3, 4]. However, classification needs to know part of the data label information in advance. In many practical scenarios, it is difficult to know the data label information in advance. As an unsupervised machine learning method, clustering divides a data set into multiple clusters according to the inherent similarity of data, so that data within a cluster are similar, while data in different clusters are not similar. Partitioning unlabeled data is the basis for many studies and applications. In medicine, the classification of disease types can help doctors treat their patients more effectively and accurately [5, 6]. In business, the segmentation of customer groups and the discovery of communities facilitate effective marketing [7, 8, 9]. In information retrieval, the contents of documents are divided and sorted, which is convenient and efficient for information retrieval [10, 11, 12]. In traffic, detecting traffic incidents can help people to solve traffic congestion problems [13, 14, 15]. In image recognition, it helps people to better segment and recognize images [16, 17]. In addition, clustering is often used as a pre-step in other studies [18, 19, 20]. With the increasing of the volume of the data and the complexity of the data, the classic clustering algorithms [21, 22, 23, 24, 25] show their limitations.
K-means algorithm [21] is a simple and widely used classic clustering algorithm based on partition. It needs to specify the initial clustering centers and form stable clustering results through continuous iterations. Each cluster has a center. This algorithm is suitable for convex data sets with Gaussian distribution. For many complex data sets, it is difficult to use one center to represent a cluster, and the K-means algorithm is no longer effective. DBSCAN algorithm [23] is a classic density based clustering algorithm. It no longer uses a center point to represent a cluster, but defines a cluster as a set of the largest density connected data points. The algorithm can find clusters with arbitrary shape. However, the definition of density connected data points depends on the two parameters: Eps and MinPts. Different values of Eps and MinPts need to be specified for different data sets, and it is difficult to get a suitable Eps and MinPts without prior knowledge. Even with suitable Eps and MinPts, DBSCAN still fails for clusters with varying densities. The model-based clustering algorithm also does not need to specify clustering centers. The algorithm assumes that all clusters in the data set obey a certain probability distribution, and the data set fits a mixture model [26, 27]. The final clustering result is found by the optimal parameter values of the model. Model-based clustering algorithms usually assume that all clusters obey the same type of model with different parameters. Based on this assumption, the algorithm has poor clustering effect on data sets with multiple distributions. The grid-based clustering algorithm divides the data set into multiple grids, transforms the data clustering into the grid clustering, and improves the clustering efficiency. Some improved grid-based clustering algorithms can effectively cluster data with non-uniform density distribution by dividing the data using grids of different sizes [28, 29], but it is difficult to set appropriate grids sizes without prior knowledge. The Chameleon algorithm is a hierarchical clustering algorithm [30] that can be used for non-convex data sets. The algorithm uses a node to represent a data point, and an edge between nodes represents the similarity of two nodes to form a graph. After that, the algorithm divides the graph composed of data points into multiple sub-clusters, and then merges the sub-clusters to obtain the clusters. The algorithm can effectively cluster data sets with non-convex shapes. However, the Chameleon algorithm is sensitive to the parameters involved. In order to better cluster complex data, many researchers have proposed adaptive clustering algorithms based on multi-centers.
Liang [31] designed a multi-center clustering method called MC. The MC algorithm sets multiple centers for large clusters, and the number of data points represented by each center is equal to that of small clusters to avoid the phenomenon that k-means algorithm wrongly clusters the data of larger clusters into small clusters (uniform effect). The algorithm has a good effect on imbalanced data sets, but has a poor effect on non-convex data sets. Tao [32] proposed a multi-center clustering algorithm which can effectively cluster non-convex data sets, and the two-level hierarchical subtractive clustering algorithm was employed to effectively cluster large-scale data. But, the performance of this algorithm on data sets with overlapping between clusters is poor. Xia et al. [33] proposed a clustering method named WC-KNNG-PC. If the parameters are set properly, then WC-KNNG-PC algorithm can find clusters and noises in complex data sets and has good clustering result. However, its efficiency is very poor because it needs many iterations to obtain appropriate parameters, especially for real data sets. Lu et al. [34] proposed a clustering algorithm based on multi-center competitive learning (SMCL). It uses multiple subsets (each subset has a center) to represent a cluster, and automatically adjusts the number of subsets through competitive learning until it is stable. This method uses multiple centers to represent a cluster, which is suitable for data sets with unbalanced distribution. However, the algorithm iteratively finds stable clustering results in the process of competitive learning. So the algorithm is time-consuming. Density peak clustering (DPC) [35] is a clustering algorithm which takes the density peak points (data points with the highest density in the local area) as the cluster centers. It manifests its strengths in a non-iterative way. Bie et al. [36] proposed an improved DPC algorithm, which selects more data points than the actual number of cluster centers as density peak points to form sub-clusters, and then merges the sub-clusters to form the final clustering result, but this algorithm is easy to ignore clusters with sparse density. A multi-center density peak clustering algorithm called McDPC algorithm, is proposed by Wang et al. [37]. The algorithm stratifies the density and selects the density peak points from different density regions. It is able to find clusters with sparse density. However, compared with the DPC algorithm, the algorithm added three new parameters. The algorithm sets different parameter values for different data sets, and requires multiple debugging to find the optimal parameter values. This is not realistic for practical applications that do not know the data labels.
According to the above analysis, the multi-center clustering algorithm can solve the problem with arbitrarily distributed data sets, but there are still some problems. The main problems encountered by the current multi-center clustering algorithms include: (1) How to better set the values of parameters; (2) How to obtain the proper multiple center points; (3) How to merge sub-clusters; (4) How to determine the final number of clusters. Aiming at these problems, we propose a multi-center clustering algorithm based on mutual nearest neighbors. Firstly, the algorithm obtains multiple center points by finding the nearest neighbors and the mutual nearest neighbors of each data point, and classifies the neighbors into its center point; Then, sub-clusters were obtained through continuously connecting center points that fall in each other’s neighborhood, and data points that are not classified into any sub-cluster are the noise points; Finally, a sub-clusters merging algorithm is designed to judge the final number of clusters by using two indicators (distance between sub-clusters and overlapping degree of sub-clusters), so as to get the final clustering results. The main contributions of this article are:
A new clustering algorithm MC-MNN was proposed for arbitrarily distributed data sets. The algorithm does not need any parameters. An algorithm to automatically find multiple center points was proposed for data sets with different density distributions. A sub-cluster construction method based on the connection of center points was proposed for data sets with different shapes. A sub-cluster merging algorithm to automatically find the number of final clusters was proposed.
The rest of this article is organized as follows. The related concepts are briefly introduced in Section 2. Section 3 introduces MC-MNN algorithm in detail. The experimental results and comparison algorithms are introduced in Section 4, and conclusions are given in Section 5.
This section introduces the concepts of K nearest neighbors, reverse nearest neighbors and mutual nearest neighbors related to the proposed algorithm MC-MNN.
(K nearest neighbors [38, 39]).
Given a data set
The K-nearest neighbor method is used in classification [40, 41, 42]. Its core idea is that, given a training set, for a new input data point, first find its
(Reverse
nearest neighbors).
The reverse
Both
(Mutual
nearest neighbors).
The mutual
If
The proposed method MC-MNN includes 3 steps: (1) Center points discovery, a multi-center points discovery algorithm based on mutual nearest neighbors is designed, which can make full use of data structure information and automatically discover multiple center points. (2) Sub-cluster generation, an algorithm based on the connection of center points is designed, which can effectively obtain sub-clusters and noise points. (3) Sub-clusters merging, a sub-cluster merging algorithm based on distance and overlapping degree is designed, which can merge sub-clusters to obtain the final clusters. The proposed algorithm MC-MNN uses the
The process of determining the center points.
(The
-th nearest neighbor).
Given a data set
(The
-th mutual nearest neighbor).
If
In this section, we propose a multi-center discovery algorithm based on the mutual nearest neighbors. The algorithm does not need to set parameters, and can automatically find center points through the mutual neighbor relationship of data points.
Given a data set
In [49], authors proposed an adaptive method to automatically determine the number
where
The process of obtaining center points
*The rows where the center points are located are gray.
We make use of the above idea of determining number
For each data point
Data set and its center points. (a) data set; (b) center points.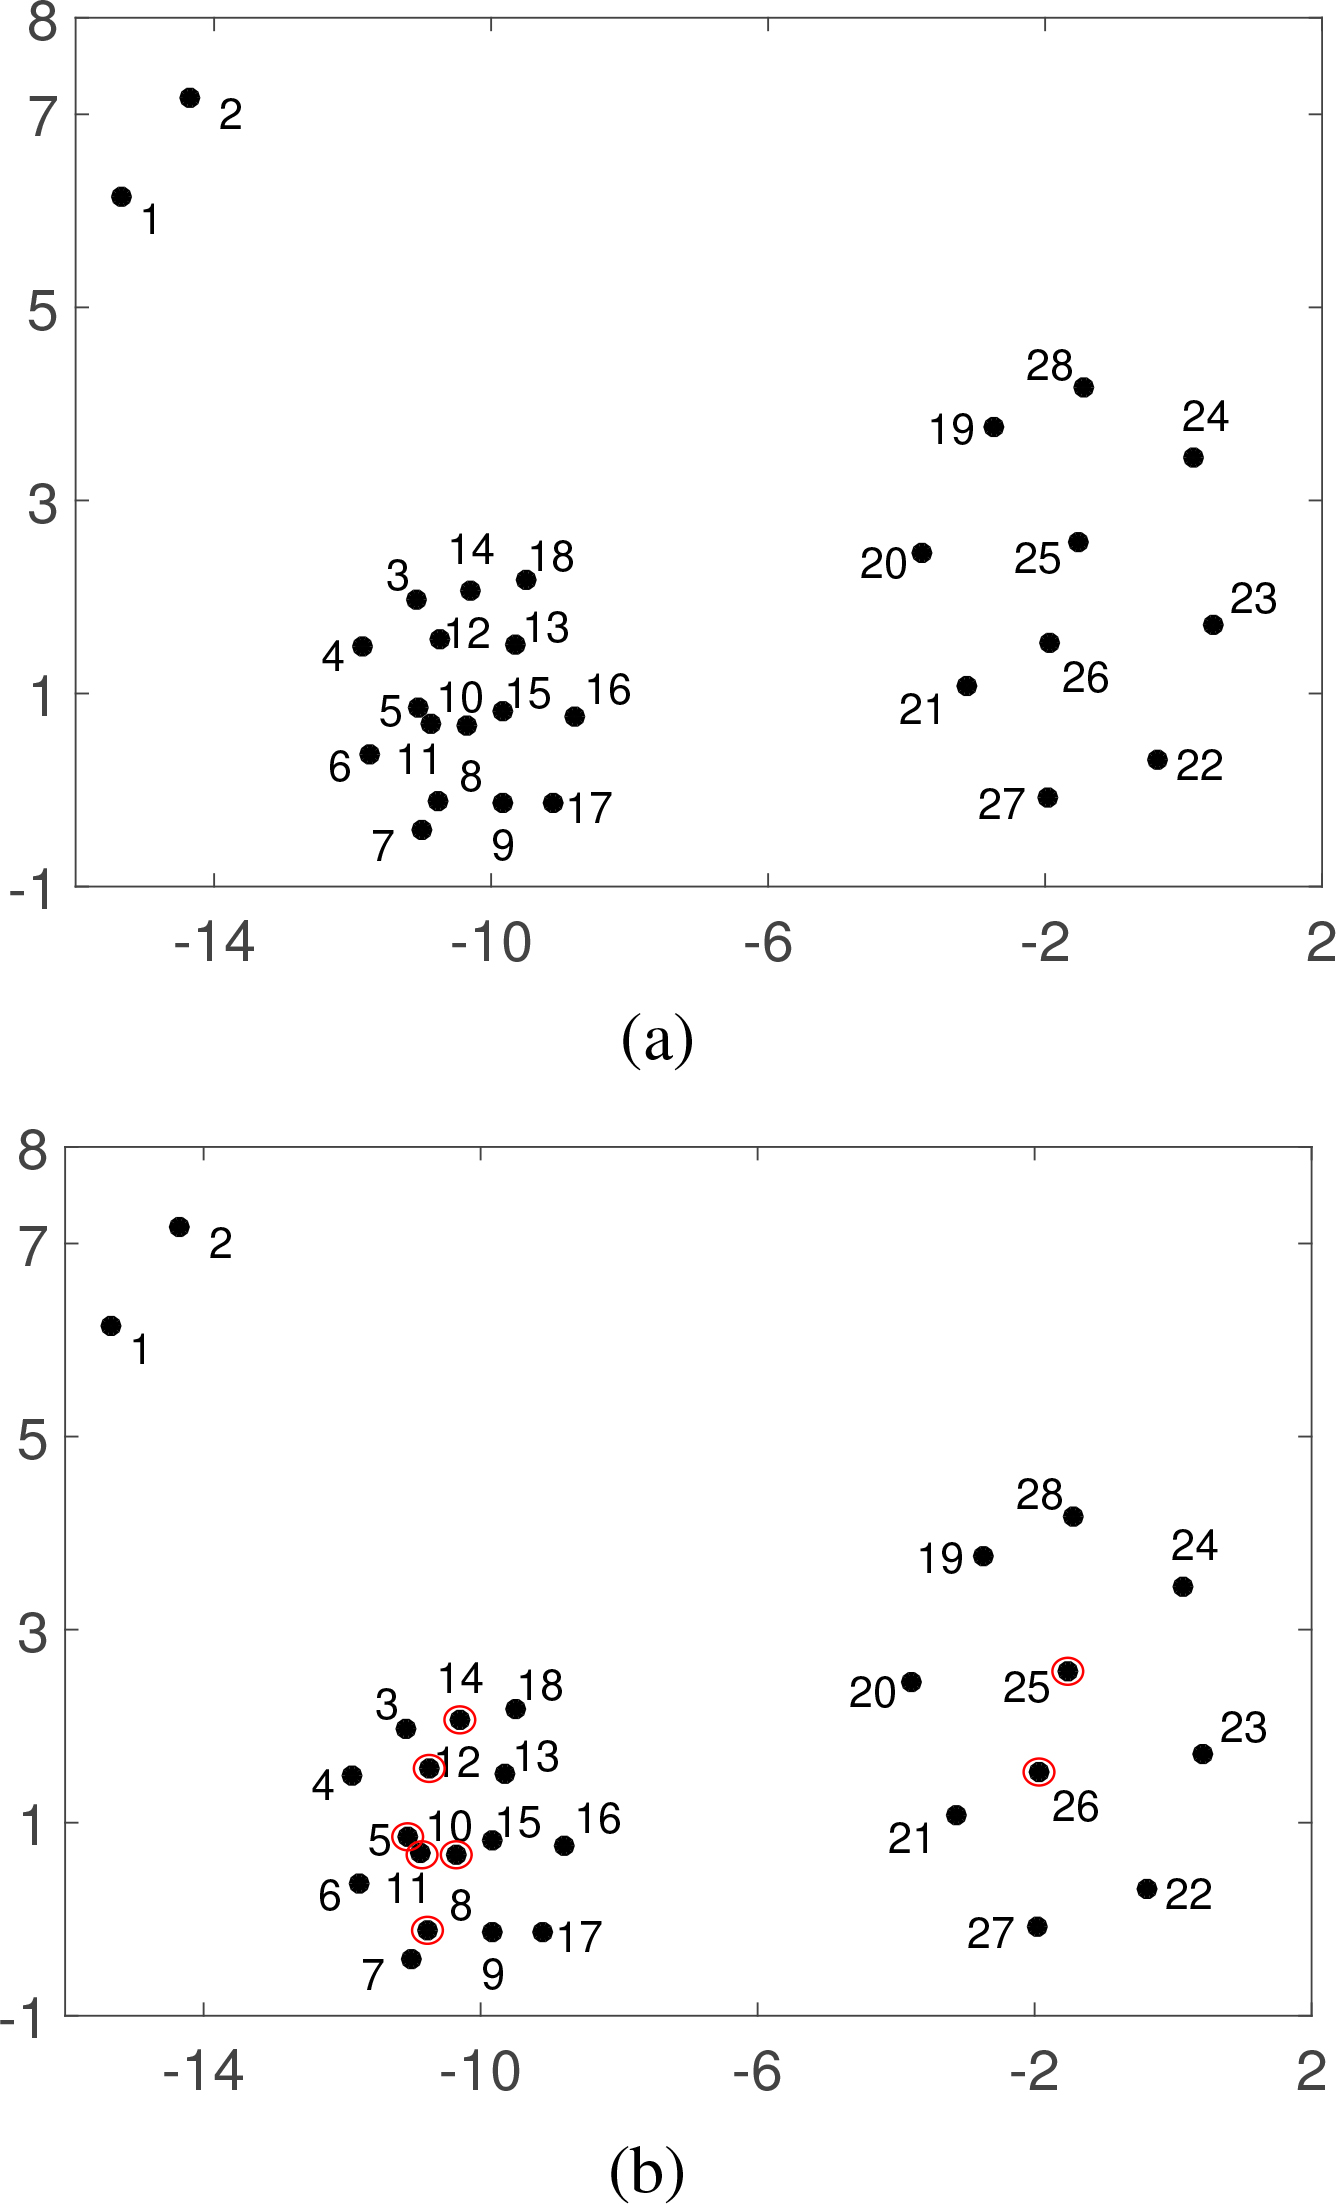
When the searching ends, each data point
In order to further illustrate the determination process of the center points, we take the data set in Fig. 2 as an example and gradually determine the center point through Table 1. Figure 2a shows a data set with different density distributions. Table 1 shows the process of finding
It can be intuitively seen from Fig. 2a and b that there are two clusters in the data set and these two clusters have different density distributions. The center points found locate in the center regions of two clusters. This indicates that the proposed center points discovery method which is based on the mutual nearest neighbors of points is not affected by the density distribution of data points. So the method is suitable for data sets with nonuniform density distribution.
The multi-center discovery algorithm is summarized in Algorithm 1. Line 5 determines the
After obtaining the center points, let
We use the previous example to illustrate the process of generation sub-clusters in Fig. 3. Note that the center point set
An example to generate sub-clusters. (a) searching process; (b) sub-clusters.
The sub-cluster generation process is summarized in Fig. 4, where rectangles represent non-center points, and the ellipses represent the center points.
The sub-cluster generating process.
After obtaining sub-clusters, we designed a sub-clusters merging algorithm. The algorithm uses two metrics (distance and overlapping degree between sub-clusters) to judge the relationship between sub-clusters, which can make better use of the inherent information of data sets and obtain good merging results. For any two sub-clusters
The overlapping degree of clusters
where
The distance between sub-clusters refers to the minimum distance between data point pairs of two sub-clusters. For sub-clusters
Obviously, if the overlapping degree between every pair of sub-clusters in a data set is zero, then the sub-clusters are the final clusters, and there is no need to merge them, else, we use grouping algorithm used in [31, 34] to merge the sub-clusters. Suppose there are
Set
Merge
Use the distance between sub-clusters
Then, we can define
To eliminate the discrepancy of two metrics, we normalized two metrics
The higher the overlapping degree between the two sub-clusters is, the more priority of merging they should have. Similarly, the smaller the distance between the two sub-clusters is, the more necessary they should be to merge. In order to consider these two metrics simultaneously, we integrate these two metrics into one as follows: First, define
Then we define the degree of difficulty of merging
The larger the value of
Selection process of 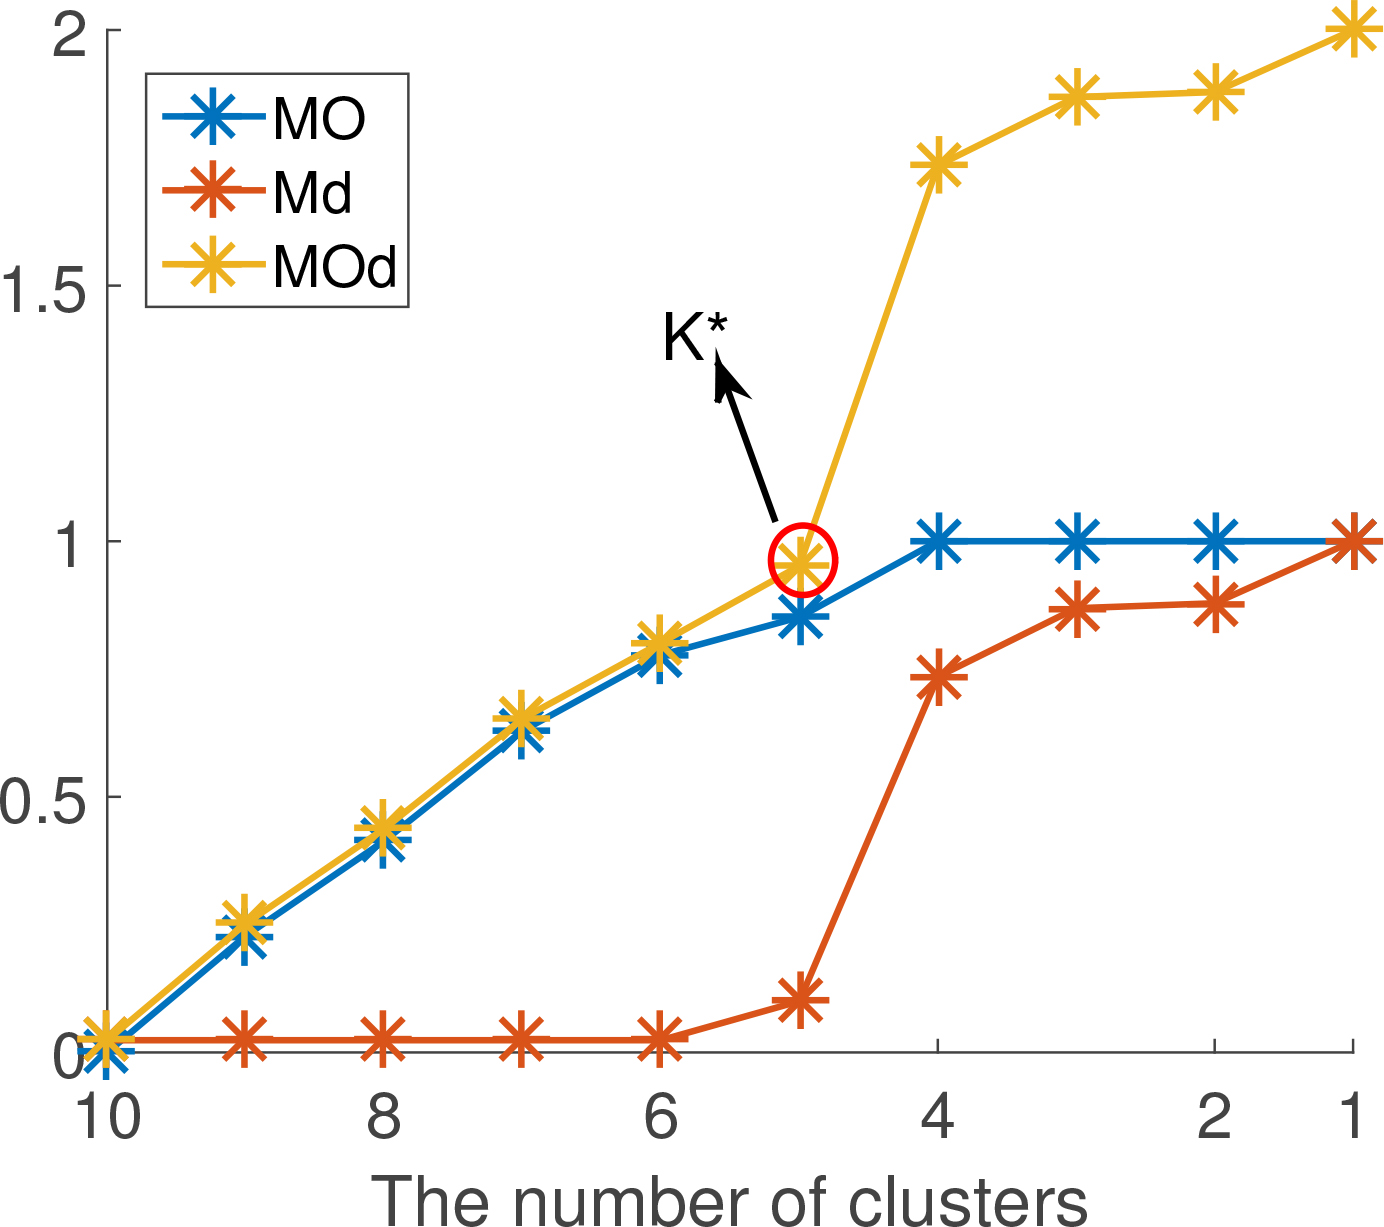
Now, the noises are assigned into the clusters which should belong to, and obtain the final clustering results. The sub-clusters merging process was summarized in Algorithm 3.
[htp]
Figure 6 shows the clustering process of the proposed algorithm on data set Spiral without any overlap between the sub-clusters. The center points found are shown in red circles as shown in Fig. 6a. And the three sub-clusters found which have not any shared data points in their
Example for sub-clusters not requiring merging. (a) data set and its center points; (b) clustering result.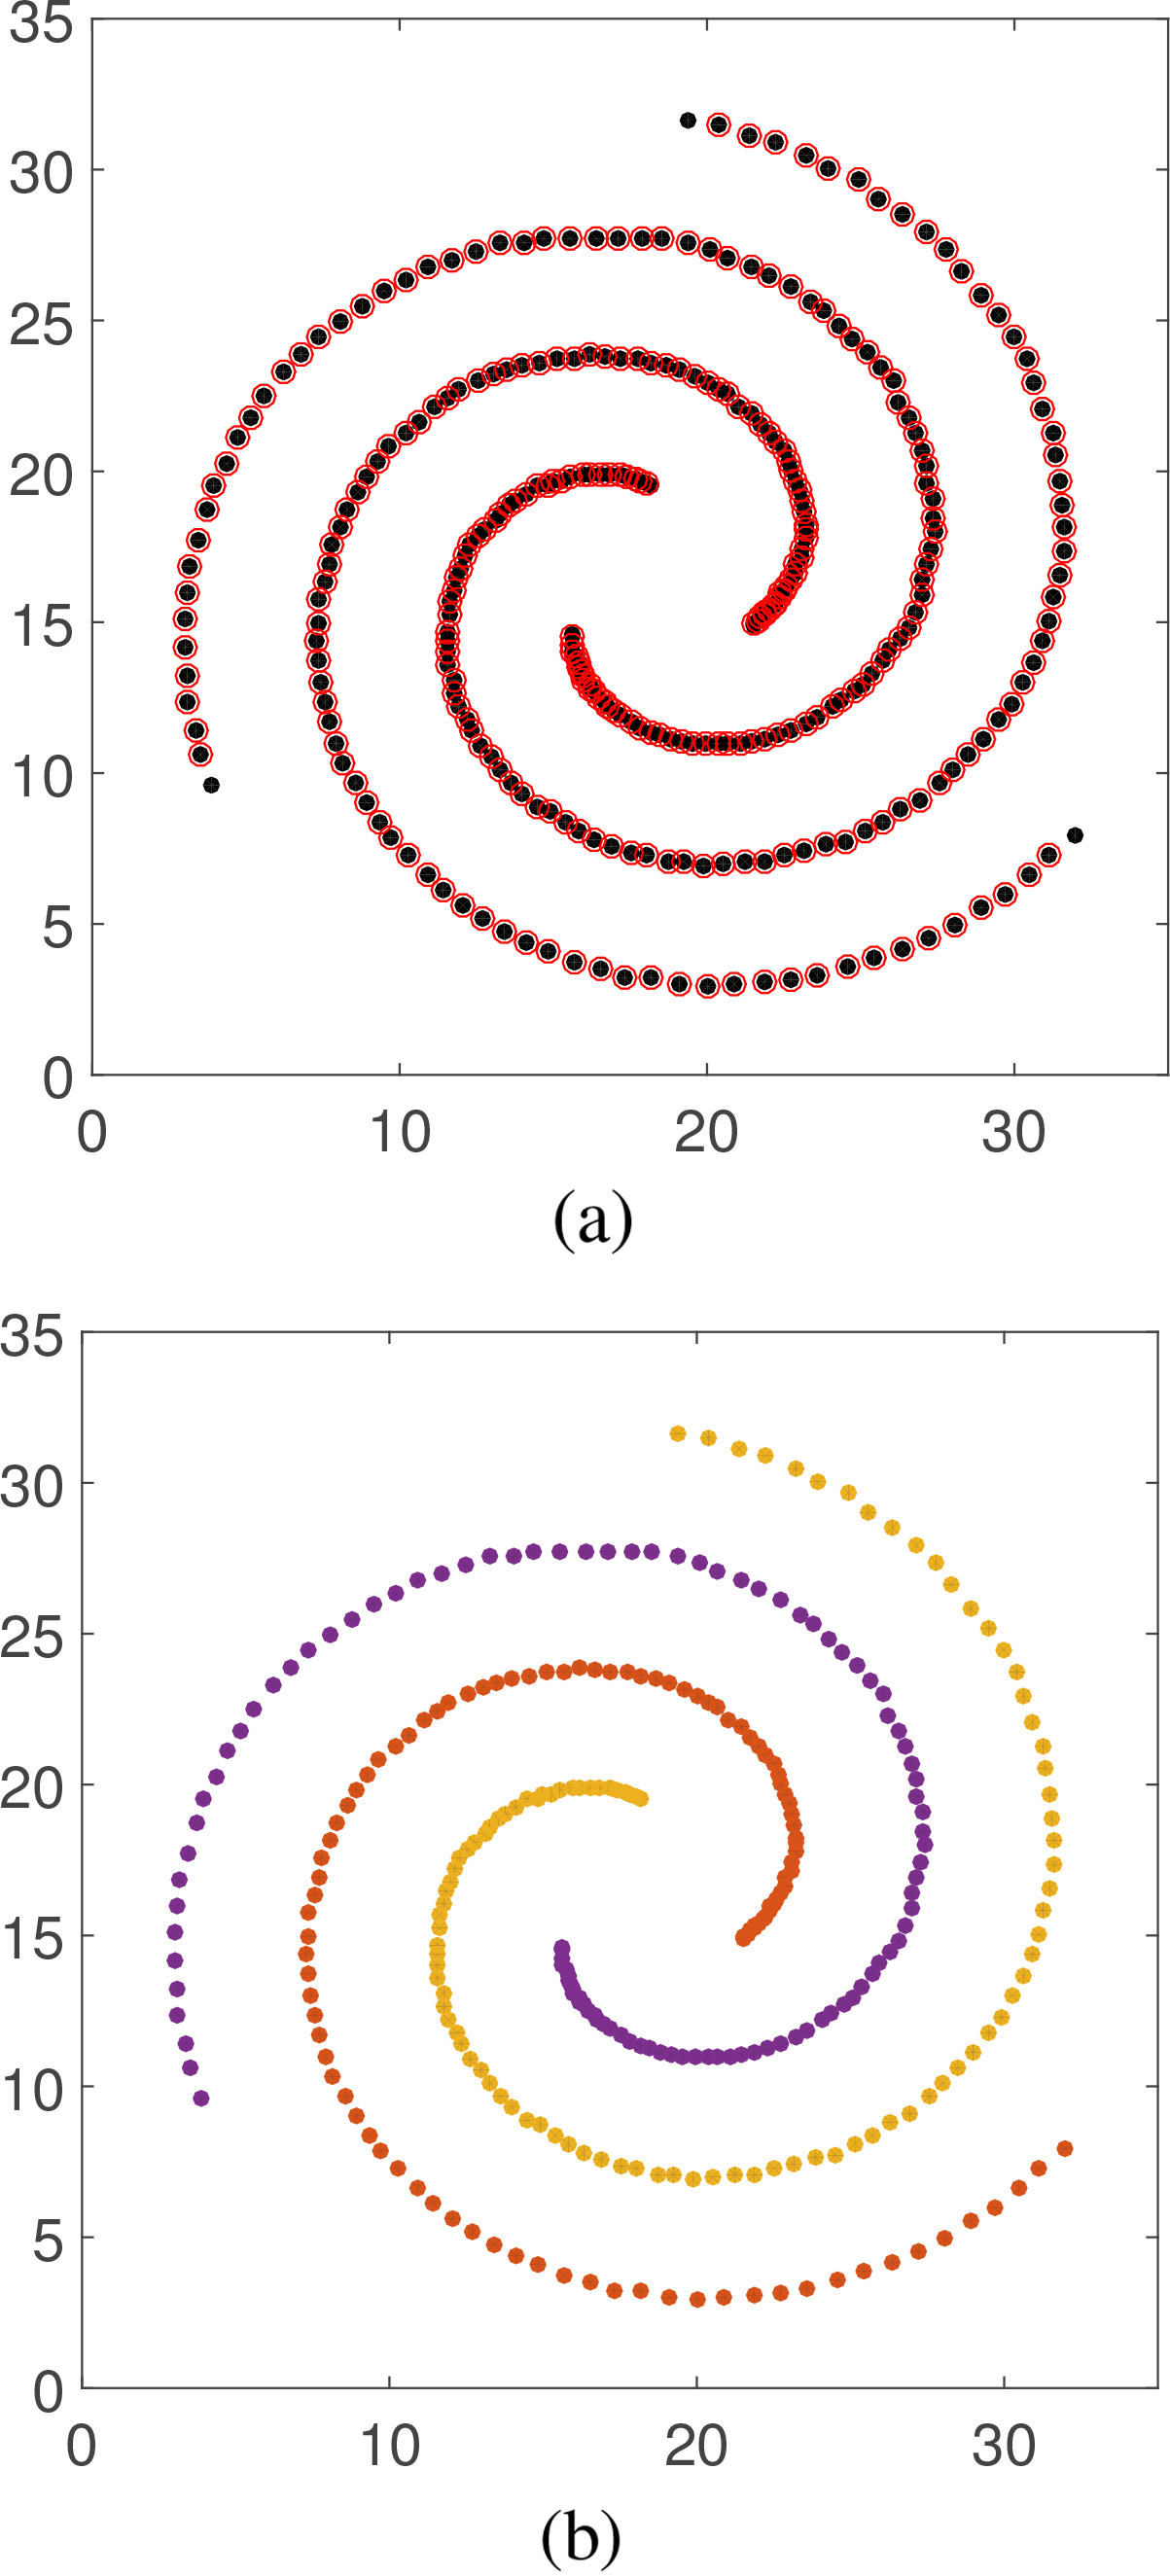
The 15 data sets and their features
Figure 7 shows the merging process of the proposed algorithm on data set Ids2. Figure 7a shows 11 sub-clusters found. The determined number of cluster is shown in Fig. 7b. Figure 7c shows the result of merging sub-clusters, data points in black are noise points. The clustering result after assigning the noise points is shown in Fig. 7d.
Sub-cluster merging procedure.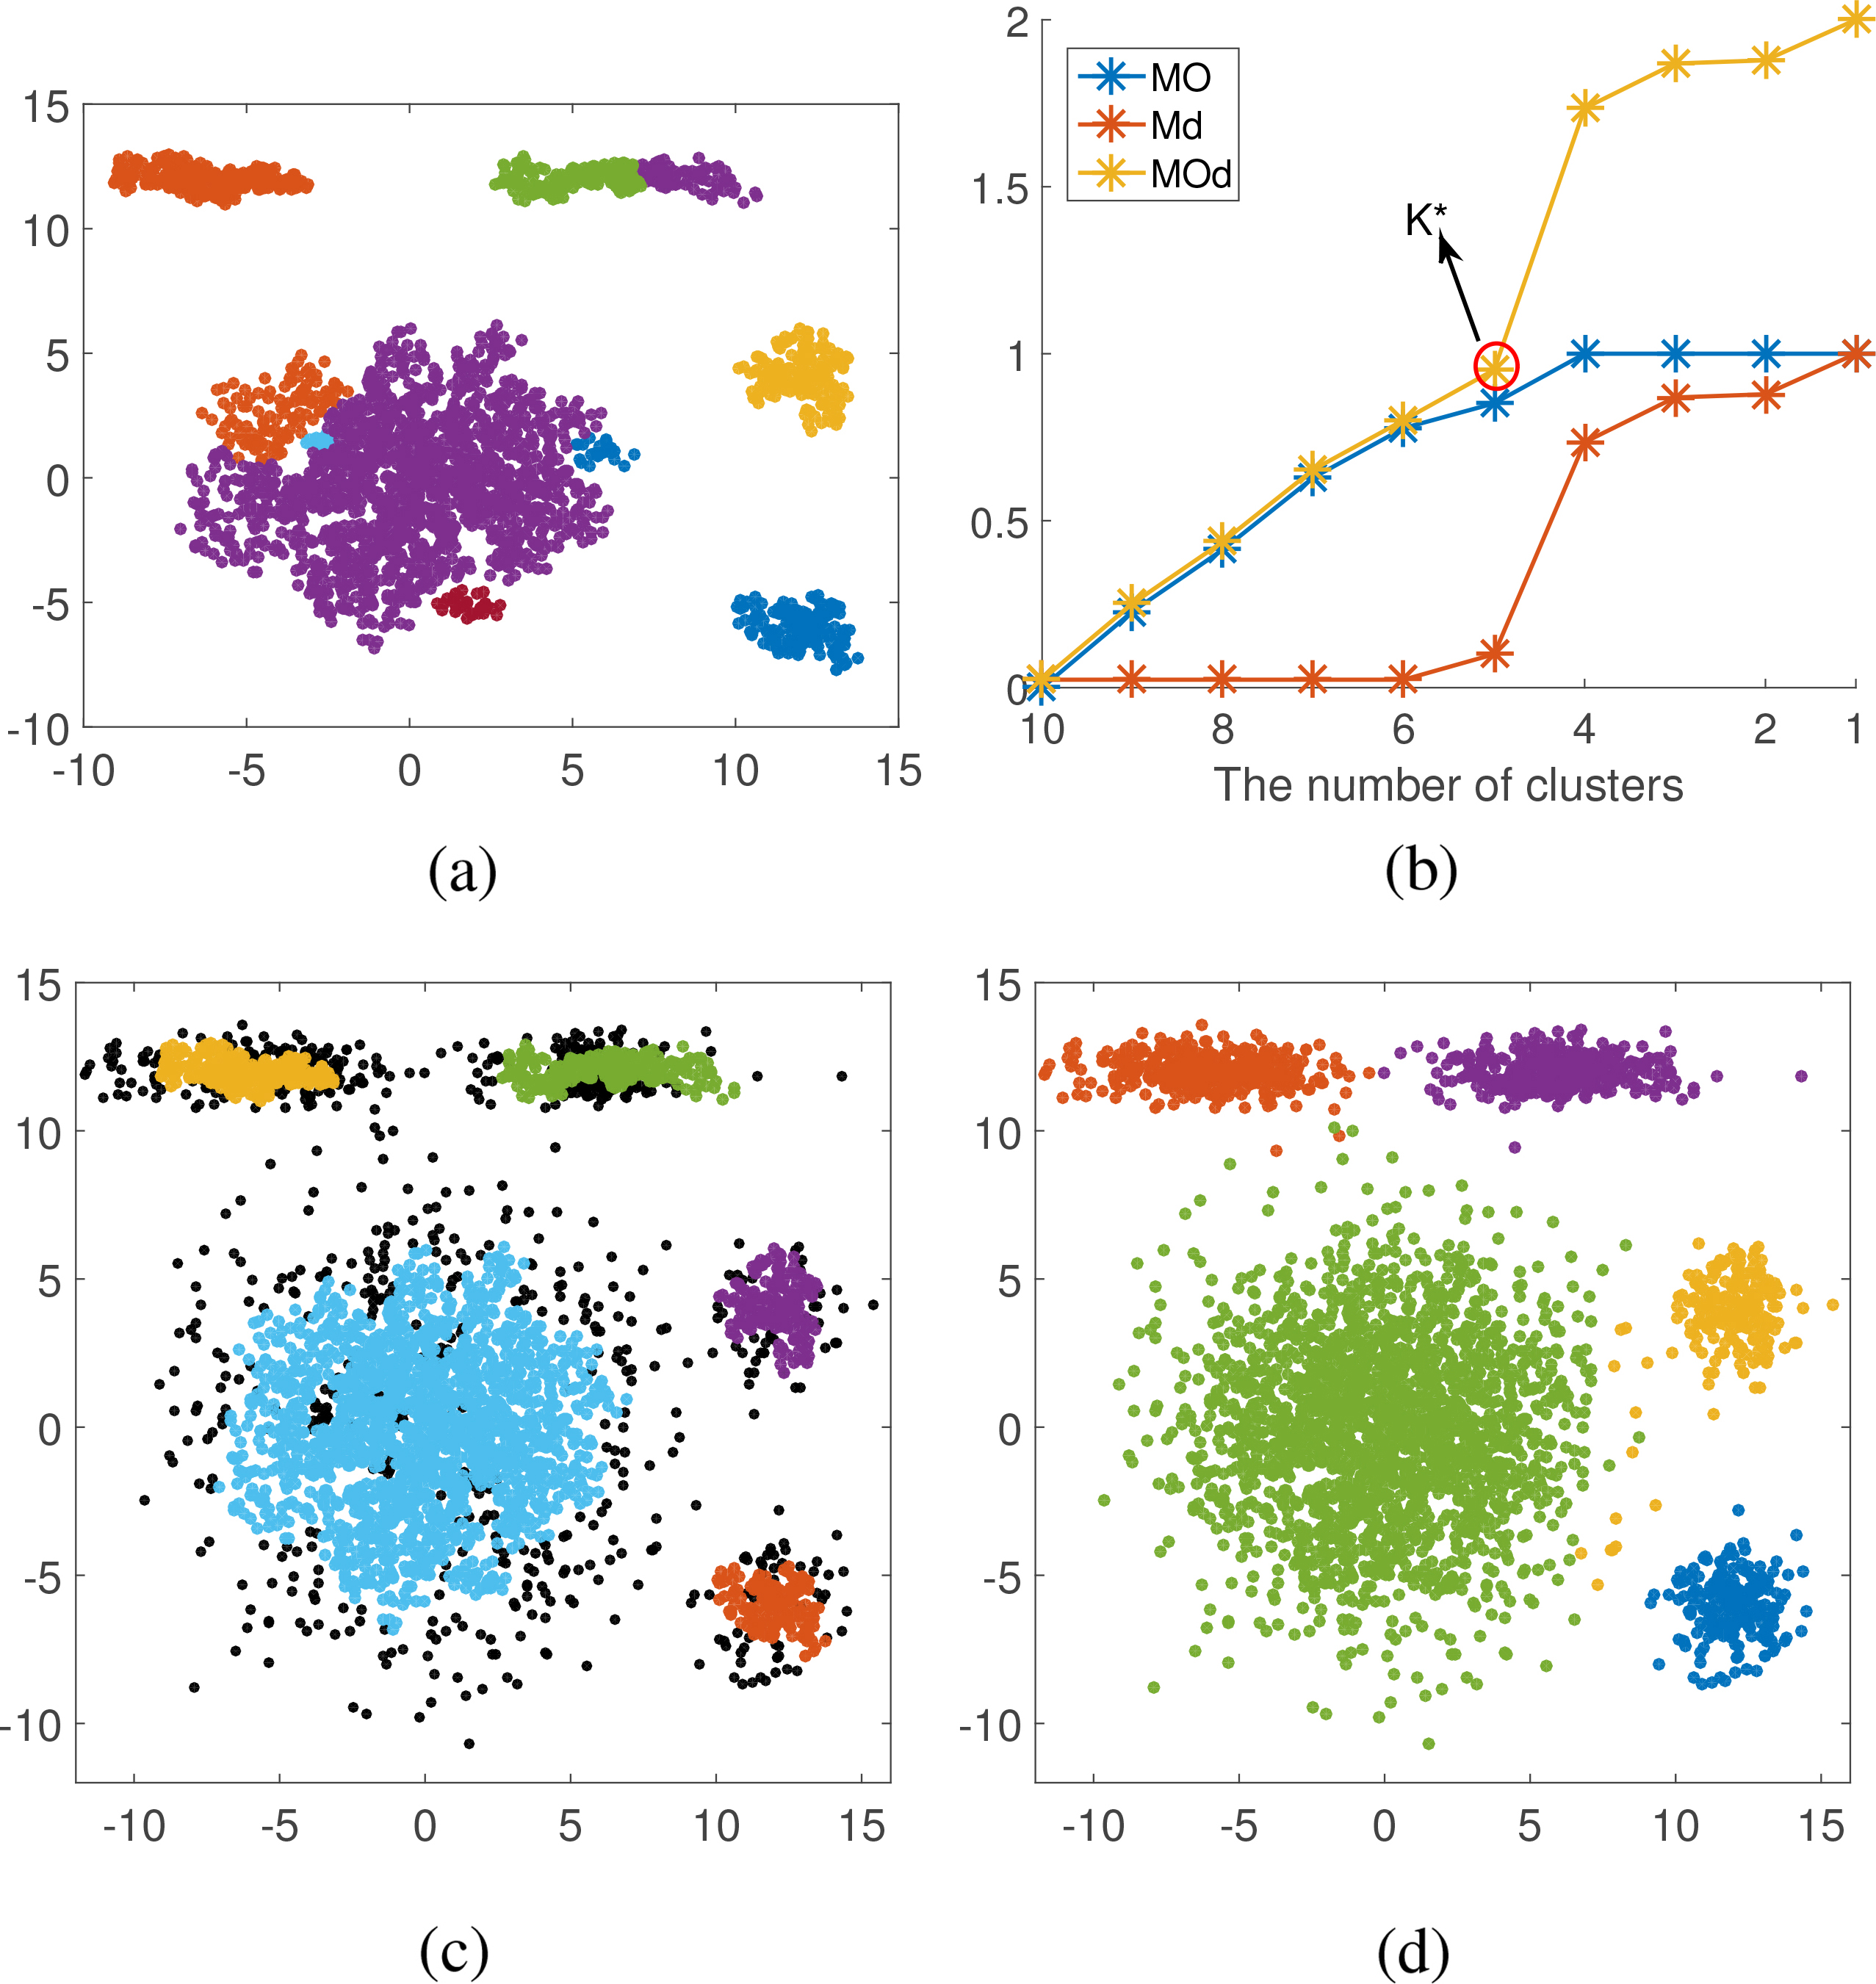
For a data set
Experimental results
Data sets and the compared algorithms
In order to test clustering results of the proposed algorithms MC-MNN on arbitrarily distributed data sets, the 15 data sets include convex or non-convex data sets, data sets with similar cluster sizes or with large differences in cluster size, and data set with or without noise are shown in Table 2. Among them, the first six data sets are synthetic data sets and the last nine are real data sets, where data sets Banana and Lithuanian are the non-convex with thick lines, while data set Circles is the non-convex with thin lines. Data sets Circles and Aggregation are with similar cluster sizes, and the data sets Lithuanian, Banana, Gaussian and Ids2 are with large differences in cluster size. Nine real data sets have different dimensions, number of samples, and the number of clusters, where Olivetti face is an image data set. We used principal component analysis tool to preprocess the real data sets.
To identify the superiority of the proposed algorithm MC-MNN, we compared MC-MNN with the five related clustering algorithms McDPC [37], SMCL [34], Fuzzy-CFSFDP [36], DPADN [54], and SNNDPC [55]. Among them, McDPC [37], SMCL [34], DPADN [54], and Fuzzy-CFSFDP [36] are all based on multi-centers, SNNDPC [55] is a clustering algorithm based on shared nearest neighbors for arbitrary shape. All experiments were tested on a Windows 10 PC with an Intel i7 3.30 GHz CPU and 16 GB RAM.
Experimental results
The clustering process of MC-MNN for 6 synthetic data sets
The MC-MNN algorithm includes three parts: center points discovery, sub-cluster construction, the cluster number determination and the final clusters acquisition. In order to more clearly demonstrate the experimental process and results of the algorithm on the data sets, Figs 8–13 show the clustering process on six synthetic data sets.
Data set Gaussian. (a) center point determination. (b) sub-cluster obtaining. (c) number of cluster determination. (d) clustering result.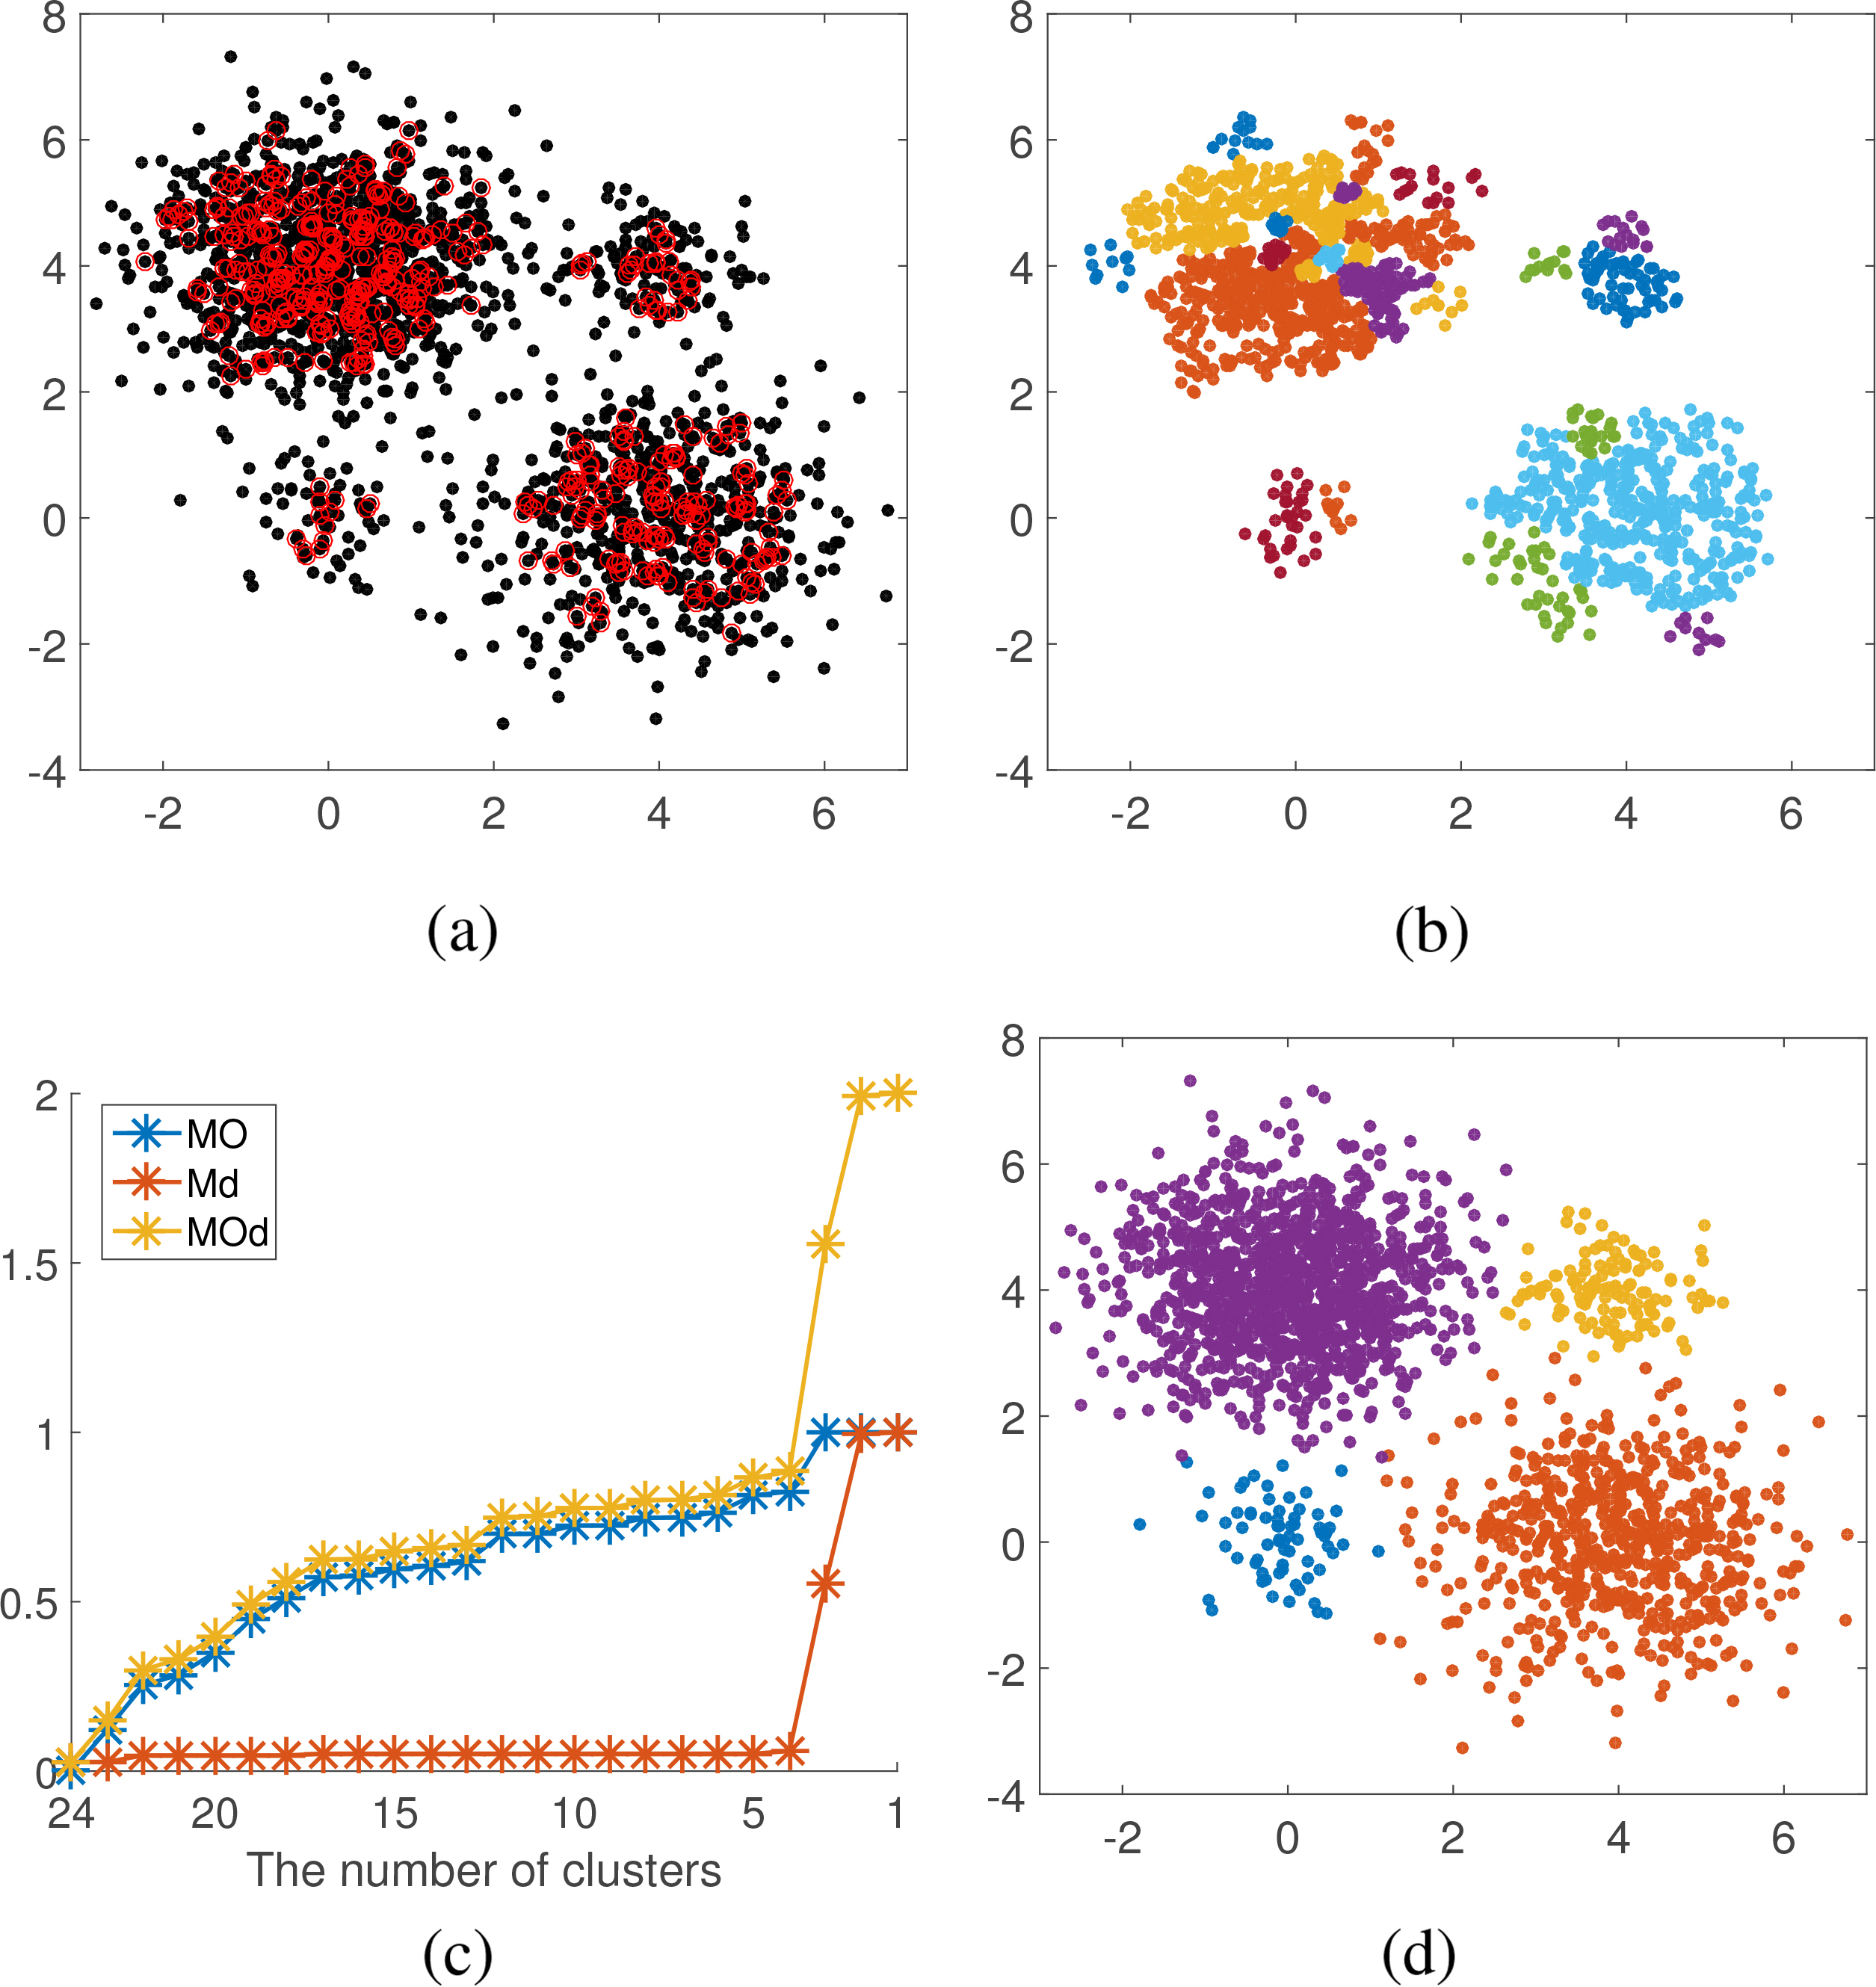
Data set Ids2. (a) center point determination. (b) sub-cluster obtaining. (c) number of cluster determination. (d) clustering result.
Data set aggregation. (a) center point determination. (b) sub-cluster obtaining. (c) number of cluster determination. (d) clustering result.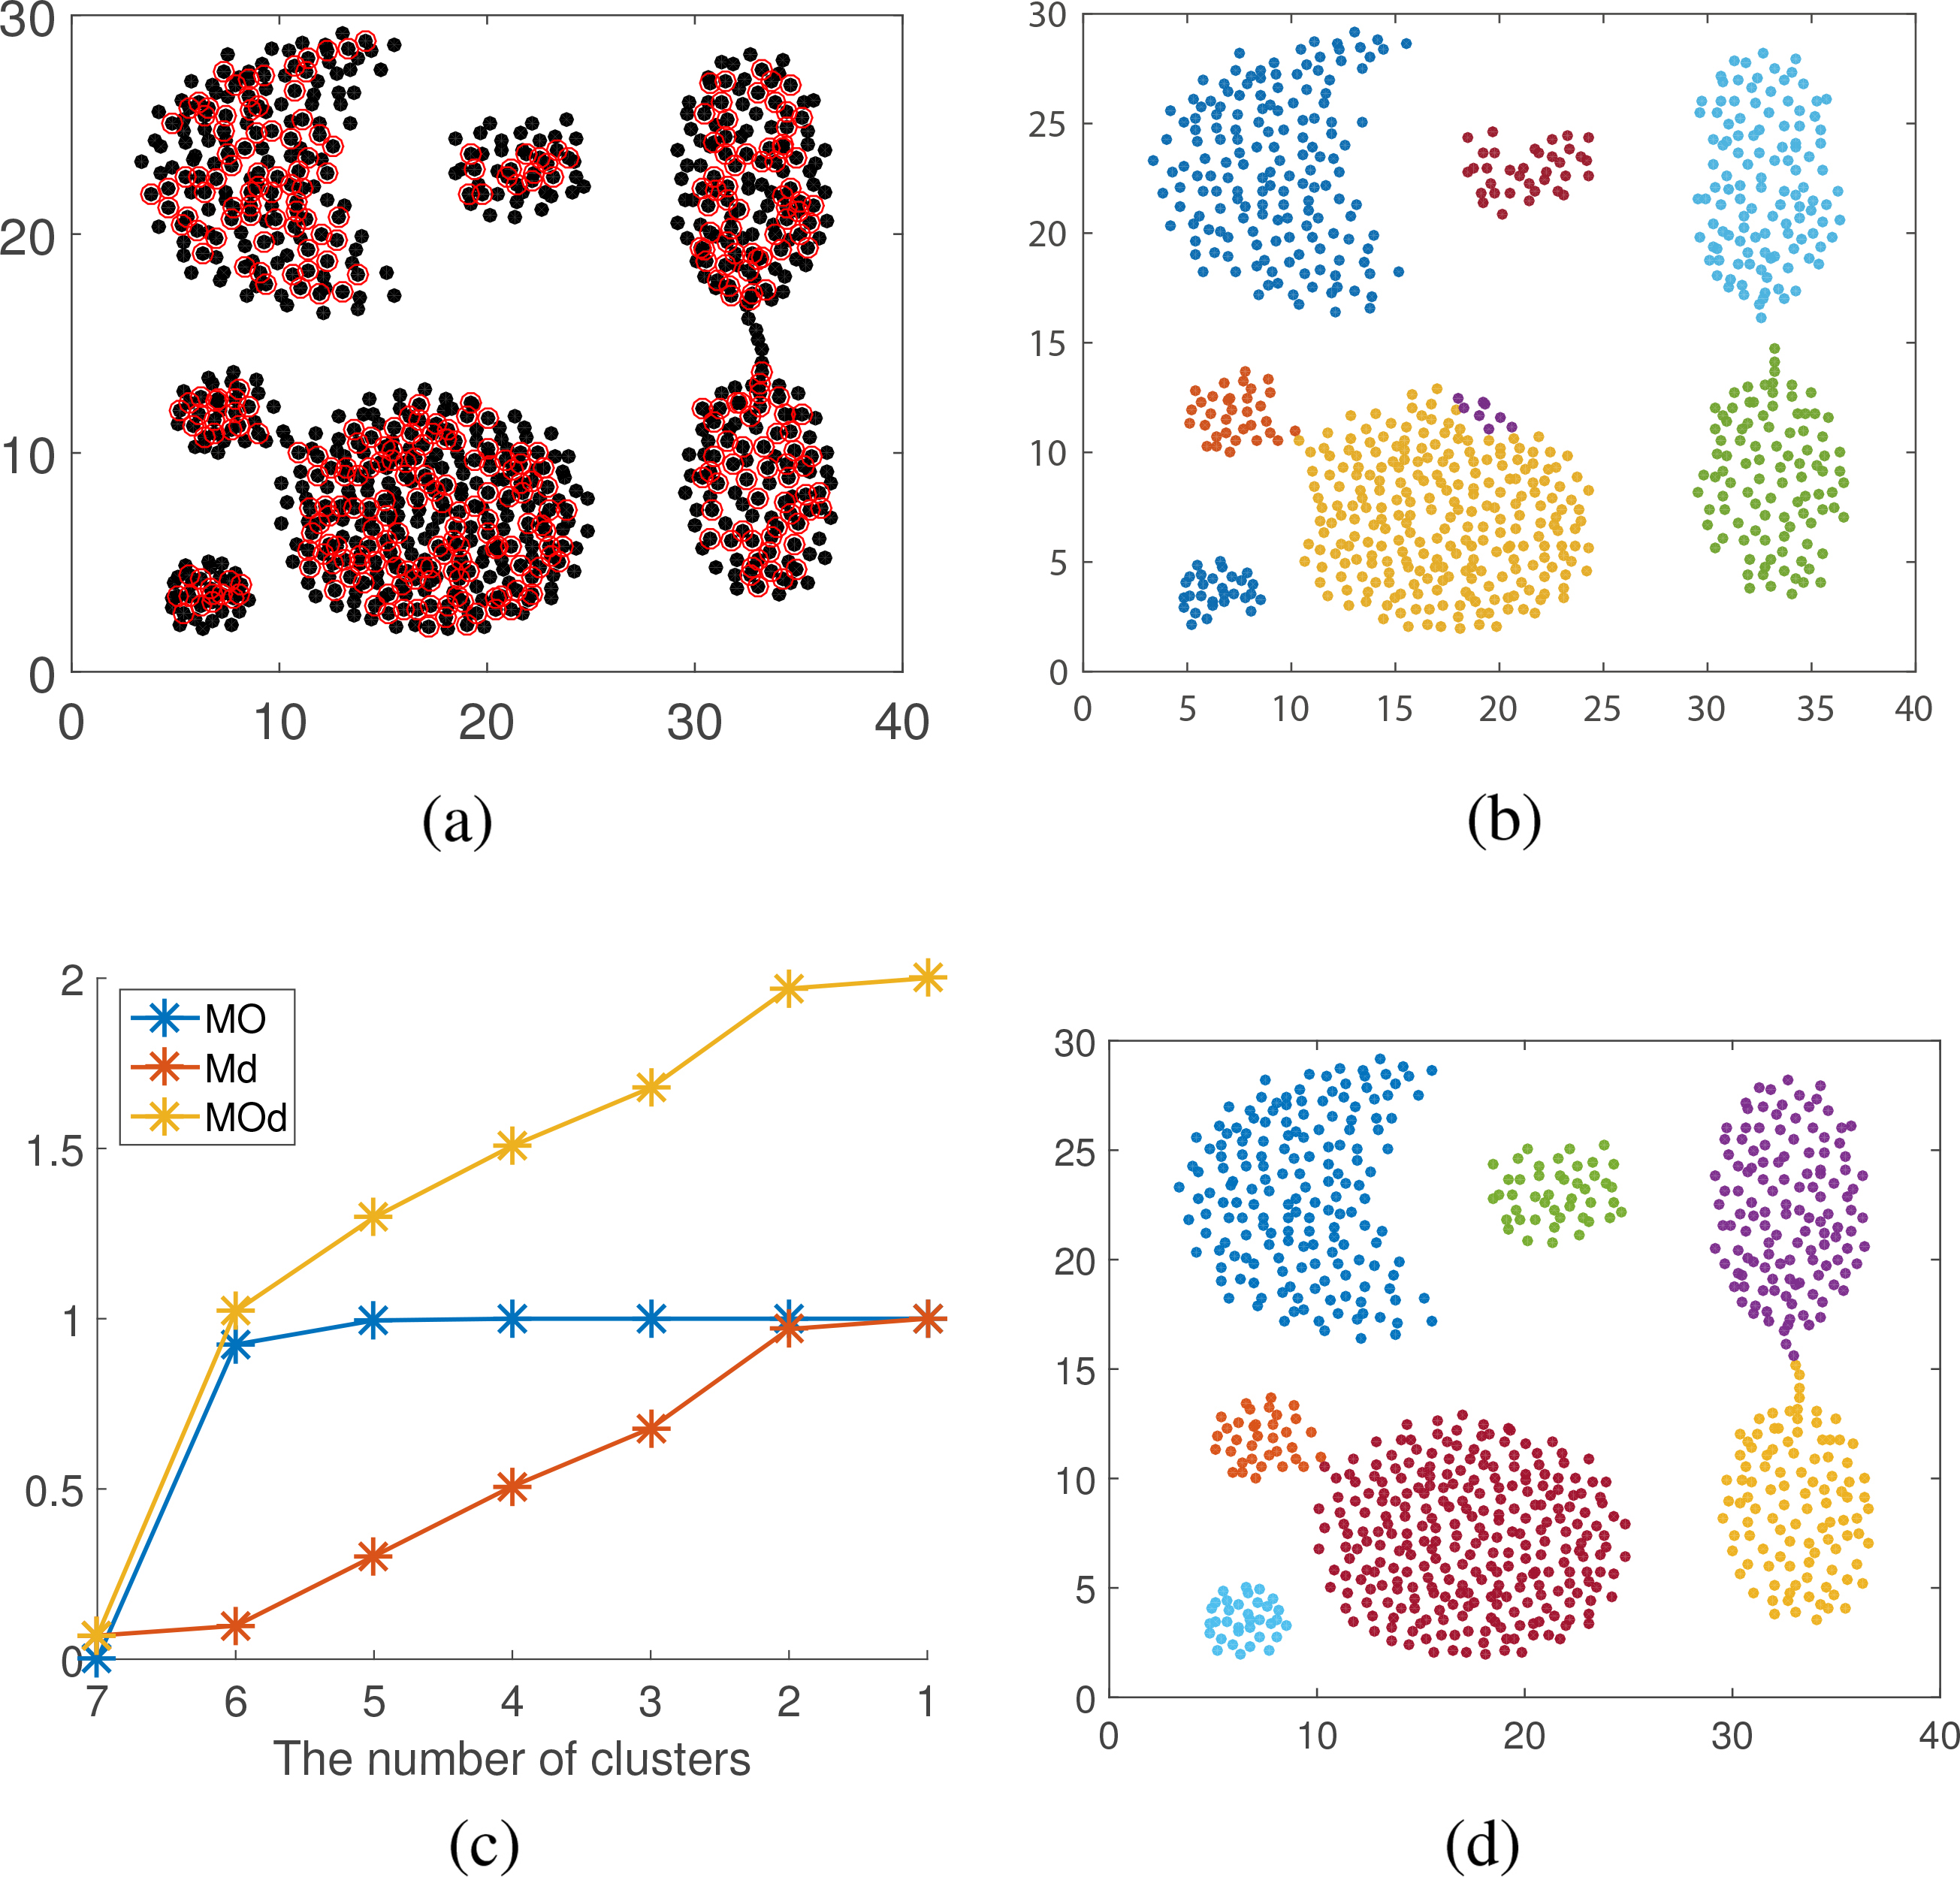
Data set circles. (a) center point determination. (b) sub-cluster obtaining. (c) number of cluster determination. (d) clustering result.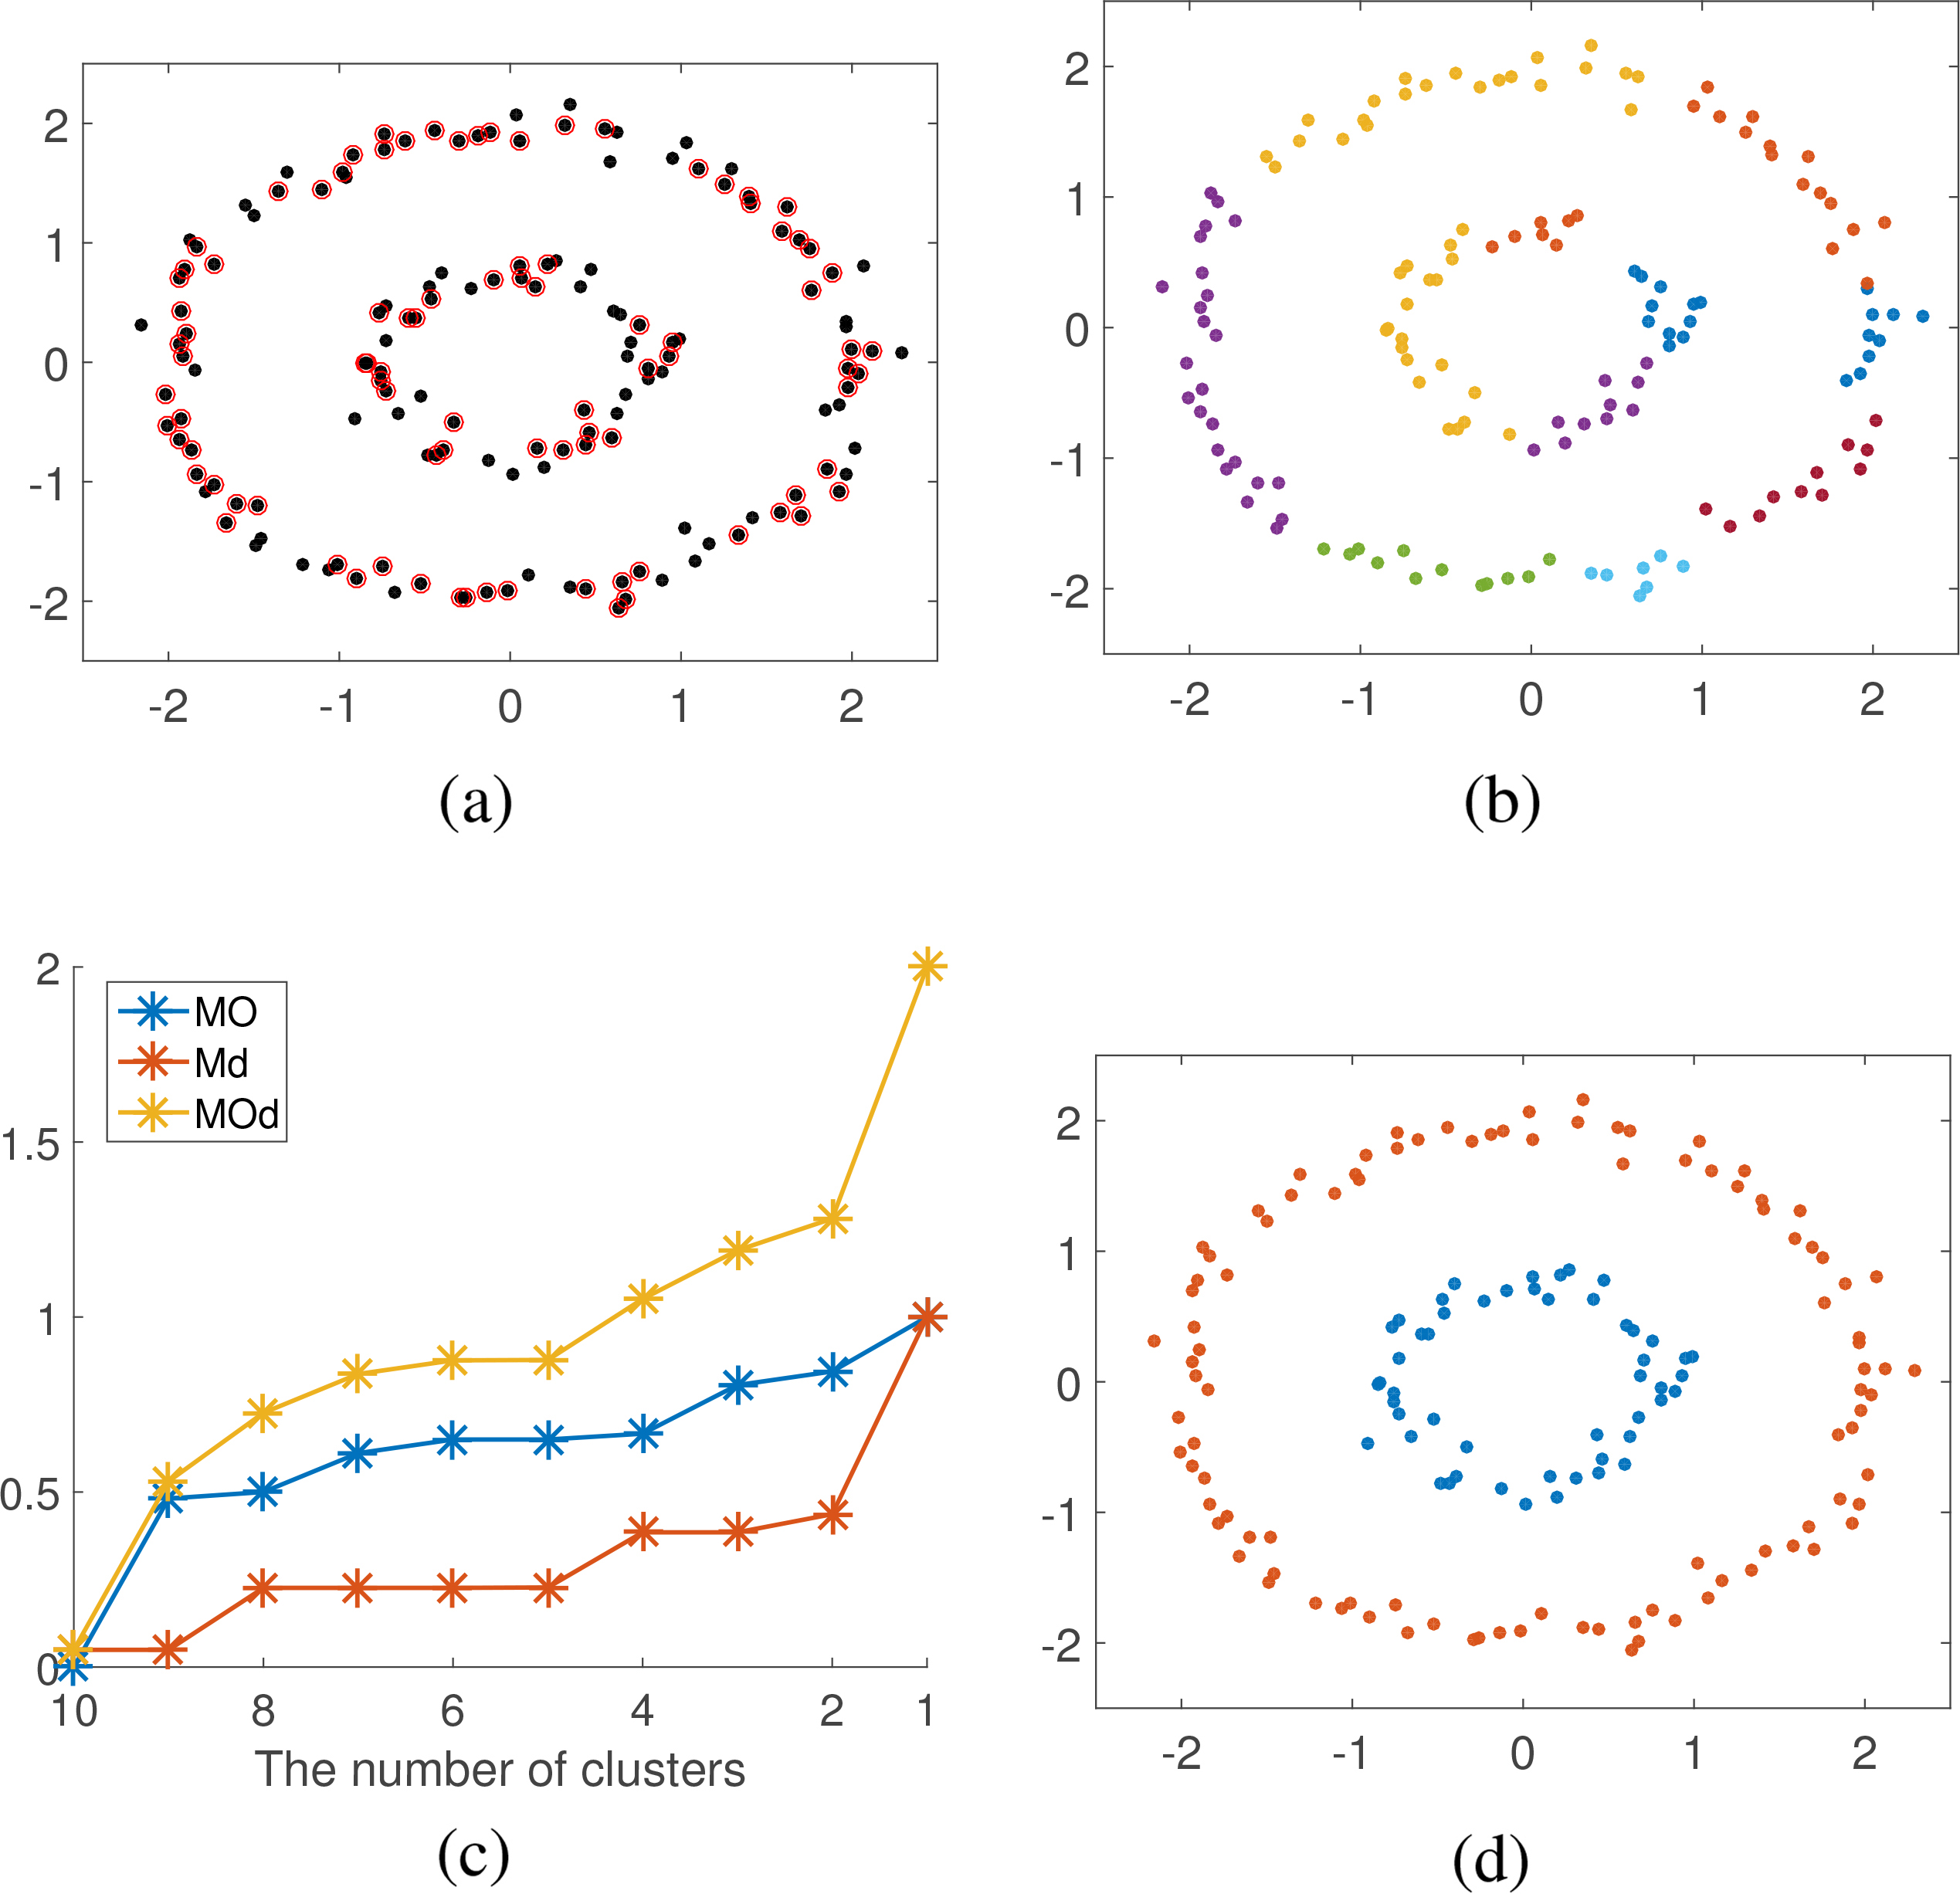
Data set Lithuanian. (a) center point determination. (b) sub-cluster obtaining. (c) number of cluster determination. (d) clustering result.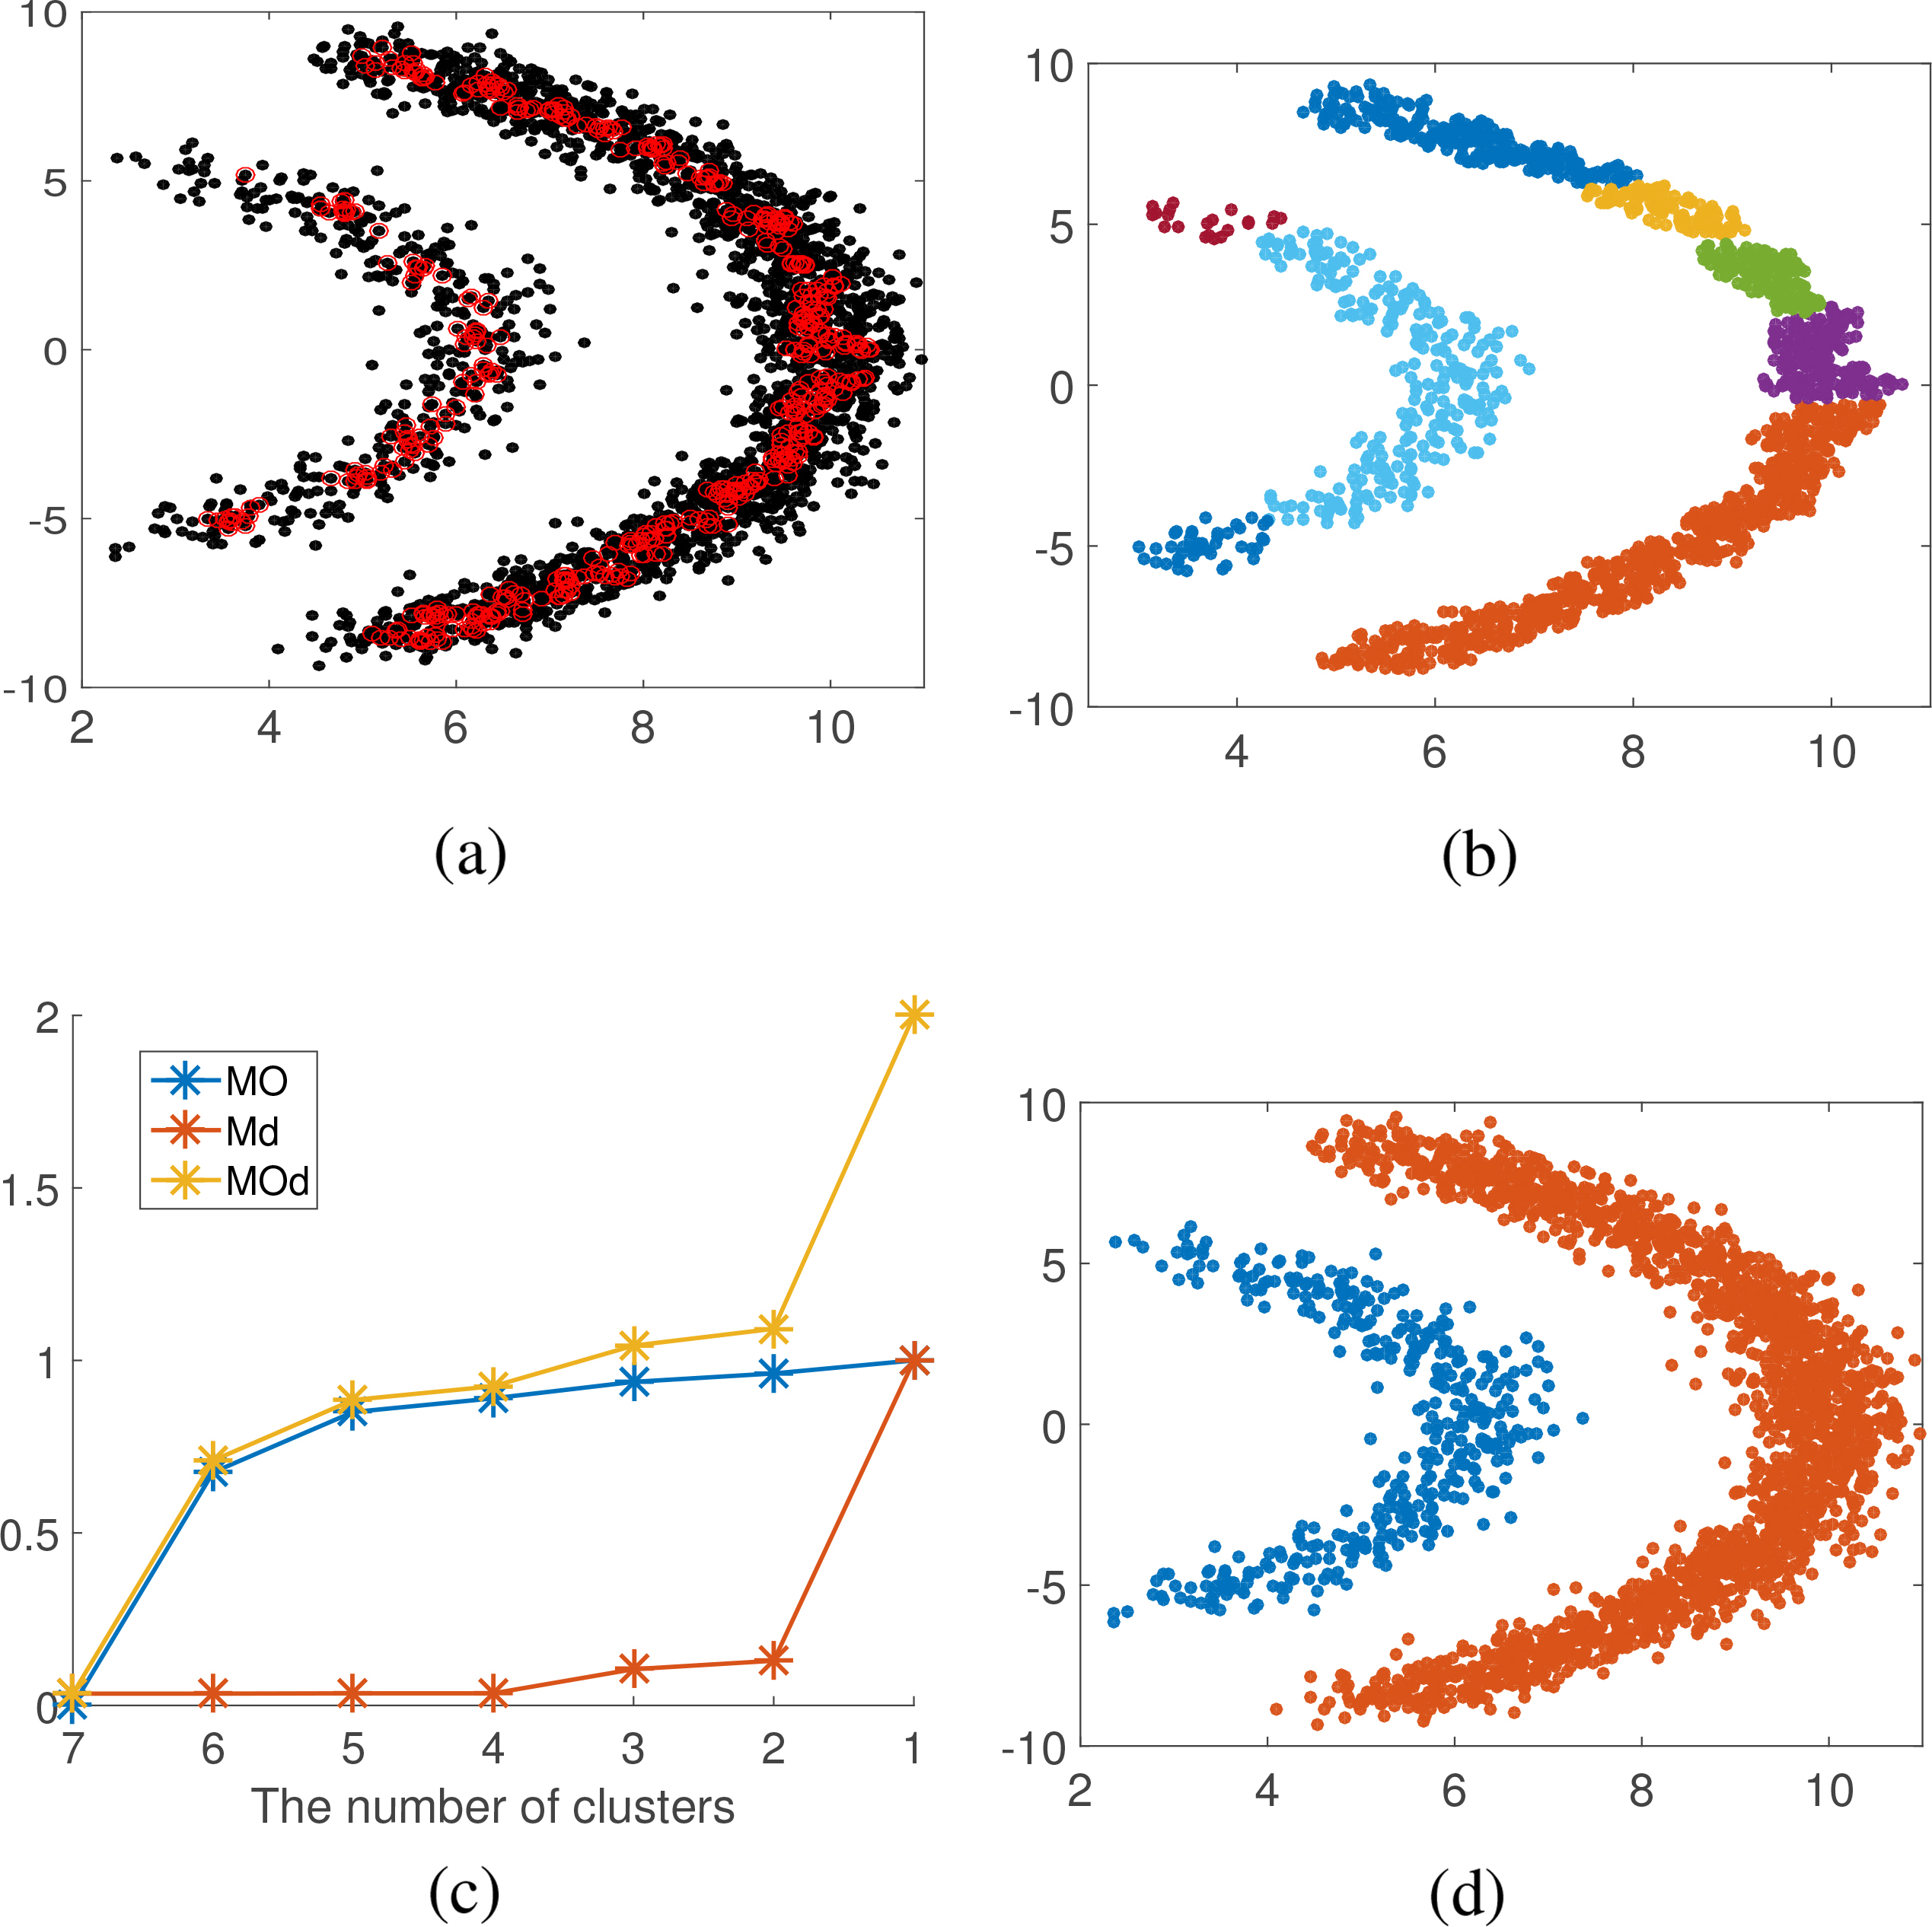
Clustering information of synthetic data sets
* Num is the number of sub-clusters.
Data set Gaussian. (a) center point determination. (b) sub-cluster obtaining. (c) number of cluster determination. (d) clustering result.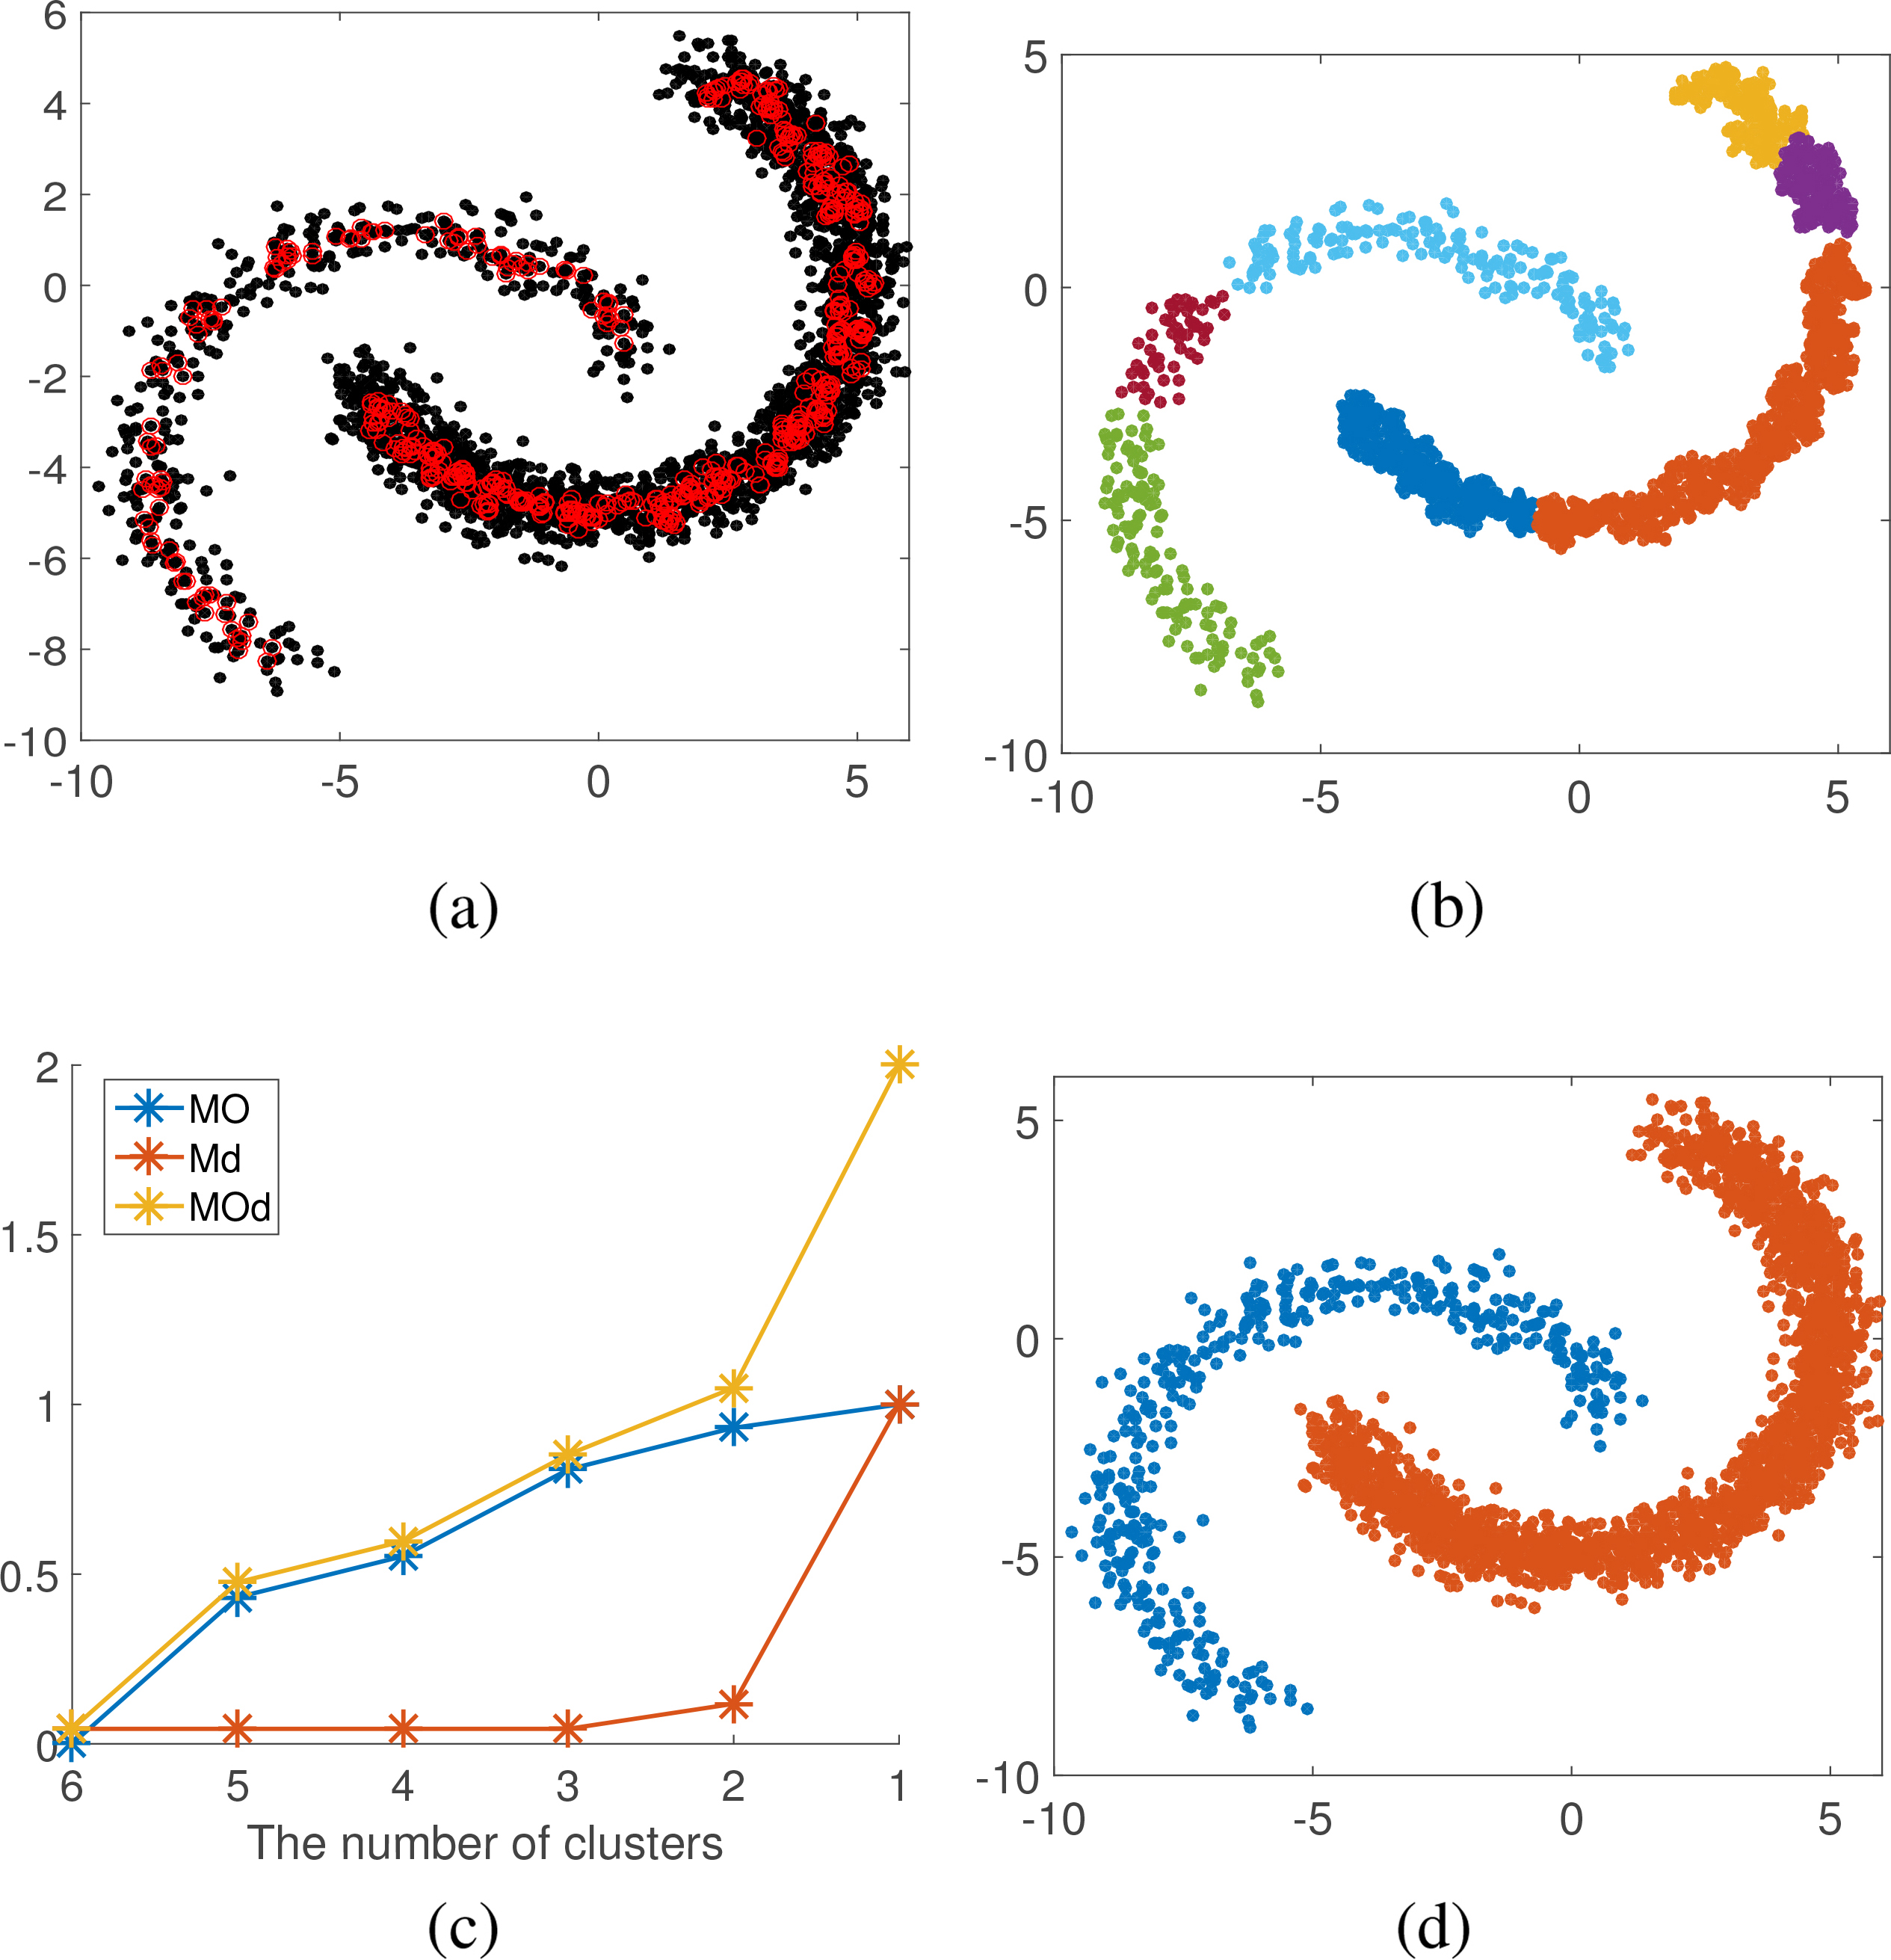
Figures 8–13a show center points in red circles of 6 synthetic data sets. We can seen that center points found are the representative data points of the main parts of data sets. The obtained sub-clusters are shown in Figs 8–13b (noise points are excluded). Figures 8–13c are line charts for final clusters number determination, where blue lines represent the degree of difficulty of merging in overlapping degree, the red lines represent the degree of difficulty of merging in distance, and the yellow lines represent degree of difficulty of merging. When the number of sub-clusters changes from
In the experiments, we compare the proposed algorithm MC-MNN with five related algorithms: McDPC [37], SMCL [34], Fuzzy-CFSFDP [36], DPA- DN [54], SNNDPC [55]. We use six performance metrics to test the performances of six algorithms: accuracy (ACC), normalized mutual information (NMI), recall (RE), the number of determined clusters (Clusters), the number of parameter and sensitivity of parameters (Parameters), and time cost. The comparison results of 6 synthetic data sets are shown in Table 4. The comparison results of 9 real data sets are shown in Table 5. The best values for six algorithms for each performance metric are shown in bold, and the second best values are underlined. For performance metric Parameters, Nonsen means insensitive to parameters, and None means no parameters.
Algorithm McDPC needs to specify the values of four parameters,
Results of the synthetic data sets
Results of the synthetic data sets
*The best values are in bold and the second best values are underlined.
Firstly, the performances of six algorithms are compared on six synthetic data sets. It can be found from Table 4 that MC-MNN achieved the best results on the 4 performance indicators, ACC, RE, NMI, and Clusters for the 5 synthetic data sets Gaussian, Ids2, Circles, Lithuanian and Banana. For data set Aggregation, our algorithm MC-MNN has obtained the correct cluster number, and the second best results on ACC, RE and NMI (0.9962, 0.9973, 0.9883). This result is still very competitive. Moreover, MC-MNN does not need to set any parameters. For McDPC, it is more sensitive to its four parameters. McDPC obtained relatively good clustering results on data sets Gaussian, Aggregation and Ids2, and poor clustering results on data sets Circles, Lithuanian and Banana. SMCL obtained the best clustering results on data sets Circle and Lithuanian, and relatively good clustering results on the other four synthetic data sets. It is not very sensitive to parameters and is a very competitive clustering algorithm. Fuzzy-CFSFDP is also insensitive to its parameter
Results of the real data sets
*The best values are in bold and the second best values are underlined.
Run-time (in second) of MC-MNN and compared algorithms
Clustering results of MC-MNN algorithm on Olivetti faces data set.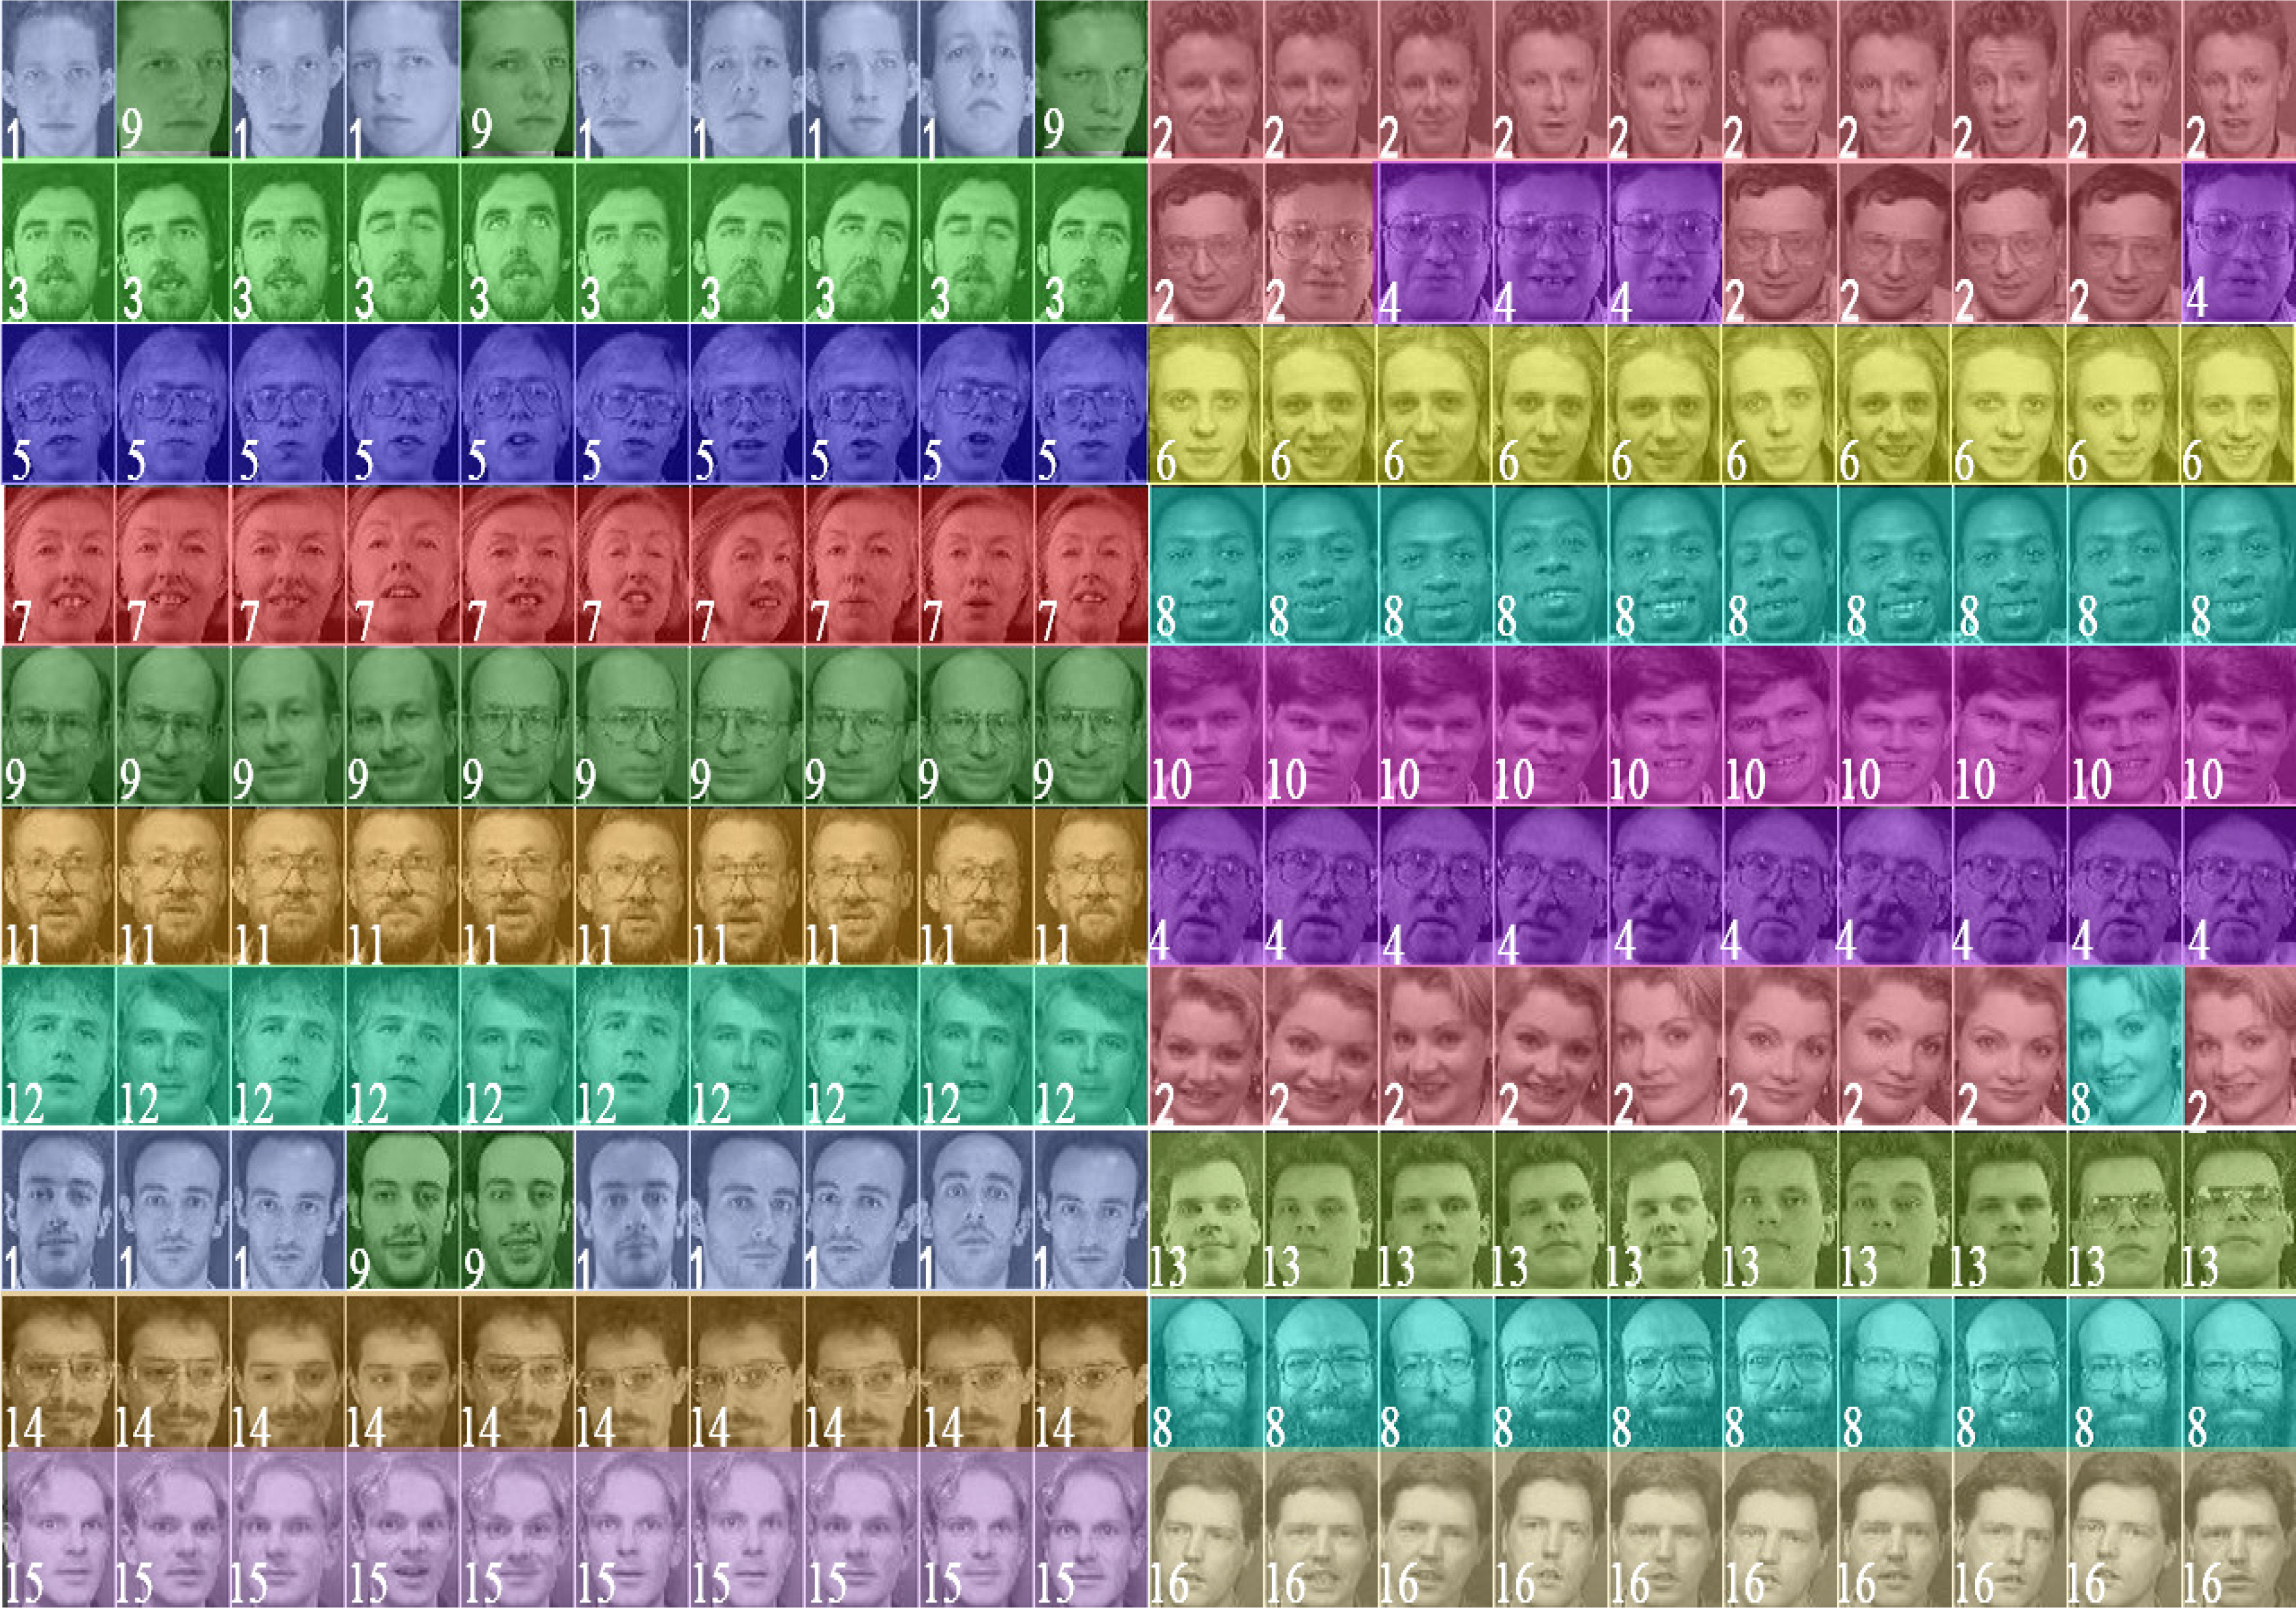
Secondly, for the nine real data sets, these data sets are totally analyzed according to 45 performance indicator values (each with 5 indicator values). MC-MNN algorithm achieved 27 best performance indicator values (briefly best values) and 10 second-best performance indicator values (briefly second best values). McDPC algorithm achieved 10 best values and 3 second best values. SMCL algorithm achieved 8 best values and 15 second best values. SNNDPC algorithm achieved 5 best values and 12 second best values. DPADN algorithm achieved 5 best values and 12 second best values. Fuzzy-CFSFDP algorithm achieved 3 best values and 20 second best values. In addition, for imbalanced data sets such as Car and Pageblock, the algorithms SMCL and Fuzzy-CFSFDP cluster the data points into one cluster, so they have achieved better results on the ACC index (ACC refers to the proportion of correctly clustered data points to the total data points). Compared with ACC, the RE index can better evaluate the clustering effect of data sets with large differences in cluster size (RE refers to the ratio of the number of correctly clustered data points in each cluster to the total number of data points in each cluster). In all real data sets, our algorithm MC-MNN always obtains the best or second best value on RE index. In summary, MC-MNN also has good performance on real data sets.
In order to further verify the image processing ability of the algorithm, the first two hundred photos of the Olivetti faces data set [53] were selected. The size of the photos is 64*64. Each person has ten photos of different angles and expressions. There are 20 people. Firstly, principal component analysis was performed on the data set, and the features with cumulative contribution rate greater than 85% were selected for clustering. The clustering results of the same cluster are represented by the same color. In order to more clearly express the cluster to which the photo belongs, the cluster number to which the photo belongs is marked with white Arabic numerals in the lower left part of the image. The clustering results are shown in Fig. 14.
As can be seen from the Fig. 14, the algorithm MC-MNN aggregates 200 photos into sixteen clusters. Among them, the clustering results of eleven clusters (3, 5, 6, 7, 10, 11, 12, 13, 14, 15, and 16) are completely correct. The first cluster contains 7 photos of the first person and 8 photos of the 15th person. The second cluster contains all photos of the 2nd person, 6 photos of the 4th person, and 9 photos of the 14th person. The fourth cluster contains 4 photos of the 4th person and all photos of the 12th person. The eighth cluster contains all the photos of the 8th person, one photo of the 14th person and all the photos of the 18th person. The ninth cluster contains all the photos of the 9th person, 2 photos of the 15th person and 3 photos of the first person.
From the Table 5, it can be found that MC-MNN has achieved the best clustering results in the performance indicators ACC, RE, and NMI, and the Fuzzy-CFSFDP algorithm has obtained the second best clustering results in these indicators. In terms of the number of obtained clusters, McDPC algorithm obtain the best result. Overall, MC-MNN algorithm has the best clustering effect on Olivetti faces data set compared with five related algorithms.
Algorithms MC-MNN, McDPC, Fuzzy-CFSFDP and DPADN have the same order of magnitude time cost on 15 data sets. and the time cost by algorithm SNNDPC is an order of magnitude higher than that of algorithms MC-MNN, McDPC, Fuzzy-CFSFDP and DPADN. This is because the algorithm SNNDPC requires manual judgment to select the center points, which takes more time. The time cost of algorithm SMCL is the highest among all algorithms, This is because many iterations are needed by algorithm SMCL in many situations. The time cost of six algorithms on 15 data sets are shown in Table 6.
Conclusion
In this study, we proposed a multi-center clustering algorithm based on mutual nearest neighbors called MC-MNN, which uses multiple centers to represent a cluster and aims to effectively cluster arbitrarily distributed data. In MC-MNN, first, we design a center points discovery algorithm based on mutual nearest neighbors, which can adaptively find center points without any parameters. Because the center points are found according to their mutual nearest neighbors, which is independent of the distance and density between data points, the algorithm is suitable for data sets with different density distribution. Then, a sub-clusters construction algorithm is designed based on the connection of the center points. The algorithm using the connection of multiple center points to construct sub-clusters is effective for clustering non-convex data sets. Finally, we measure the difficulty of merging sub-clusters according to the degree of overlapping and distance between sub-clusters, and design a cluster number determination algorithm that can effectively determine the final number of clusters and obtain the clustering results. Compared with the existing algorithms, we can make the following conclusions: the MC-MNN algorithm has four advantages: 1) It can obtain center points by using the mutual nearest neighbors automatically; 2) It runs without any parameters; 3) It can automatically obtain the number of clusters; 4) It can be effectively applied to the arbitrarily distributed data.
Footnotes
Acknowledgments
This article is supported by NSFC (61872281) and NKR&DPC (2017YFC1703506).