
Abstract
It is been 46 years since the first computer chess world championship was held in Stockholm in 1974, and there have now been 24 more with over 700 games played. This paper investigates a number of questions that a curious soul might ask regarding the results of these games, especially how they ended. The data provided herein attempts to answer several related questions. In addition, it presents data showing how ratings of the top engines have increased over the years.
This paper has four sections with each of the first three considering data gathered from the games of the 25 world championships. Tables 1 and 2 present data related to how the games ended. Table 3 shows how the length of games between the top engines has increased while the total material on the board at the end of these long game seems to show only a slight increase. The fourth section considers how the ratings of the top chess engines have increased over the years.
How top-half finishers did against each other (Table 1)
The first table examines how the top-half finishers did against each other in each of the 25 championships. The data only considers games played between engines that finished in the top half, as often, at least in the early years, many weak engines participated, and the games between them and the better engines obscure the already somewhat obscure observations! Column 2 shows how many engines participated and how many were considered top half finishers. If the number of engines happened to be odd, then the machine that finished in the middle of the pack was considered to have finished in the top half. This occurred three times, in 1974, 2011 and 2015. Column 3 show how many games between the top-half finishers were played, including playoff games that occurred in 1980, 1995–2003, and 2016–2018.
The fourth through the seventh columns present data on the results of games played between the top-half finishers. Column 4 gives the number of wins and draws they played. The fifth column gives the average length of the games that were won. The sixth column gives the average length of the games that were drawn. The seventh column gives the average value of the total White plus Black material on the board at the end of the games (Q=9, R=5, B=N=3, P=1). The rightmost column gives the time control rules used during the competition. Although Rybka was eventually disqualified from its first-place finishes in 2007–2010, its performance in these championships was left included in the data. As an example, the most recent year, 2019, saw six games played between the top-half finishers, with all but one game ending in a draw, where the one game that resulted in a win lasted 67 moves, and where the five that were drawn lasted an average of 53.2 moves. The total material on the board at the end of the six games averaged 13.0. For example, a typical final position might have seen each side with a rook on the board and White having two pawns and Black having only one.
The data show that the percent of games drawn is increasing. The games also seem to be getting longer as the years go by, and the material on the board at the end of the games seems to be increasing also. One might argue that as the engines get tougher and tougher the games would involve more and more moves; the data seems to support this. Over the years the time controls are requiring moves to be made at a faster and faster pace. In general, one might argue the faster moves are made, the fewer moves in the game. But while the time controls have speeded up, the increased speed of the processors more than offset this factor. The data doesn’t take into account the stubbornness of operators to resign on behalf of their entries, though this factor might not have changed over the years.
Data on the length of games played between the top-half engines
Data on the length of games played between the top-half engines
Table 2 examines the result of games each year when White was the stronger player (Columns 2–5) and when Black was the stronger player (Columns 6–9) and when either White or Black was the stronger player (Columns 10–13). Herein, the stronger player in each game is the one of the two who finished higher in the final standings of that championship.
For example, in 2009 of the 23 games in which the stronger player was White, it won 17, drew 6, and lost none. Of the 22 games in which the stronger player was Black, it won 16, drew 6, and similarly lost none. All together for 2009, of the total of 45 games, the stronger player won 33 games, drew 12, and didn’t lose a single game.
Thus in the 2009 championship, one might say there wasn’t the slightest upset in the tournament. In fact, over the 2009–2019 world championships, there were only seven games in which an engine that finished ahead of another engine lost a game to the later. This happened only three times when the stronger player was playing White (2011, 2017 and 2019) and four times when the stronger player was playing Black (2010 twice and 2013 twice).
The data is quite striking! Of the 360 games in which White was the stronger player, White won 263 games, drew 77 and lost a mere 20. Of the 348 games in which Black was the stronger player, Black won 240, drew 84 and lost 24. It shows that there was only a small advantage playing White, though clearly an advantage.
Data on games played between an engine who finished ahead of its opponent when playing White and Black
Data on games played between an engine who finished ahead of its opponent when playing White and Black
Forty-seven games have gone 100 moves or longer since the first championship. It occurred for the first time in 1992, 18 years after the first championship was held in 1974! The first game to go 100 moves (or longer) was between Zugwang and Cumulus at the 1992 WCCC. It lasted exactly 100 moves. One decade later in 2002 Shredder and Brutus set a new record with a game that lasted 131 moves. Later in the same championship the record was extended when Warp and Sjeng played a game that lasted 144 moves. Two years later Fritz and Deep Sjeng battled each other for a new record of 162 moves. Finally, in 2007, Shredder and Zappa established the current longest-game record of 164 moves.
Number of long games played
Number of long games played
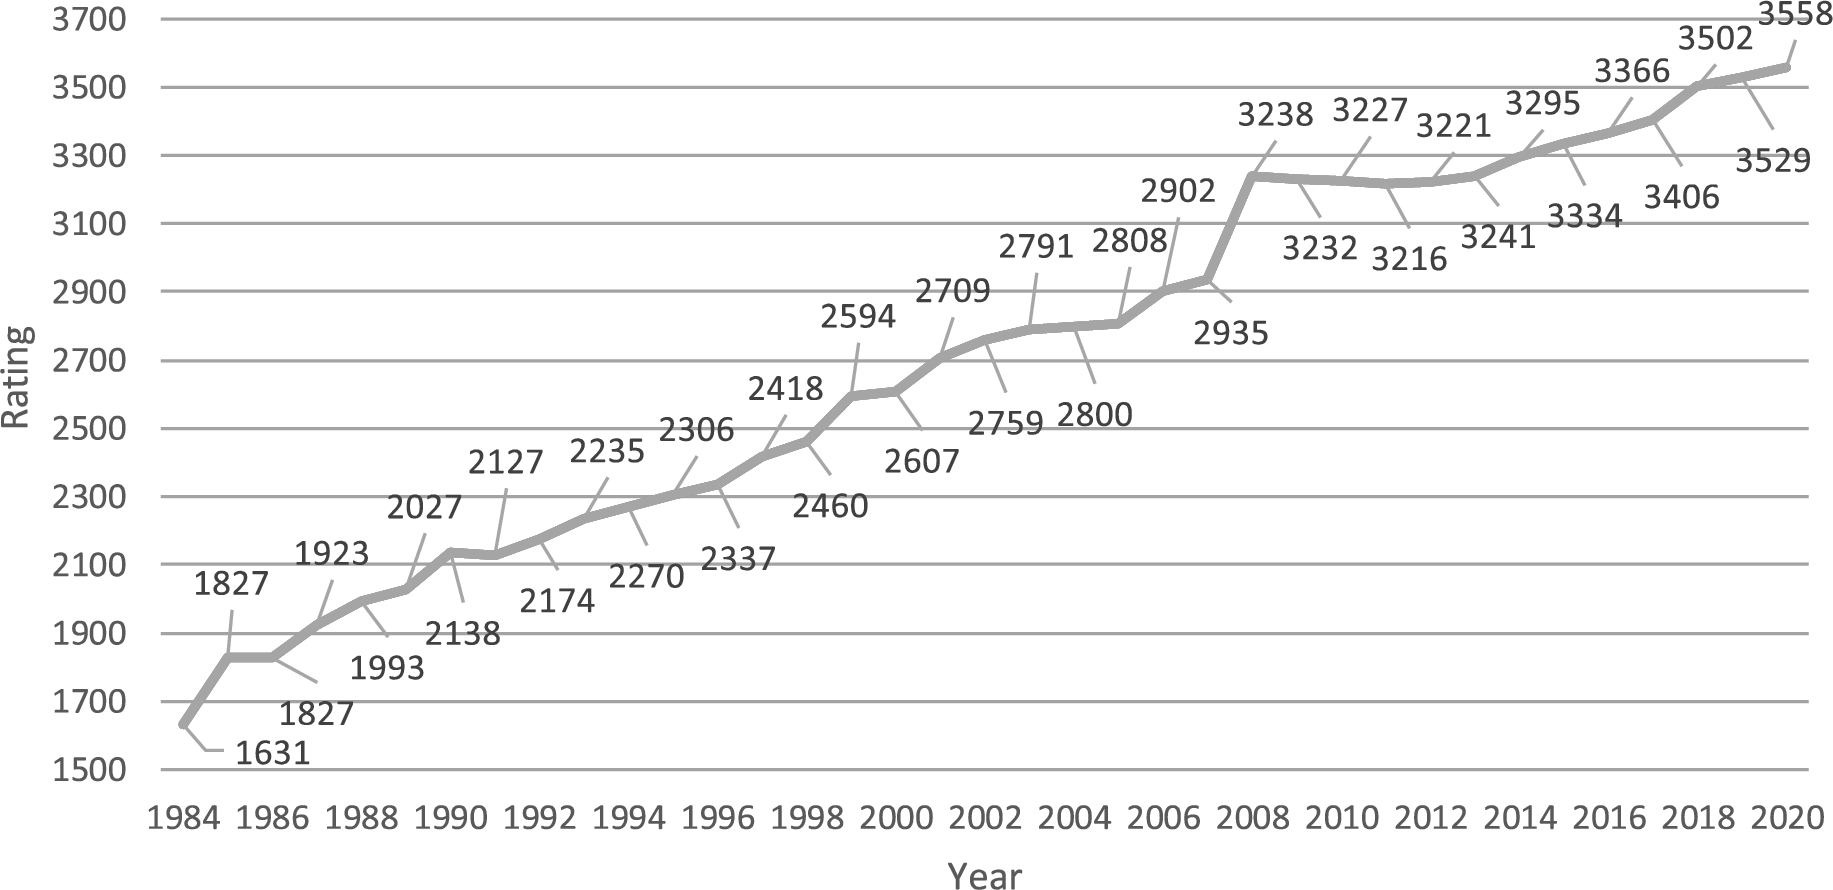
The Swedish Chess Rating List (SSDF), maintained by the Swedish Computer Chess Association, is the oldest continuous rating list for chess-playing computers. It began in 1984. Shown in Swedish Chess Computer Association and in Table 4 are the leaders of the list for each year beginning in 1984 and ending in 2019. The data for 2020 was provided to this author by Lars Sandin, Chairman of the Swedish Computer Chess Association just before the submission of this manuscript to the publishers. Based on Table 4, Fig. 1 graphs the almost continuous rise in ratings. The ratings are based on the results of testing versions of the leading engines on hardware generally far less powerful than the hardware used by the program authors.
The ratings are clearly low, beginning with the 1631 rating for 1984. Belle was awarded the rank of Master by the USCF one year earlier (Belle (chess machine)), but could only finish sixth in that year’s World Computer Chess Championship won by Cray Blitz (Hyatt et al., 1988), who also was playing at the Master level by that time, as were a number of other engines. But almost a decade earlier than this Chess 4.5 won the Class B section of the Paul Masson American Chess Championship in 1976 (Frey, 1977a; 1977b) with a performance rating of 1950, though clearly not playing Master-level chess when it lost a match to the British Master David Levy two years later (Levy, 1978).
Swedish Computer Chess Rating List leaders
Swedish Computer Chess Rating List leaders
With no data given, we assigned a rating halfway between 1993 and 1995.
SSDF Rating List leader by year.
Even when Deep Blue and Kasparov played their classic matches in 1996 and 1997, the top SSDF programs were rated several hundred points lower than the human world champion. Kasparov would have had little trouble defeating a 2400-rated player. Currently according to the most recent SSDF rating list the top chess engines are playing at a level of over 600 points above the leading human.
The figure show that there were two significant rating jumps: when going from 1984 to 1985 and when going from 2007 to 2008. One might assume that the jump going from 1984 to 1985 had to do with the hardware used for the testing. The big jump going from 2007 to 2008 might be credited to Deep Rybka. Deep Rybka was tested on a system twice as fast as the one Rybka was tested on the previous year. In fact, from 2008 through 2012 Deep Rybka led the rating list with essentially the same year-to-year rating while competitors were catching up.
Note that the current speed of the processors is almost 1000 times faster than when the list began in 1984 (going from 4 MHz to 3.6 GHz)! As a crude measure, each additional ply of search takes somewhere between approximately 4 to 6 times as long, suggesting that the current engines search 4 to 5 more plies than they did in the early 1980s. Memory sizes have also gone up by a factor of around 1000, resulting in proportionally increasing hash table sizes. Ratings have gone up almost 2000 points (going from 1631 to 3529)!!
A number of papers over the years addressed the issue of the improvement in chess engine performance as technology advances (Gillogly, 1978; Thompson, 1982; Newborn, 1986; Hyatt and Newborn, 1997; Heinz, 1998, 2000; Newborn, 2003; Ferreira, 2013). Checkers has in fact been solved, while there remains the question of how long it will be before chess is solved (Schaeffer et al., 2007). Permit me venture a prediction: 20 years!
The computers are clearly getting stronger, drawn games are increasingly more common, games are getting longer, and the weaker engines are having a very difficult time in defeating the stronger ones. It’s left for the reader to draw any other conclusions!