
Abstract
A common task in data analysis is to find the appropriate data sample whose properties allow us to infer the parameters and behavior of the data population. In data mining this task makes sense since usually the population is significantly huge, and thus it is required (for practical reasons) to obtain a subset that preserves its properties. In this regard, statistics offers some sampling techniques usually based on asymptotic results from the Central Limit Theorem. The effectiveness of such ways is bounded by several considerations as the sampling strategy (simple with or without replacement, stratified, cluster-based, etc.), the size of the population and the dimensionality of the space of the data. Due to these considerations alternative proposals are necessary. We propose a method based on a measure of information in terms of Shannon’s Entropy. Our idea is to find the optimal sample whose information is as similar as possible to the information of the population, subject to several constraints. Finding such sample represents a hard optimization problem whose feasible space disallows the use of traditional optimization techniques. To solve it, we resort to a breed of Genetic Algorithm called Eclectic Genetic Algorithm. We test our method with synthetic datasets; the results show that our method is suitable. For completeness, we used several datasets from real problems; the results confirm the effectiveness of our proposal and allow us to visualize different applications. Finally, we establish a baseline based on selection instance methods as a point reference to measure the effectiveness of our method.
Introduction
A first approach to data reduction is the sampling. The goal of sampling is to choose a representative subset
From CLT, it is said that there is a relationship between the mean of
Likewise, it is said that there is a relationship between the deviation of
where
Standard error in function of the sample size.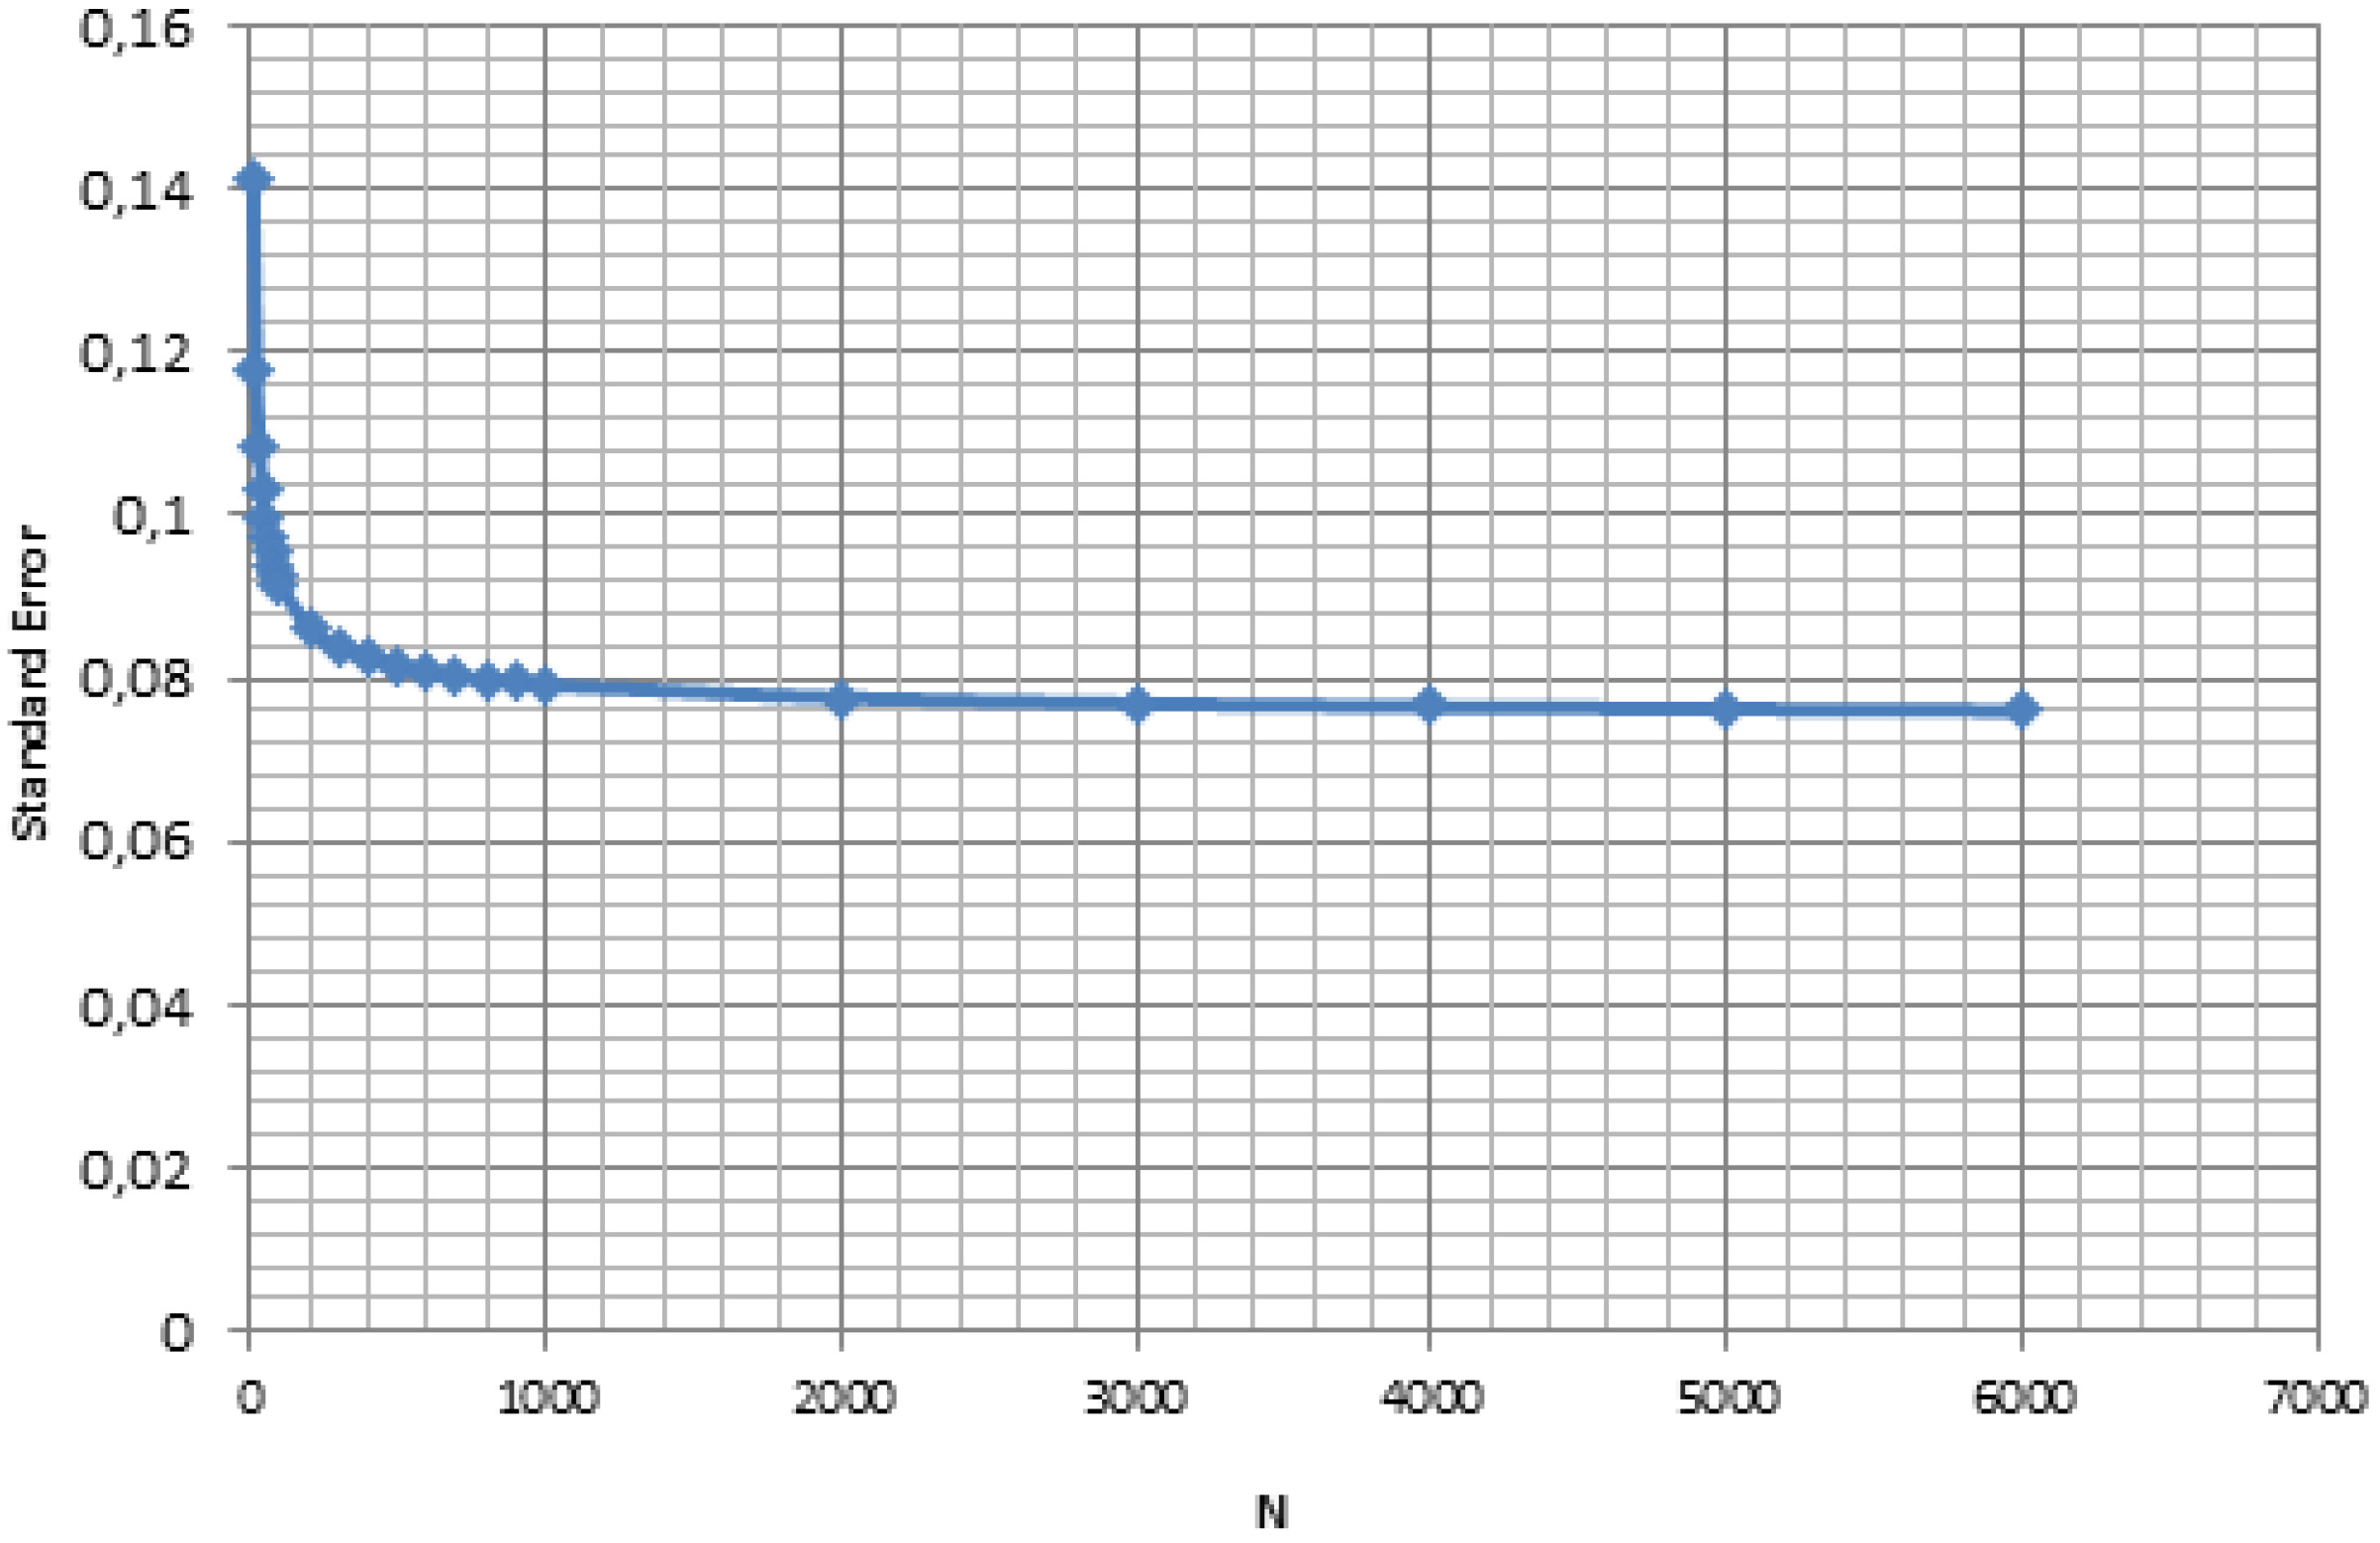
From Eq. (3) the size of a sample (with replacement) can be written as:
Typically the value of
Given the asymptotic nature of the Eqs (3) and (4), the value of The result in Eq. (3) depends on the assumption that the elements from A generalization of the above asymptotic relationships to data in a multidimensional space may be computationally complex and even unfeasible in some cases. In many approaches of Data Mining (DM) and Machine Learning (ML) the task of finding the optimal sample goes beyond suggesting an adequately value of
There are many ways of picking
Given that
This expression represents the number of samples, each of size
For obvious reasons, we want that the value of
Among the many methods that have arisen, we can mention tabu search [7], simulated annealing [8], ant colony optimization [9], particle swarm optimization [10] and evolutionary computation [11]. Furthermore, among the many variations of evolutionary computation, we find evolutionary strategies [12], evolutionary programming [13], genetic programming [14] and genetic algorithms (GAs) [15]. All of these methods are used to find approximate solutions for complex optimization problems. It was proven that an elitist GA always converges to the global optimum [16]. Such a convergence, however, is not bounded in time, and the selection of the GA variation with the best dynamic behavior is very convenient. In this regard, we rely on the conclusions of previous analyses, which showed that a breed of GA, called the Eclectic Genetic Algorithm (EGA), achieves the best relative performance [17, 18]. In Appendix A, the interested reader can find important details about EGA.
Having determined a measure of information as criterion to find the most representative sample
The problem of finding an appropriate sample, can have two possible scenarios:
One where the parameters and behavior of Another where there is a wide set of observations
The first scenario is common in those contexts in which the determination of the parameters of
The second scenario is when given a large set
Clearly our proposal deals with the second scenario. In this regard, typically the cited methods have focused on finding the set
To present our proposal, the rest of this work has been organized as follows: In Section 2 we show the background to guide the discussion about it. We show how to measure the information of the data based on Shannon’s Entropy and how to extend such measure to data in a multidimensional space. In Section 3, we show important details as the objective function and the encoding to solve it through EGA. In Section 4, we show the experimental methodology and its results. Finally, we present the conclusions and infer several applications.
In what follows, we provide the conceptual background which involves important details about how to measure the information of a dataset treated as a random variable. We introduce the entropy concept assuming an univariate random variable. Subsequently, we present a proposal to extend such concept to multivariate case.
Measuring the information of a dataset
The so-called entropy appeals to an evaluation of the information content of an univariate random variable
From information theory, the entropy of
Typically, the
We can see that the entropy implies to determine the probabilities
So far, we have assumed that
Considering
where
Since determining the probability
Given an univariate random variable
where
The subsequent quantiles can be defined as:
where
Space discretization for a univariate variable.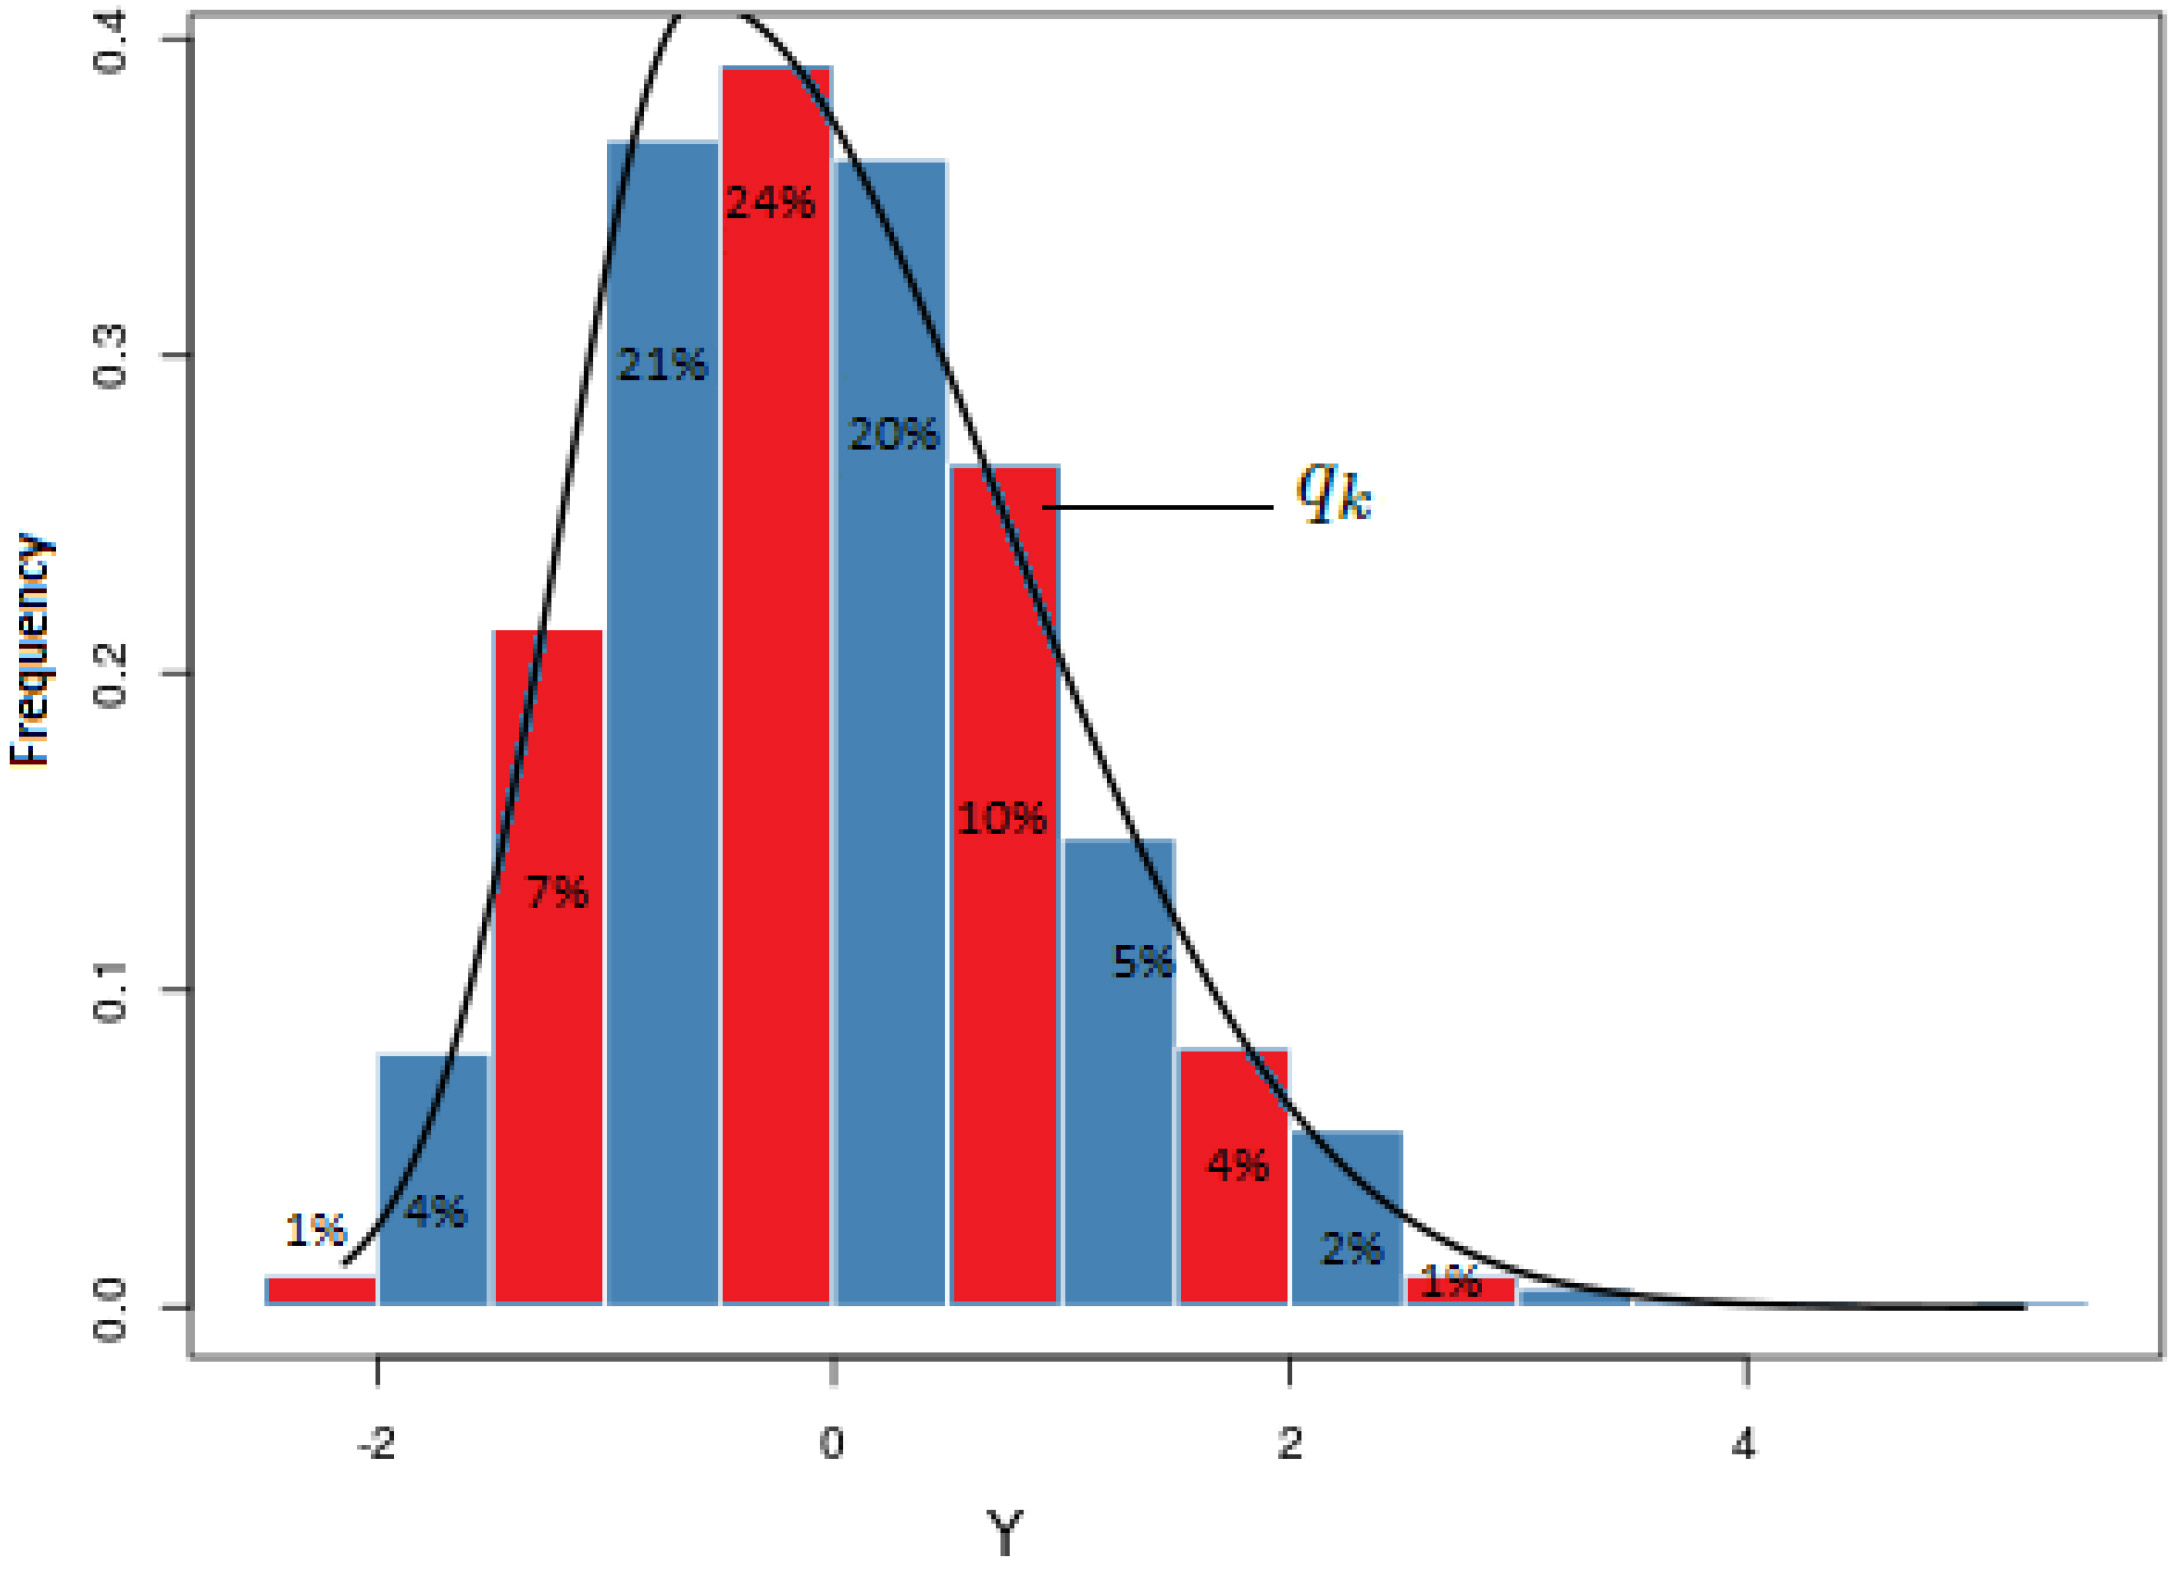
The above idea can be extended to higher dimensional data, in which case, a quantile will be a
Space discretization for a multivariate variable.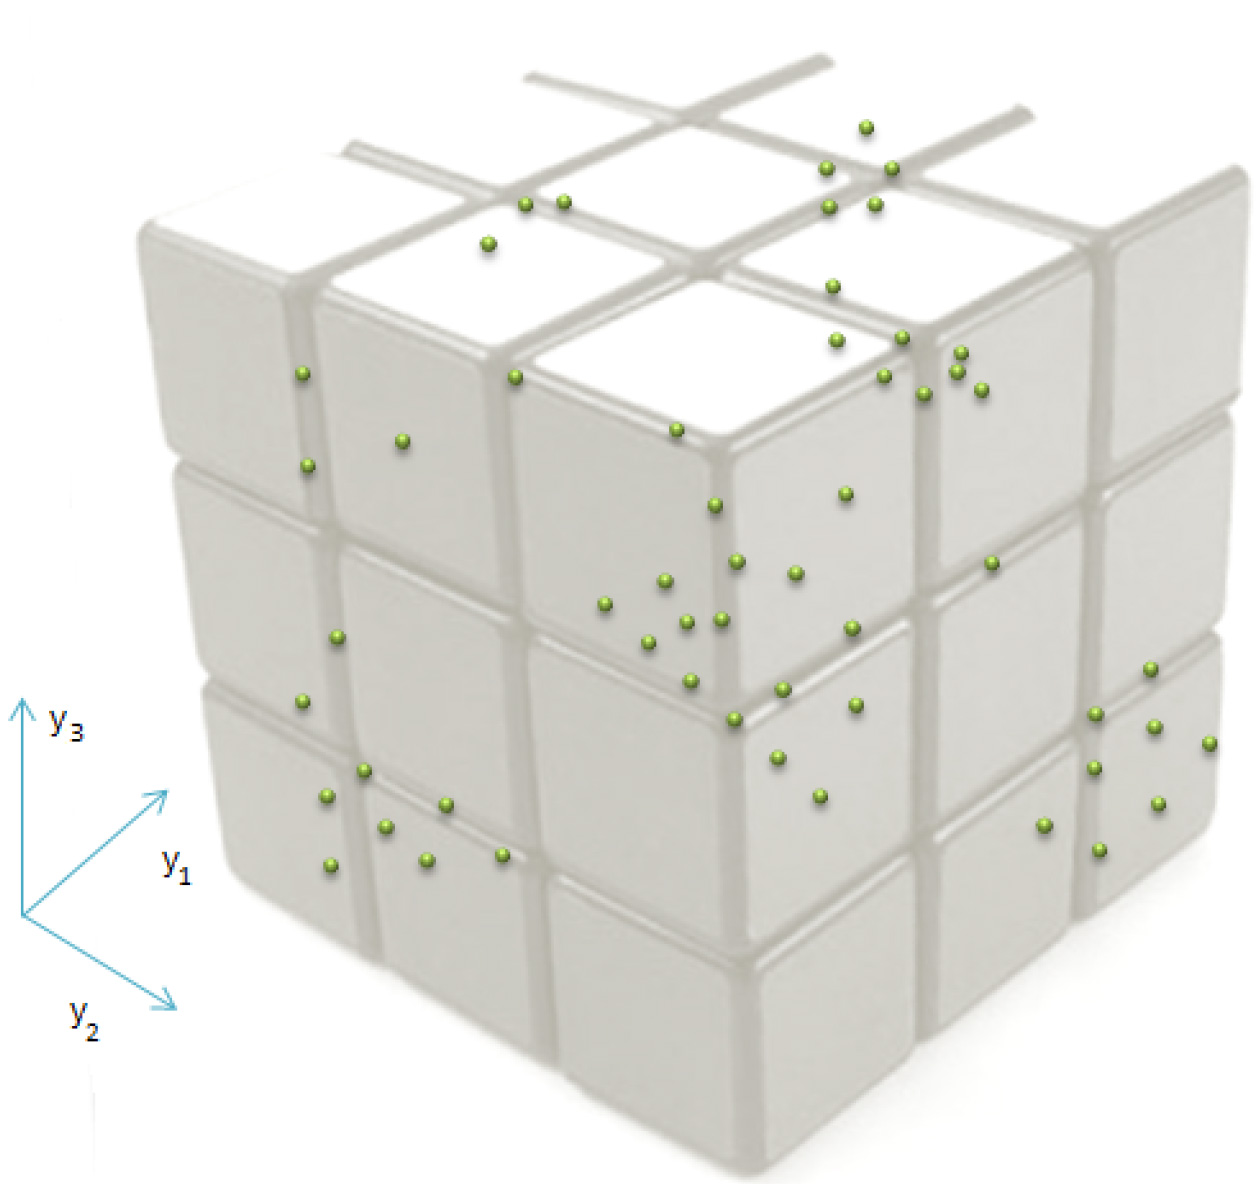
A
where
where
for the first quantile, and:
for subsequent quantiles, where
As univariate case, the PDF of
To determine the value of
Proposal
Having defined the way to measure the information conveyed by
Defining the objective function
We want to find the minimal value of
The value of the objective function tends to 1 when the value of
The error between the information of As mentioned, the quantiles are partitions of the space of a dataset. Since
Thus, the objective function is given by:
where
EGA proposes
Encoding of the problem.
For each candidate a fitness value is calculated based on the objective function (see Eq. (17)). The fitness of those candidates that do not satisfy the constraints is punished through a penalty function (see Subsection 3.3). Evolution takes place after the repeated application of genetic operators of EGA. When the maximum number of iterations is reached, we have
We are facing a constrained optimization problem, to solve it, the most common way is resorting to a penalty function [40]. In this approach, the objective function in Eq. (17) can be transformed as follows:
There are many variations of penalty functions. Based on the results of a comprehensive analysis reported in [41], we use the method that exhibited the best performance, where the objective function
where
When the evolutionary process of EGA is finished, the set of candidate solutions contains the fittest candidate whose genome encodes the optimal size and a random seed denoted as
EGA starts with a random set
The evolutionary process of EGA is based on the premise of elitism. It means that the best candidate solutions of every iteration must be preserved. Based on the above, in each iteration, EGA duplicates the set
As result of the above process, the top 1 candidate is selected from
Searching the Optimal Sample
Searching the Optimal Sample
Generate a random set
duplicate(
Generate a random number
crossover(
Mutate the population in
As mentioned
The parameters associated to EGA are shown in Table 1. The value of them was determined experimentally in a previous study (see [17]). This study showed that from statistical view point, EGA converges to optimal solution around such values when the problems are demanding (those with non-convex and multi-modal functions). Since the problem to be solved by EGA in this work lies in this category, we consider such values appropriate. We found that they allow us to obtain good results regardless of the dataset from which we want to obtain the optimal sample.
Parameters of evolutionary process
Parameters of evolutionary process
We wanted to show some preliminary results as a first approach to the effectiveness of our method (see Subsection 4.1). Subsequently, we statistically evaluated such effectiveness in two ways: a) the ratio of data reduction (size reduction percentage of
Often the datasets have hidden information which are not possible to be characterized through statistical measures. We also wanted to guarantee that the subset
As mentioned in Subsection 1.2, recently have arisen approaches based on the rough sets theory as fuzzy-rough prototype selection method (FRPS) and fuzzy-rough instance selection (FRIS) which reduce the number of instances or elements that must be selected from a dataset. For completeness, we use these methods to establish a benchmark baseline in order to compare the effectiveness of our proposal. The experimental process and results are described in Subsection 4.4.
Preliminary results
We executed preliminary experiments whose results allowed us to show that our method is promissory. The datasets in such experiments are described as follows:
Dataset Dataset Dataset Dataset Dataset
Our hypothesis is that our method will find the optimal sample
Distribution of the dataset 
Distribution of the dataset 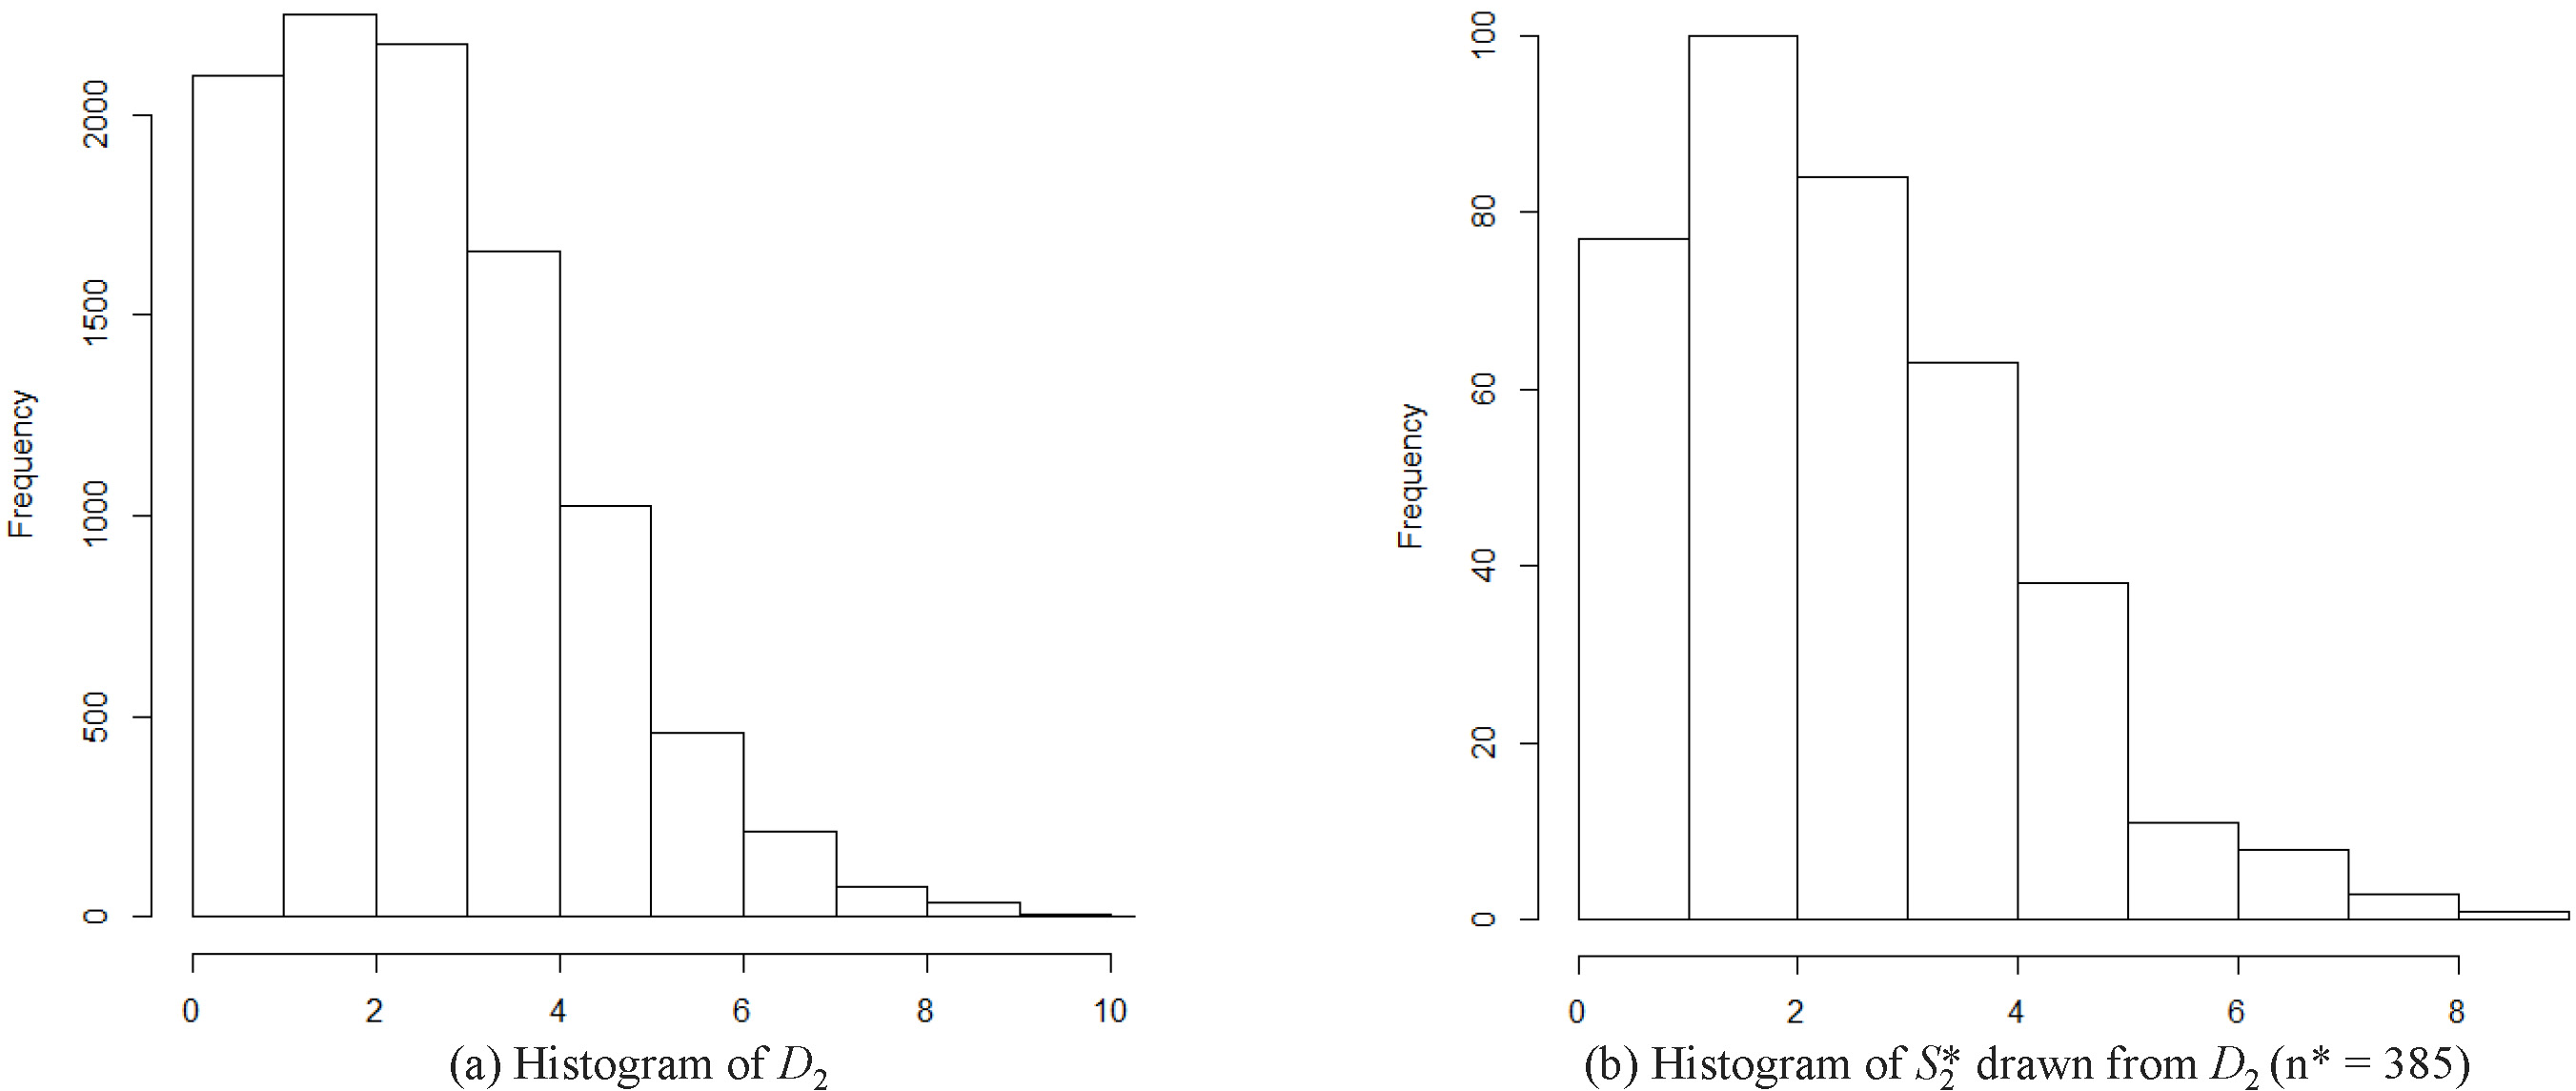
Distribution of the dataset 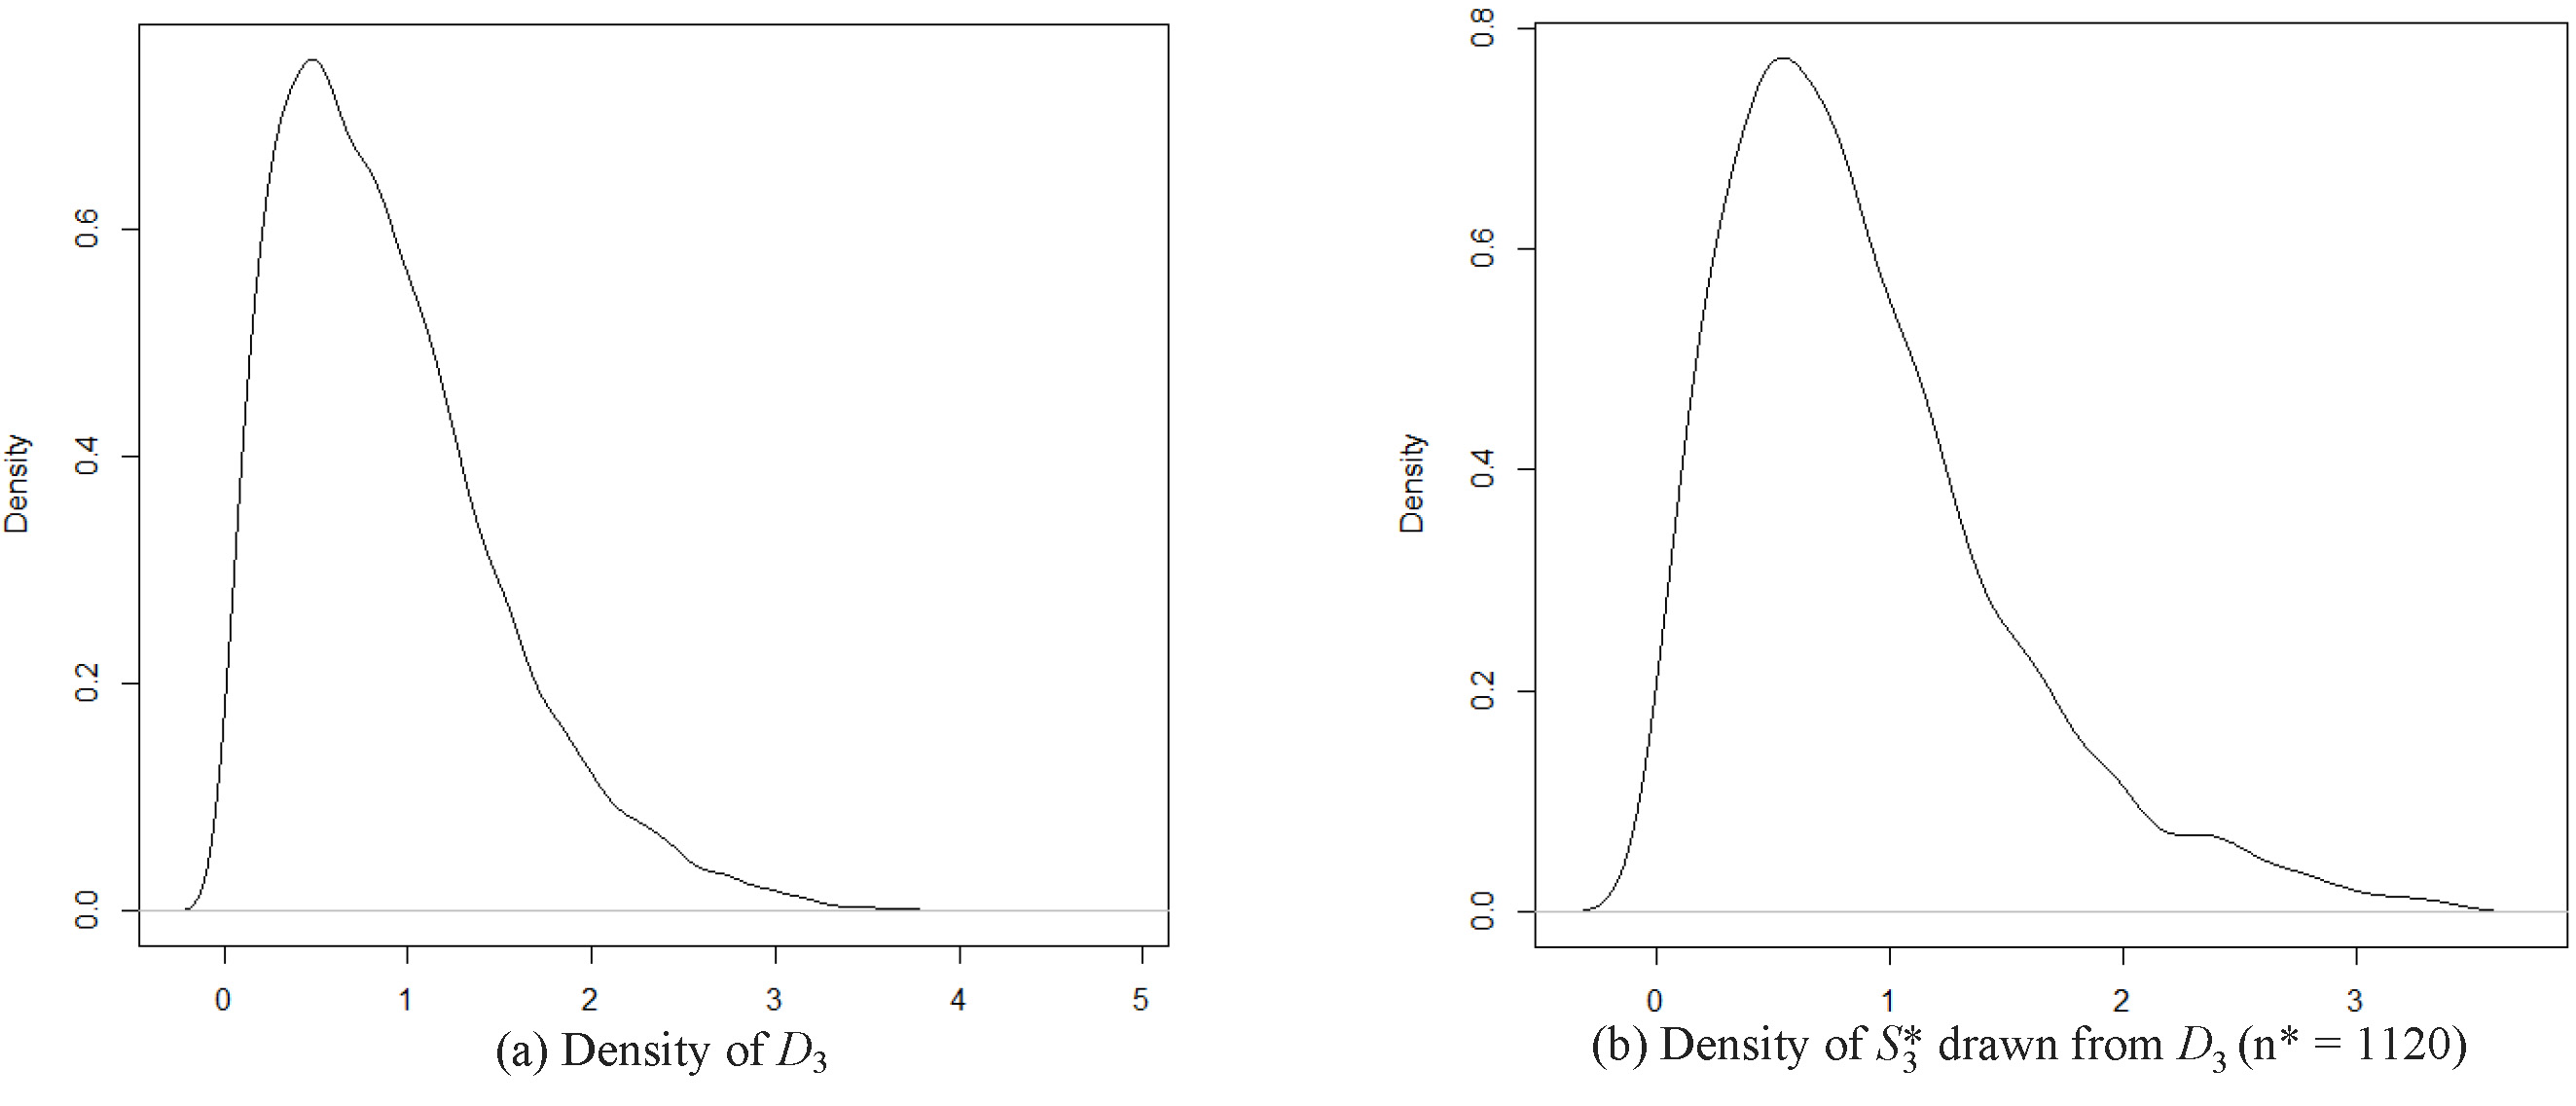
Distribution of the dataset 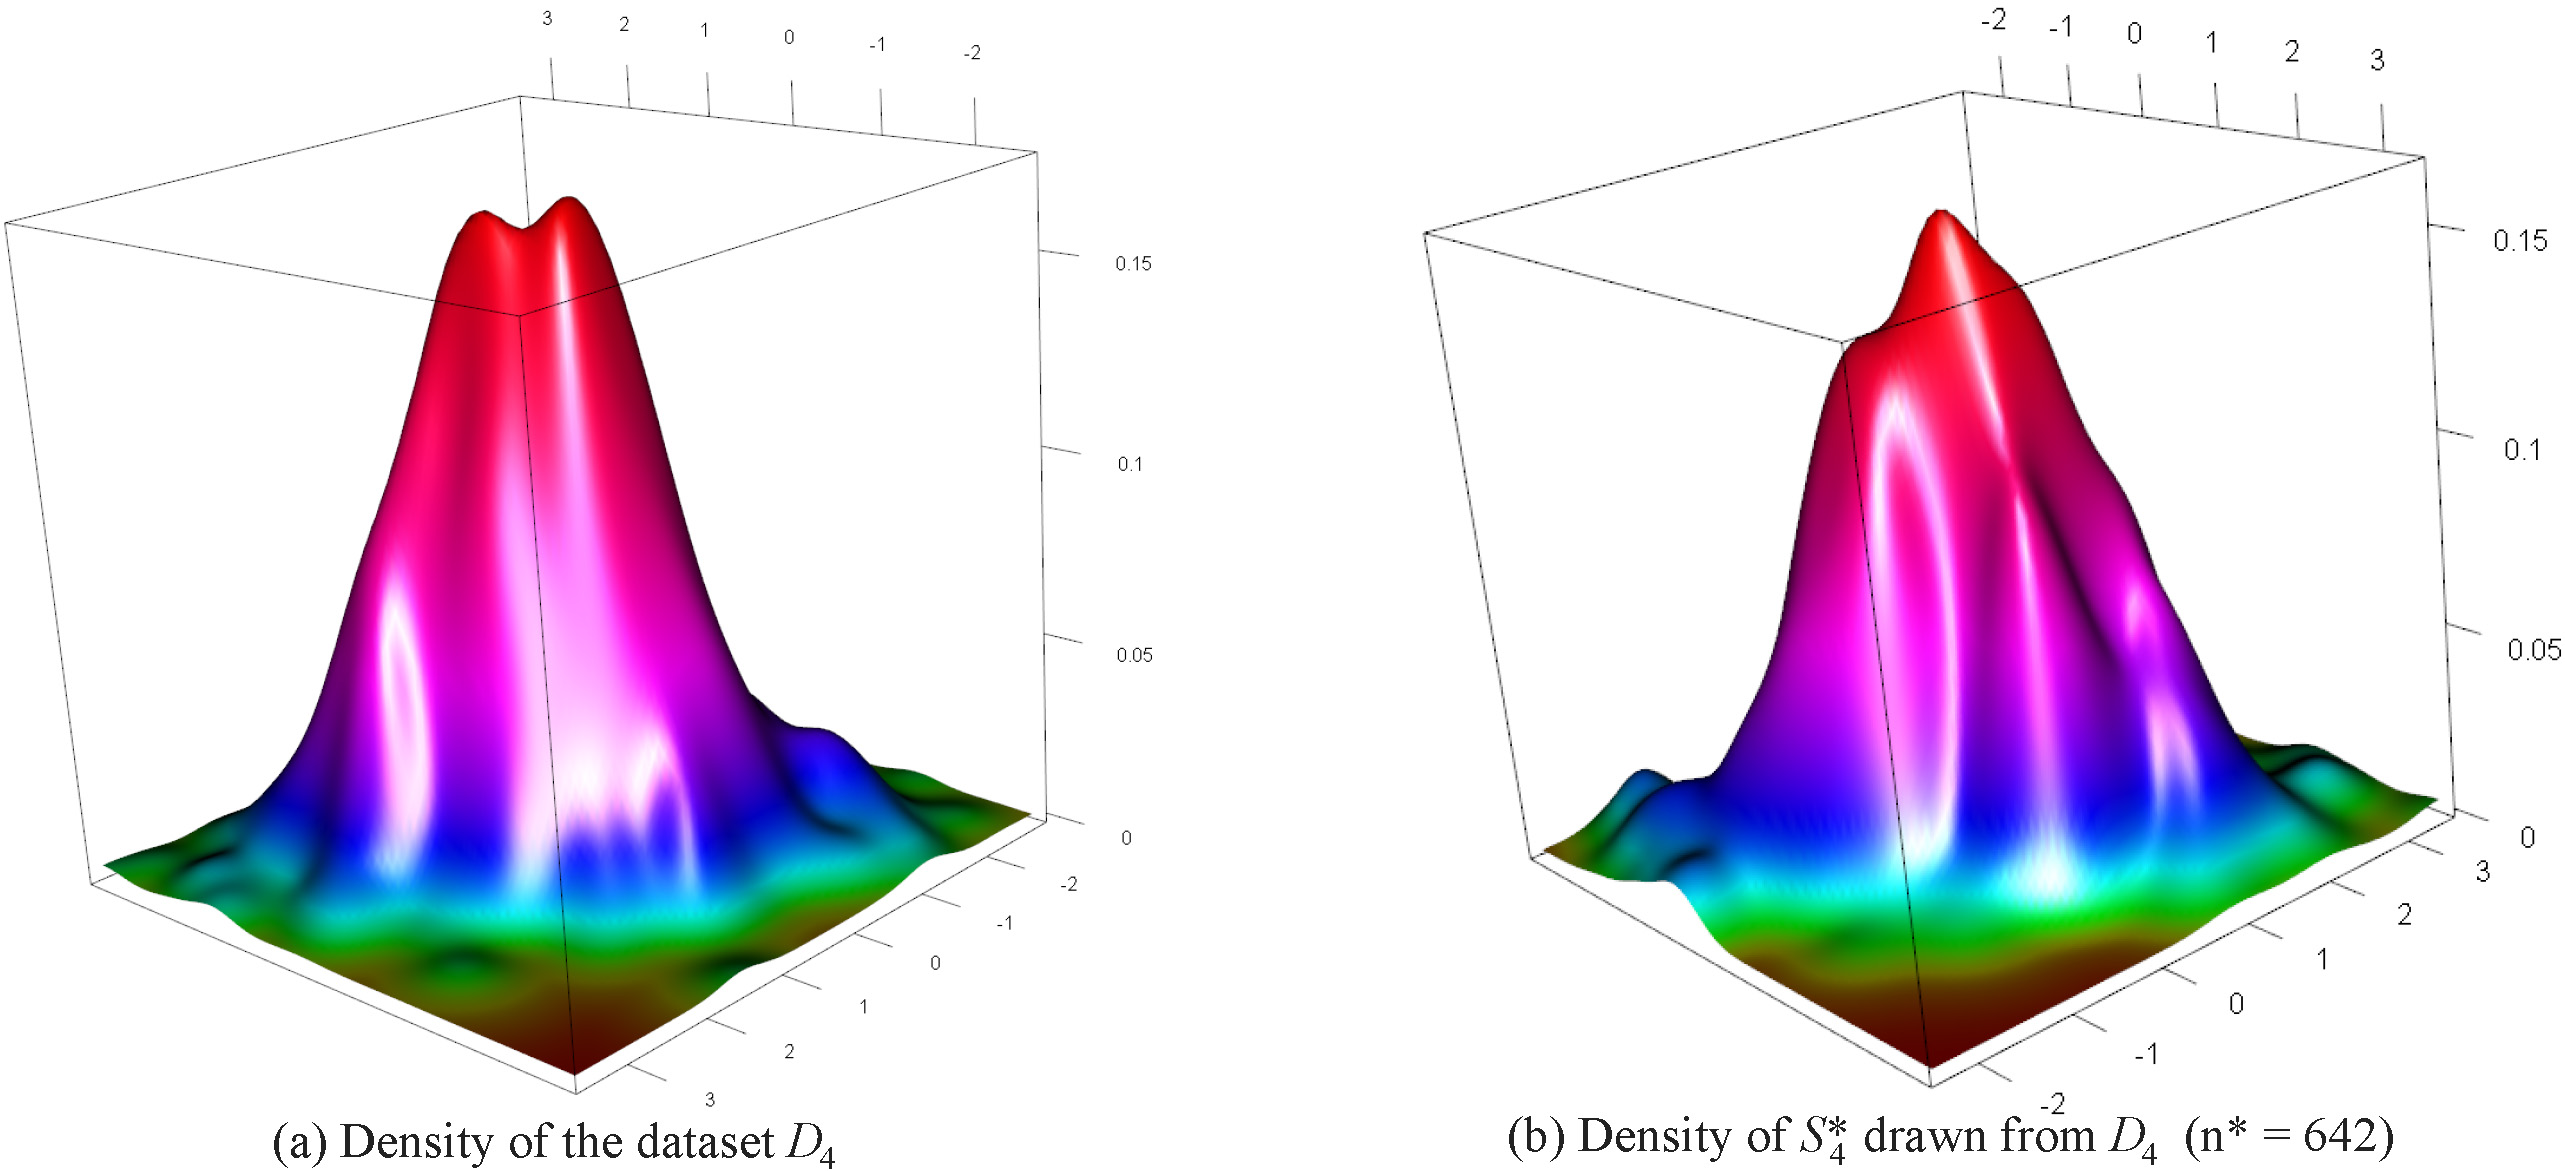
In the case of the
Marginal distribution of 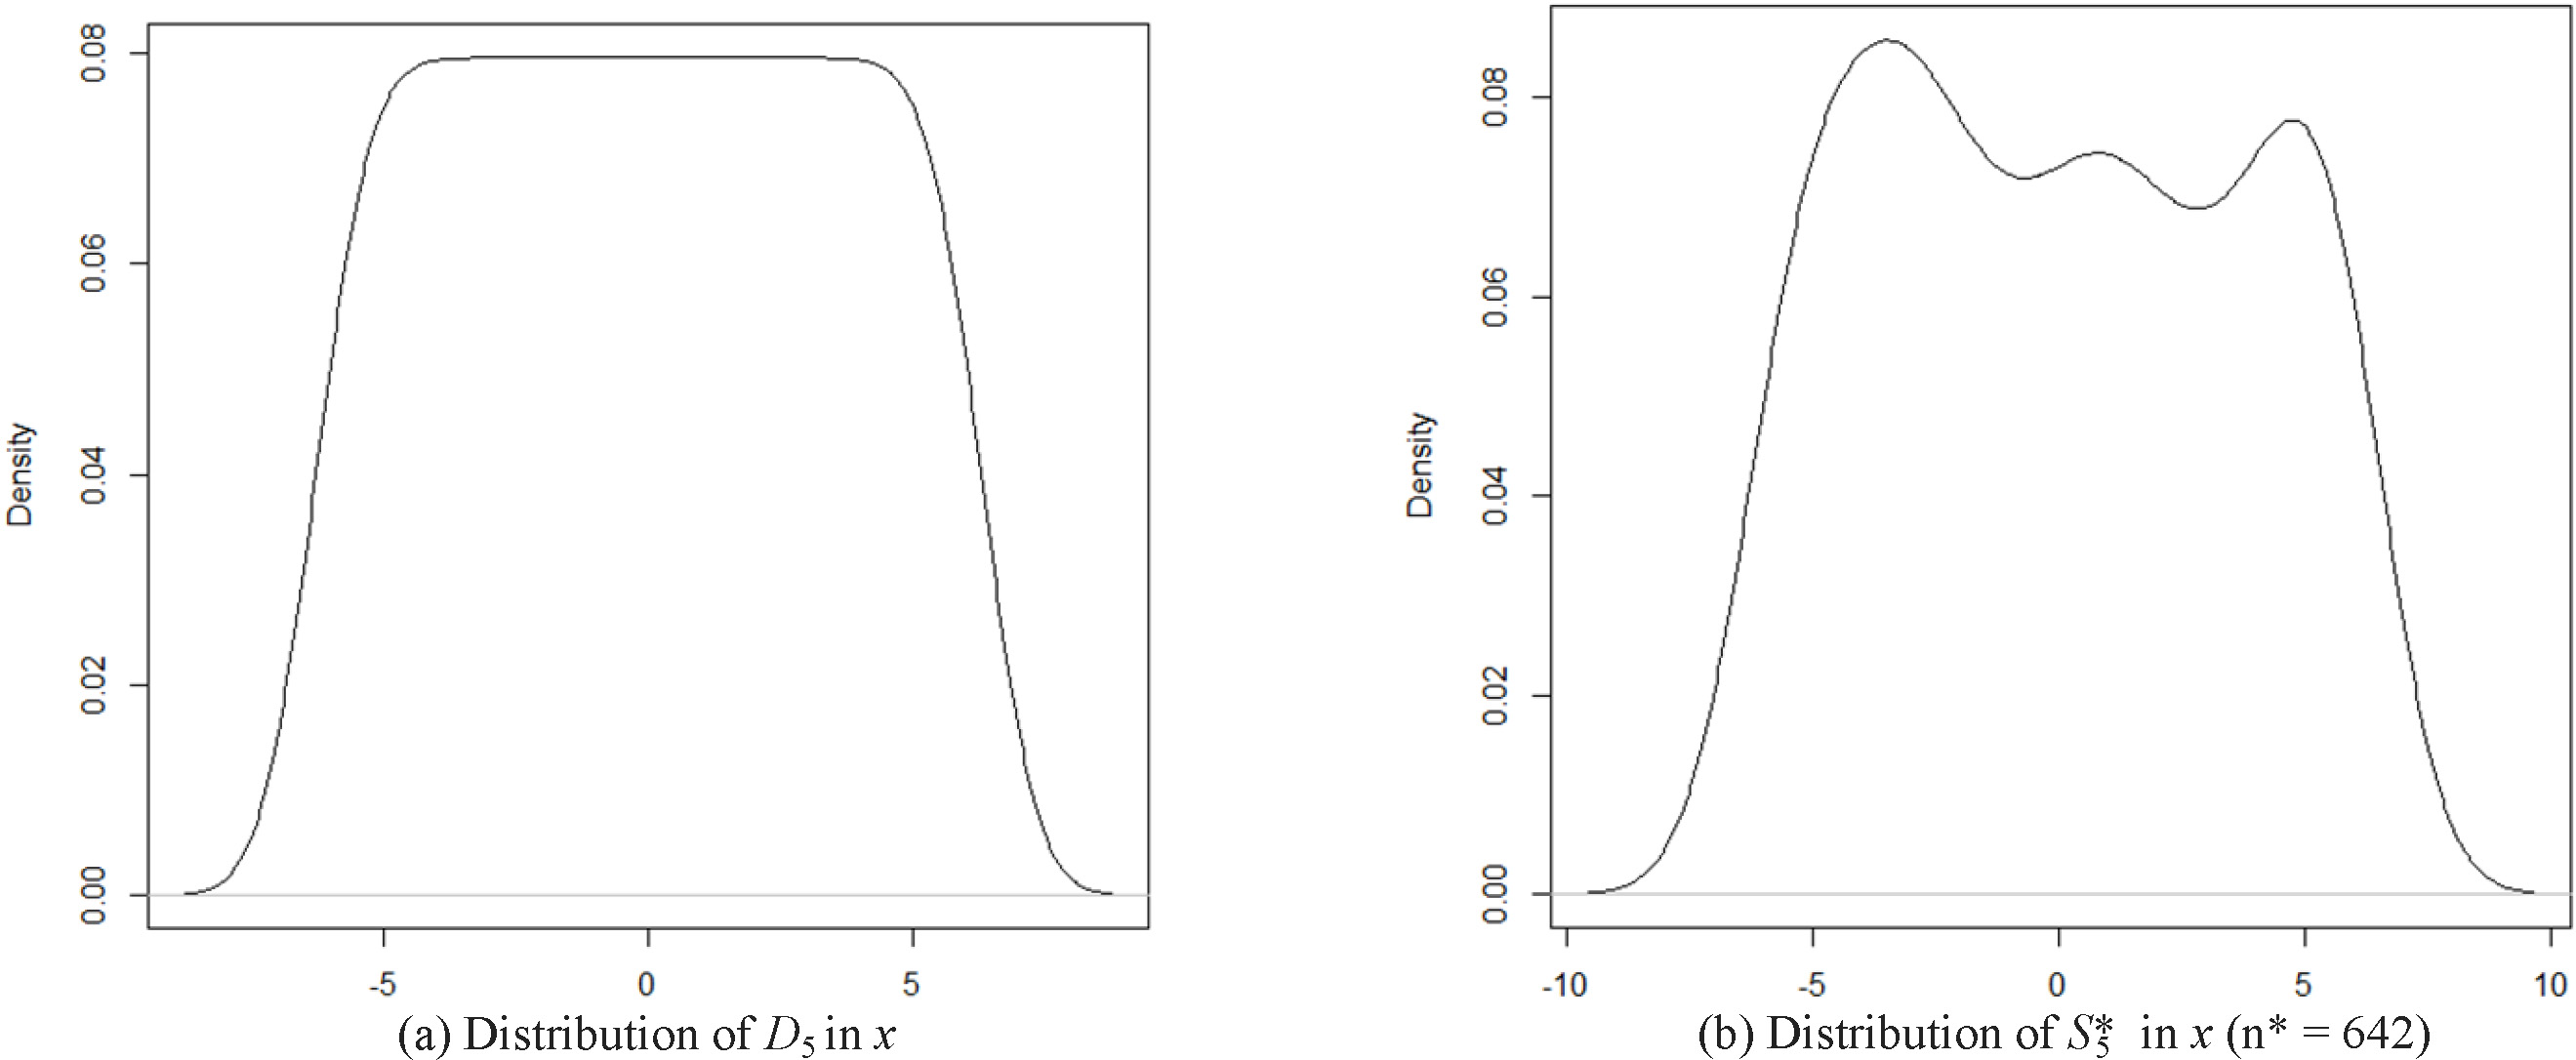
Since the distribution of the
Marginal distribution of 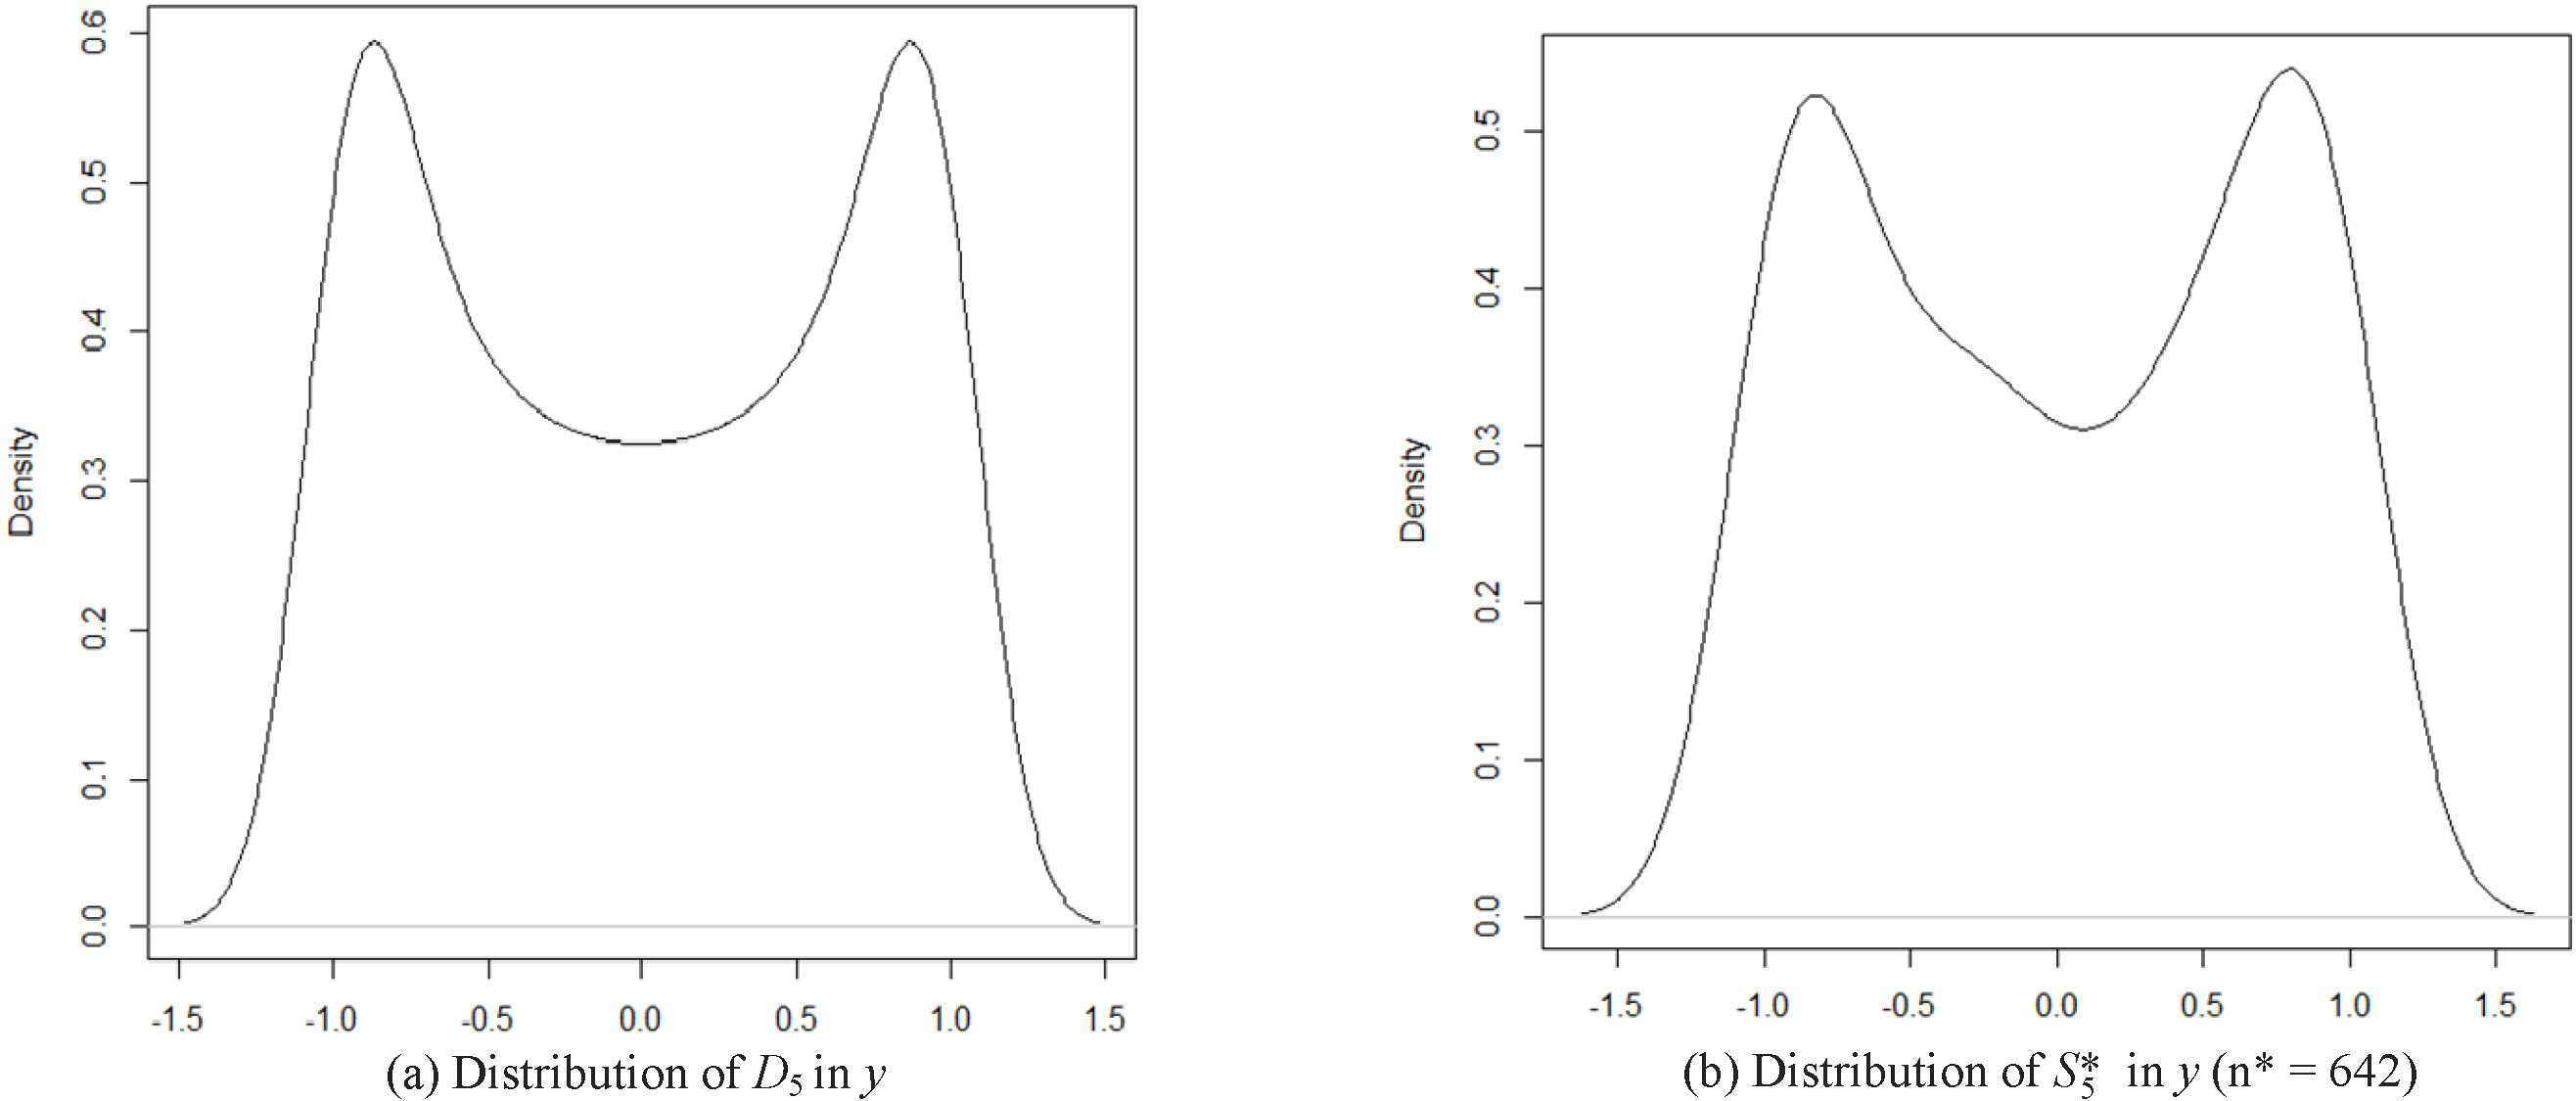
In the case of
The above results show that the samples achieve to retain the information conveyed by the original data and reduce significantly its size. However, these results are not enough to generalize this observation. In the following subsection, we present an experimental methodology that allows us to generalize the effectiveness of our proposal.
We evaluated the effectiveness in two ways: a) the ratio of data reduction and b) the sampling error.
In the first case, we resort to a measure from data compression: the so-called space saving metric (SS) [42] which is a measure relative to the ratio between the size of a sample
A large value of
The experiments show that in average the sampling process allows us to reduce the size of the dataset in more than 70%.
Secondly, we want also to show that the “reduced dataset” (
where
Data reduction effectiveness
Sampling error characterized by
Estimated joint distribution of 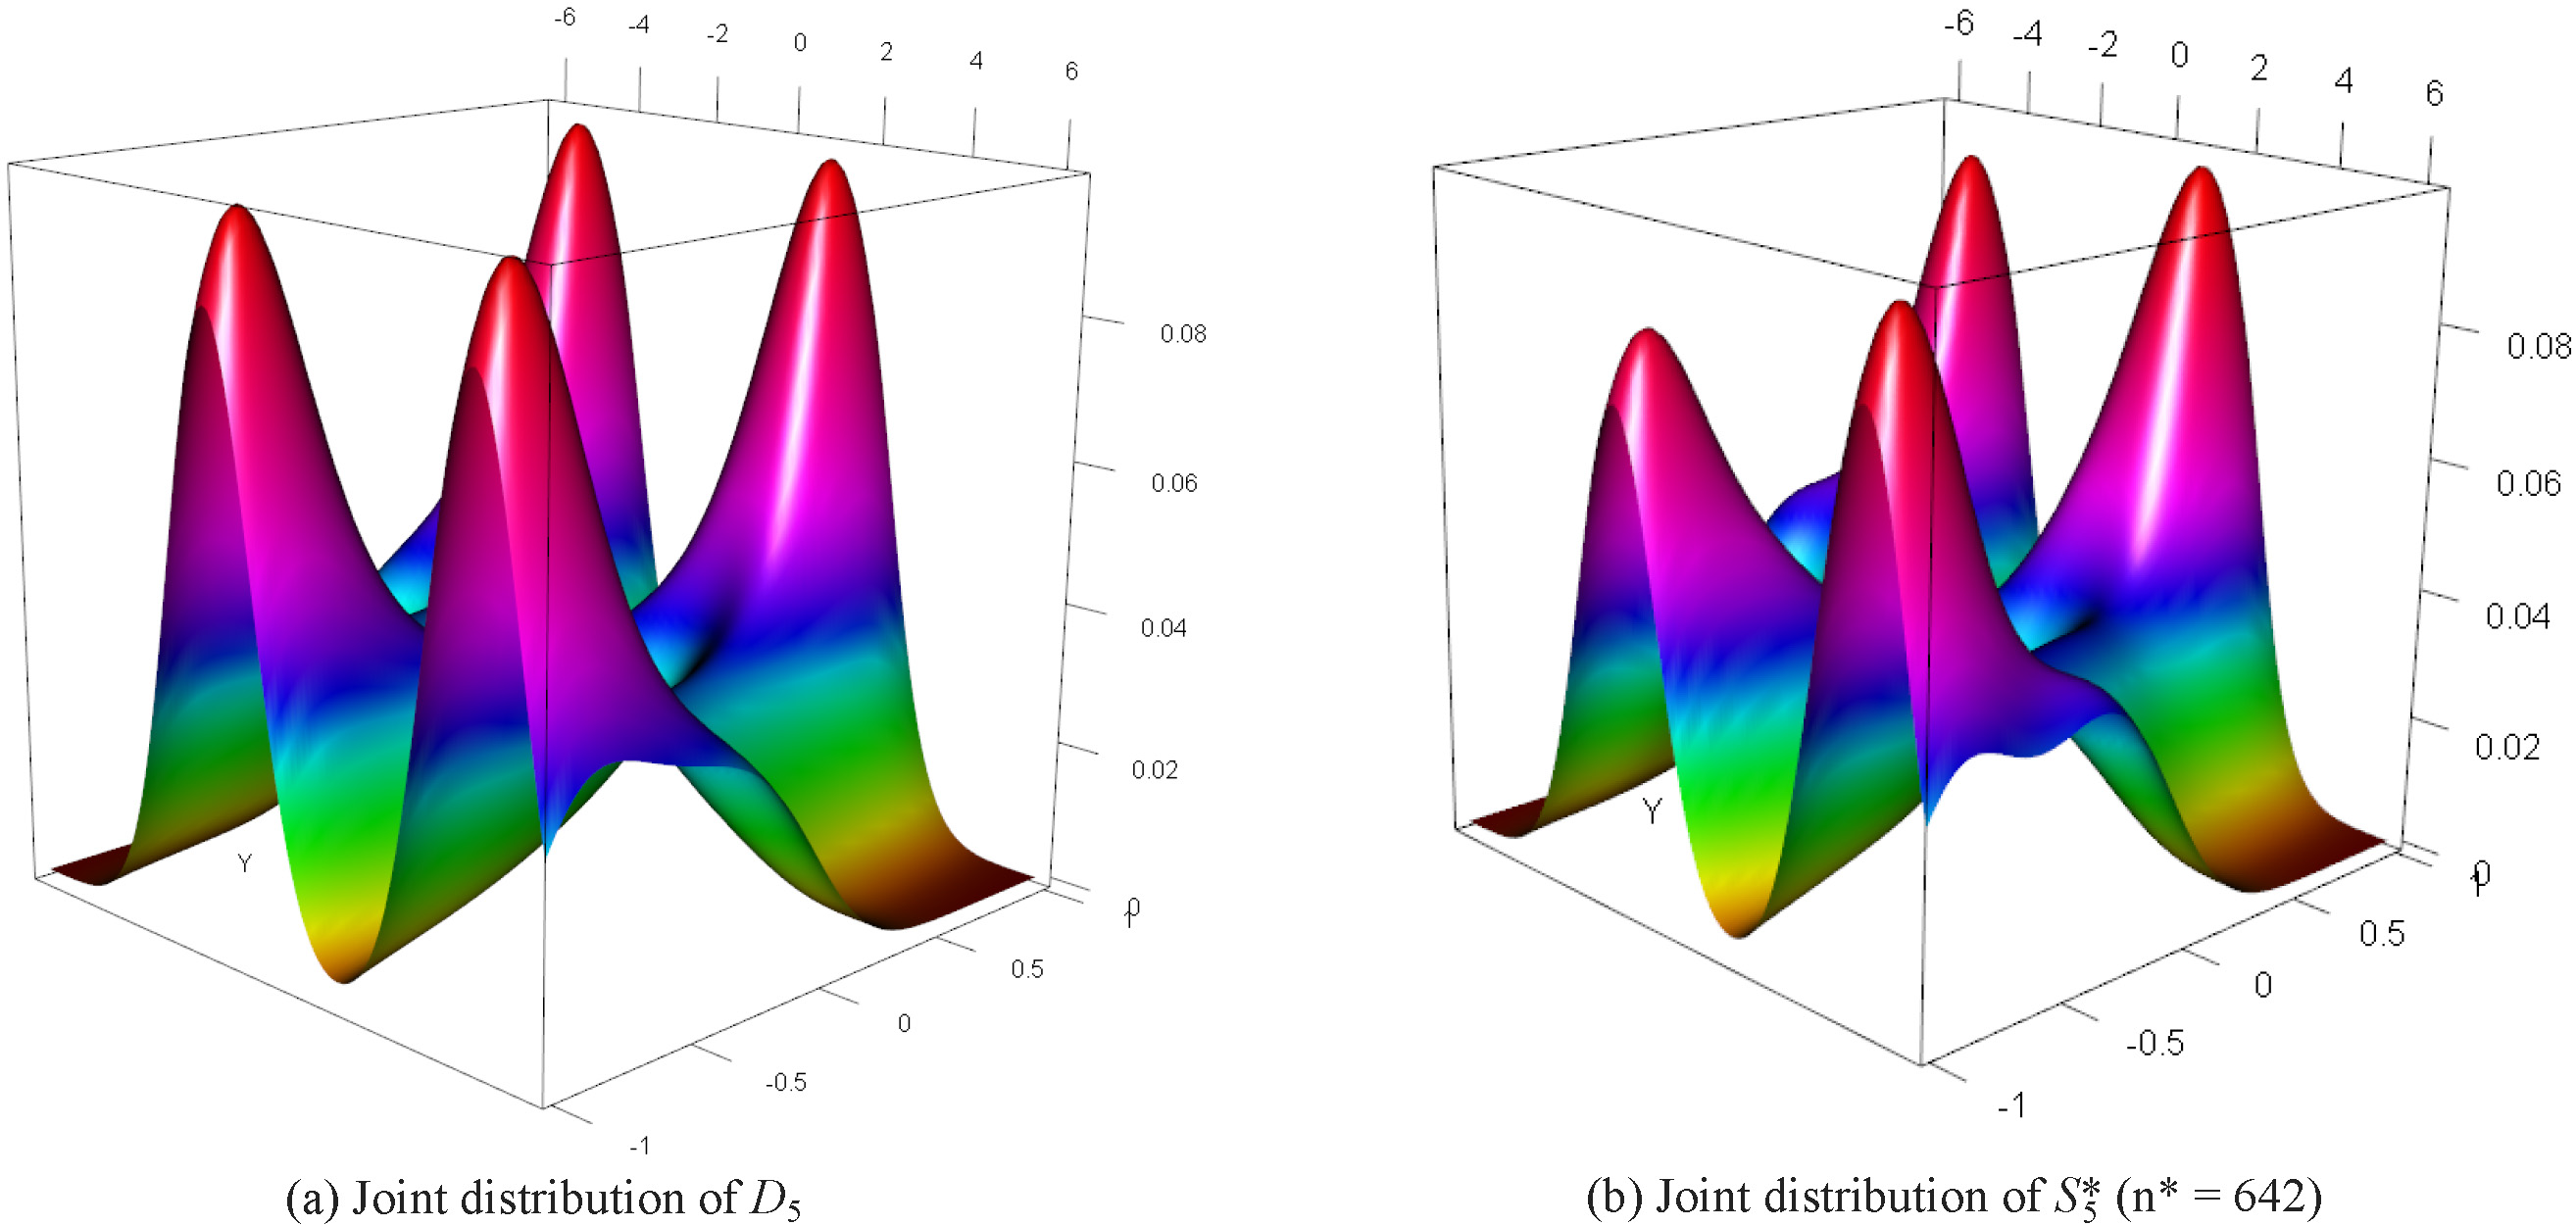
These results show that in general
So far, we have shown that our method achieves to reduce the space of the dataset in more than 70% and preserves its statistical properties. However, typically the datasets have hidden information whose recognition through statistical measures is hard. We want to guarantee that the subset
In order to illustrate the effectiveness of our method to retain hidden information of a dataset when this is sampled, we selected 5 datasets (Abalone [43], Cars [44], Census Income[45], Hepatitis [46] and Yeast [47]) from the UCI Machine Learning repository whose properties are shown in Table 4. We chose labeled datasets that represent classification problems. Selection criteria of these datasets was based on the following features:
Multi-dimensionality. Cardinality. Complexity (non-linearly separable problems). Categorical data. Data with missing values.
Some of these features involve pre-processing tasks to guarantee the quality of a dataset. We applied the following pre-processing techniques:
Properties of the selected datasets
Properties of the selected datasets
Sampling error characterized by
With these sets and resorting to a Bayesian Classifier (BC), we calculate the effectiveness as follows:
Given a labeled dataset
Matching ratio as effectiveness to classification
Execute training process of BC with (
Execute training process of BC with (
Obtain matching ratio between
Based on the above, we determined the effectiveness for each dataset in Table 4. The results are shown in Table 5. For completeness we have included the index of data reduction
These results show that beside reducing the size of the data, our method also preserves hidden information (one that cannot be characterized statistically) which is necessary to the classification process. We can see that the effectiveness (given by matching ratio) is about 90%. It means that our method achieved to obtain samples that allowed us to train a classifier as well as the original datasets. Also, it was possible to reduce the size of such datasets by 68% (in average).
As a first approach, we use a synthetic Gaussian dataset in
Marginal PDFs after executing FRPS given a Gaussian dataset in 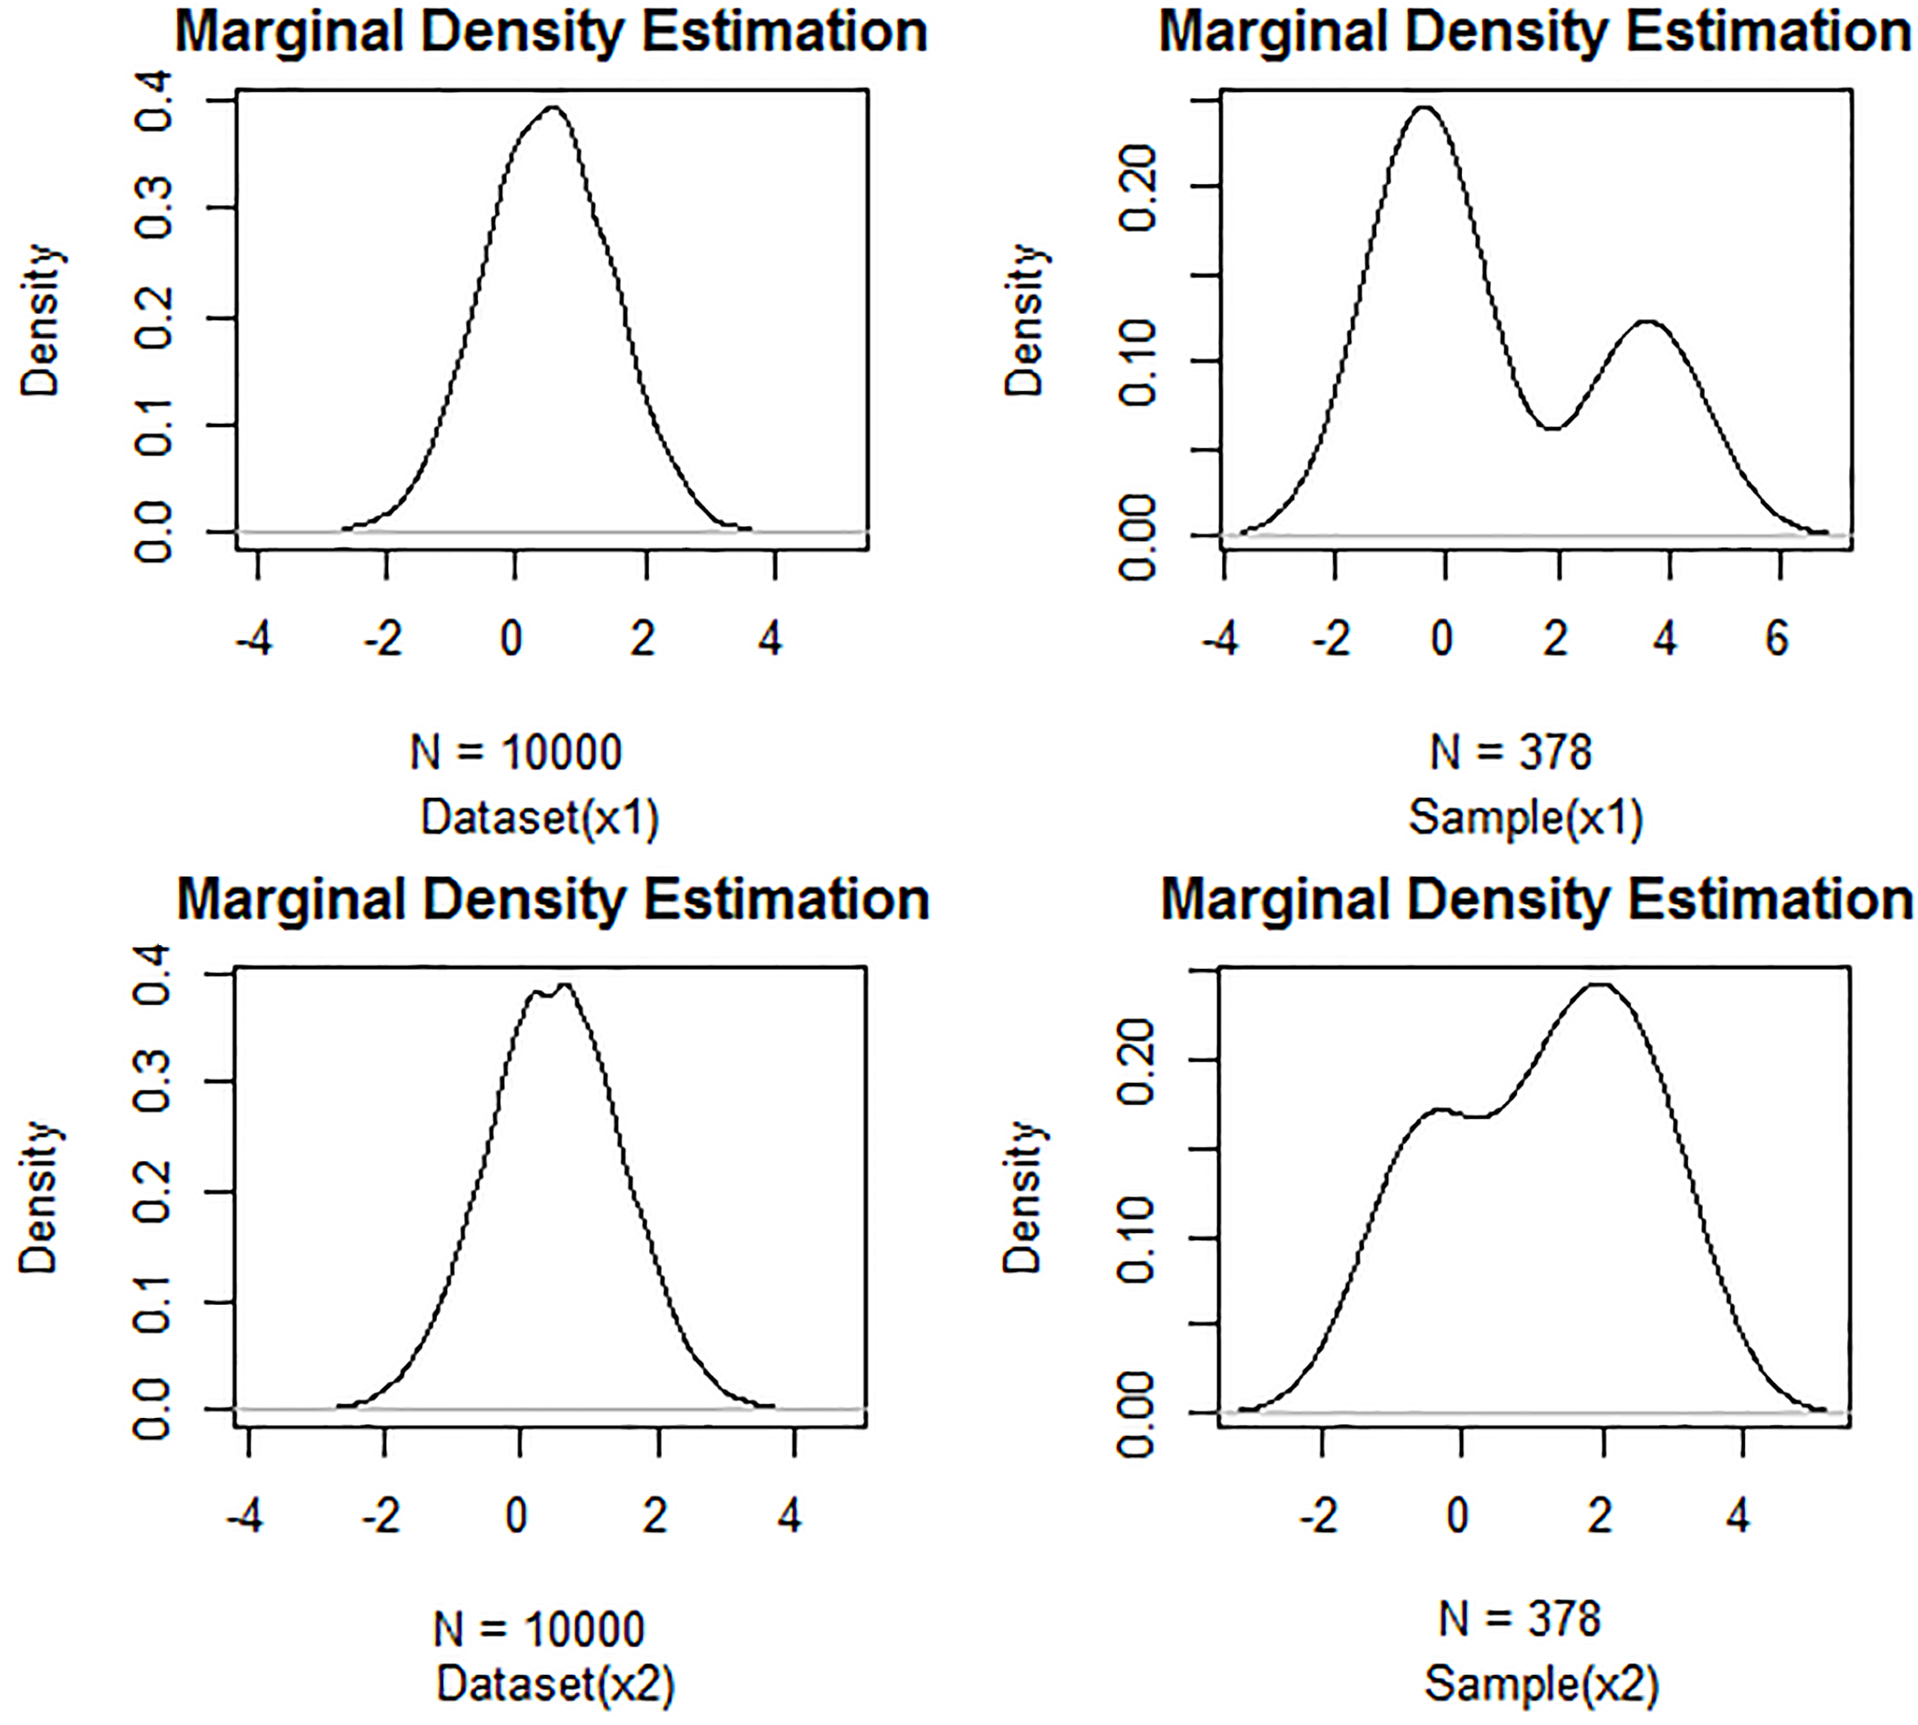
Marginal PDFs after executing FRIS given a Gaussian dataset in 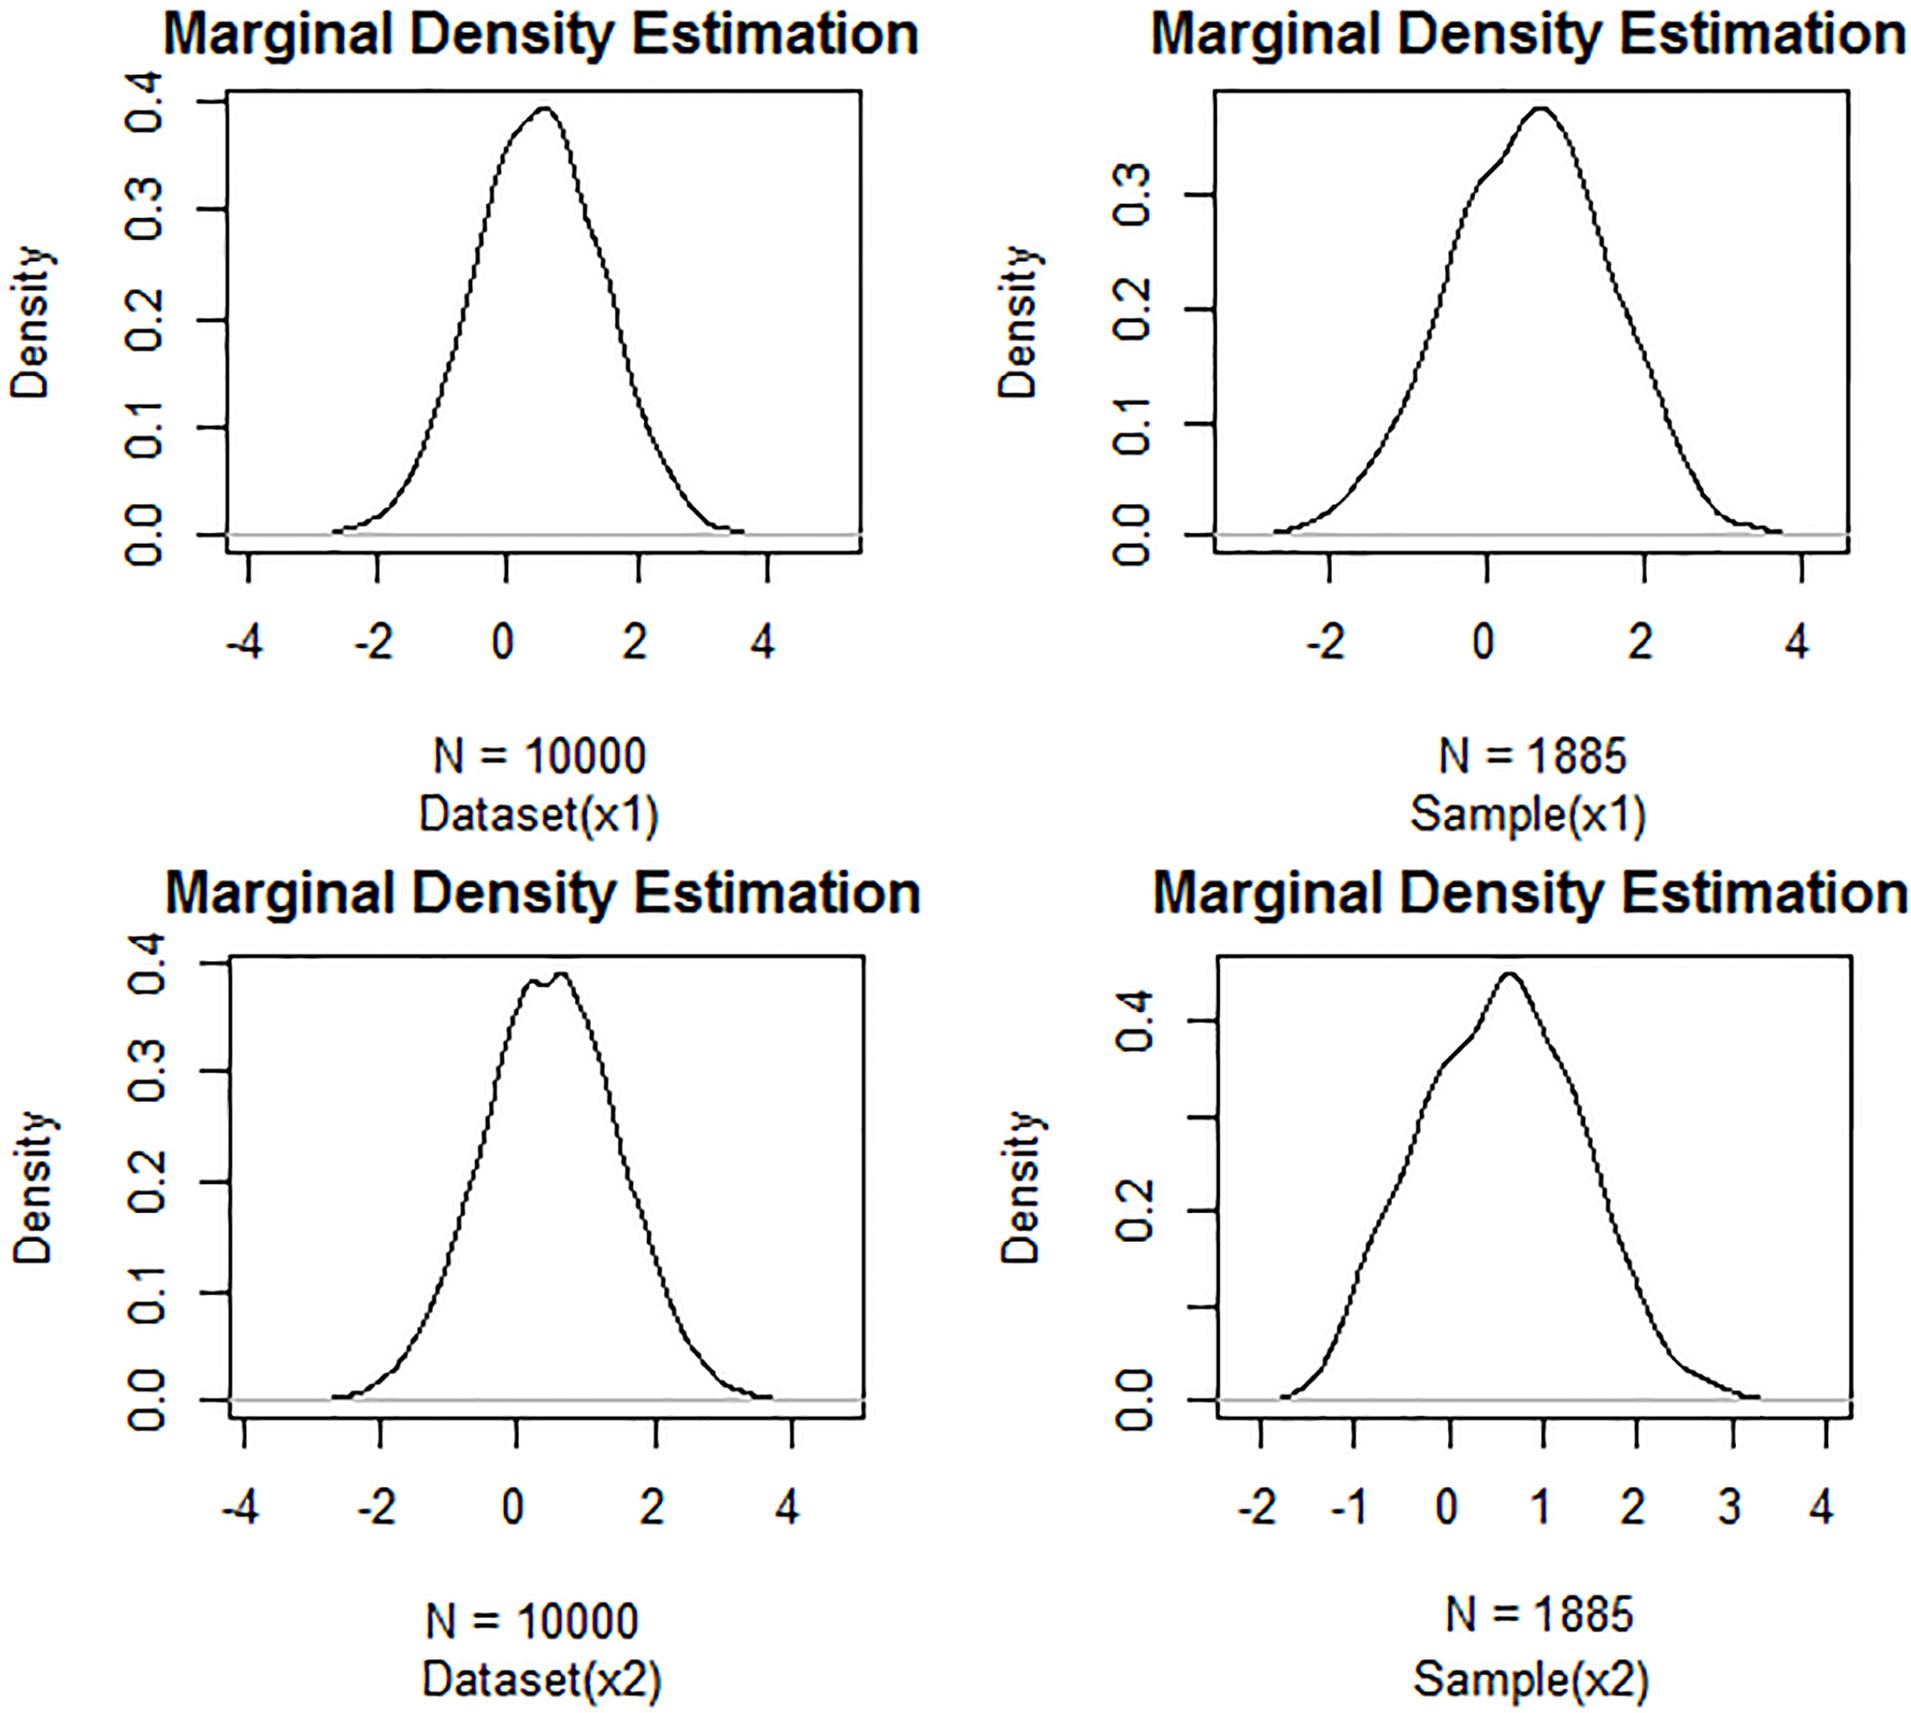
Marginal PDFs after executing FRIS given a Gaussian dataset in 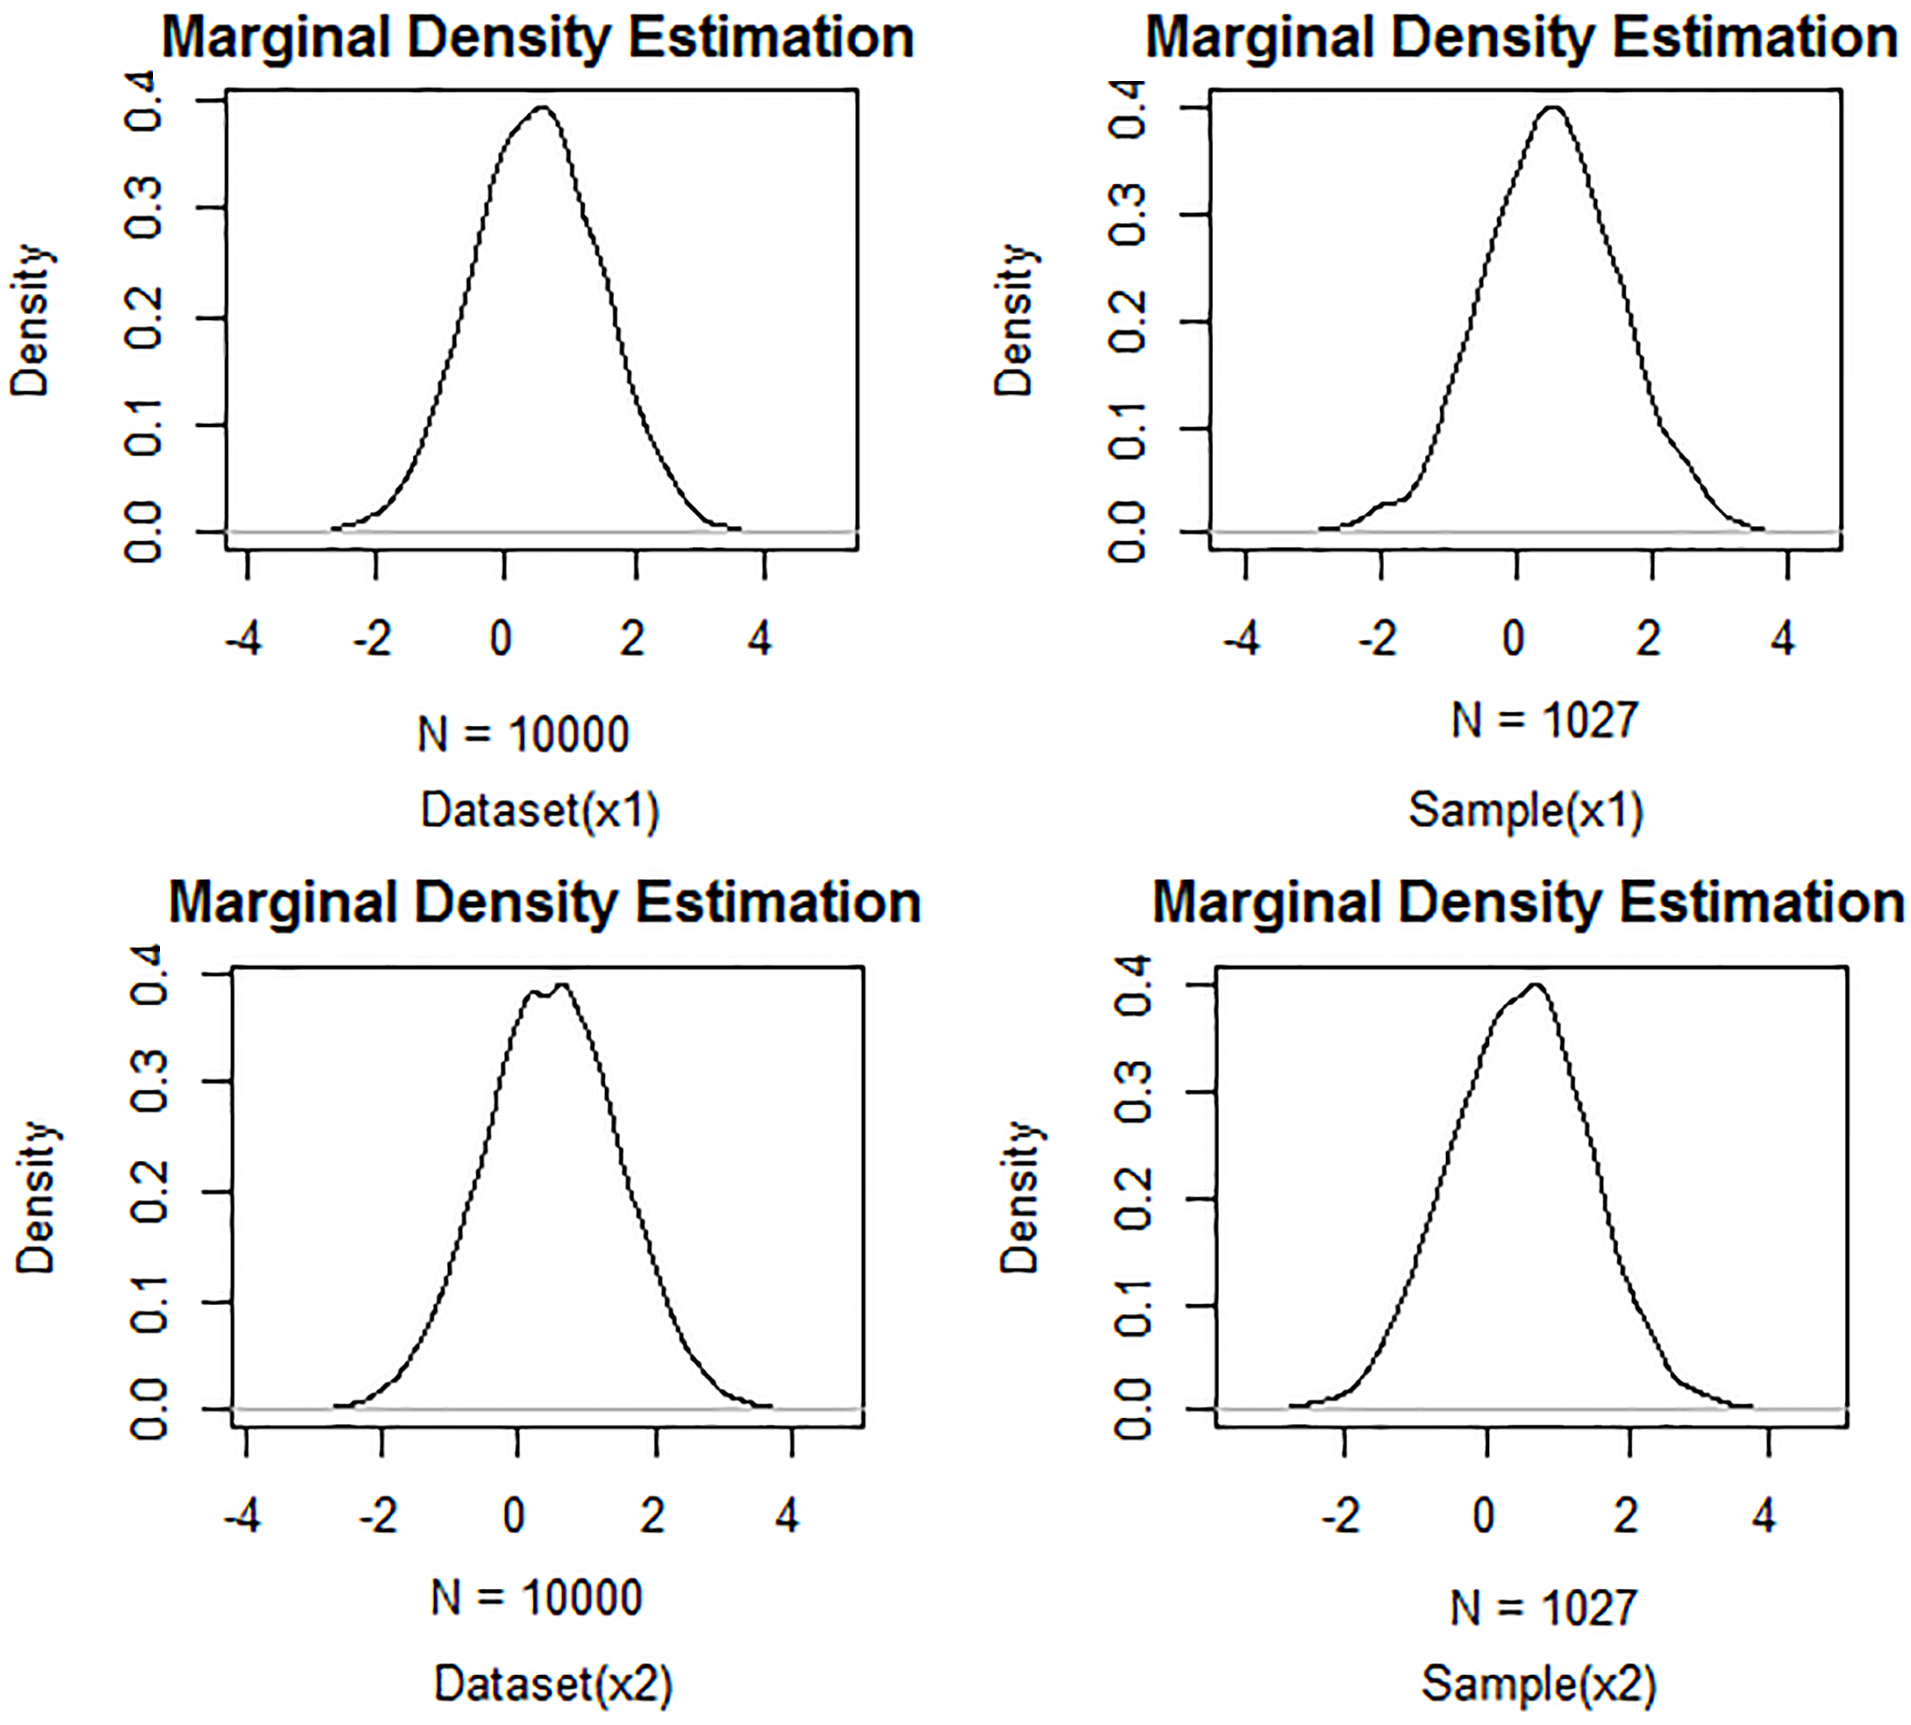
Figure 13 shows the results obtained after executing FRIS. We can see a improvement, since the method achieves to obtain a sample (larger than the obtained by FRPS) that preserves in some degree the statistical properties of the dataset given its marginal PDFs.
In Fig. 14 we can see the results obtained by our proposal. We can see that it achieves a sample whose marginal PDFs are more similar to marginal PDFs of the dataset, in contrast with the samples obtained by FRPS and FRIS. It should be noted that the size of this sample is between 378 and 1885 (sizes sample obtained with FRPS and FRIS respectively). Based on the above, we can hypothesize that our method allows us to obtain the sample with the optimal size subject to constraints that force the preservation of statistical properties characterized by its PDF.
Since the above results are not enough to ensure the effectiveness of our method (at least from the statistical view point), we executed FRPS and FRIS with the same datasets used in Subsection 4.2, in order to obtain the average values of the effectiveness measures
We can see that the baseline methods achieved to reduce about 90% of the original dataset in contrast with our method that achieved a reduction about 80% in average. However, the values of
A new reduction data method based on the entropy has been defined in order to find a minimal sample that preserves the information of a large dataset. Finding the optimal sample involves an optimization problem that requires an efficient method to explore the huge feasible space. We use EGA as the best alternative. A first approach allows us to verify that our method is able to find a sample from a dataset that retains the original properties characterized by the probability distribution. Based on these results a wide set of experiments on synthetic datasets was executed. We found that in general, the sample retains about 98% of the statistical properties of
Appendix A: Eclectic genetic algorithm
For those familiar with the methodology of genetic algorithms it should come as no surprise that a number of questions relative to the best operation of the algorithm immediately arose. The Simple Genetic Algorithm [50] frequently mentioned in the literature leaves open the optimal values of, at least, the following parameters:
Probability of crossover ( Probability of mutation ( Population size.
Additionally, premature and/or slow convergence are also of prime importance. For this EGA incorporates the following:
Full elitism over the last set of Deterministic selection as opposed to the traditional proportional selection operator. Such scheme emphasizes genetic variety by imposing a strategy that enforces crossover of predefined individuals. After sorting the individual’s fitness from better to worse, the Crossover is performed with a probability Mutation is performed with probability
Eclectic Genetic Algorithm
Generate a random set
duplicate(
Generate a random number
crossover(
Mutate the population in