
Abstract
Many researches have exploited textual data, such as news, online blogs, and financial reports, in order to predict stock price movements effectively. Previous studies formed the task as a classification problem predicting upward or downward movement of stock prices from text documents. Such an approach, however, may be deemed inappropriate when combined with sentiment analysis. In financial documents, same words may convey different sentiments across different sectors; if documents from multiple sectors are learned simultaneously, performance can deteriorate. Therefore, we conducted sentiment analysis of 8-K financial reports of firms sector by sector. In particular, we also employed distributed representation for predicting stock price movements. Experiment results show that our approach improves prediction performance by 25.4% over the baseline model, and that the direction of post-announcement stock price movements shifts accordingly with the polarity of the sentiment of reports. Not only does our model improve predictability, but also provides visualizations, which may assist agents actively trading in the field with understanding the drivers for the observed stock movements. The two main aspects of our model, predictability and interpretability, will provide meaningful insights to help decision-makers in the industry with time-split trading decisions or data-driven detection of promising companies.
Keywords
Introduction
The study of the prediction of stock prices has been one of the major branches in the field of financial research. Previous studies relied on mathematical models to predict stock prices using quantitative variables such as historical time-series of stock prices[23, 2], as well as microeconomic and macroeconomics indicators [18]. Despite continuous efforts, econometric and artificial intelligence models in the past have not witnessed significant improvement in performance. This is partly due to the difficulty of discovering novel, meaningful factors that help explain stock price movements aside from the traditional ones. On the other hand, models that utilize a limited set of input variables are of less value especially to decision-making agents and investors actively operating in financial industry, since such information is fair-to-all and publicly available, hence reducing their chance to “beat the market.” In order to tackle such shortcomings, more recent studies began to incorporate textual data in the analysis of market behaviors, ranging from the comprehensive reports on the company’s performance submitted to the Securities and Exchange Commission (SEC) such as 10-Ks and 10-Qs [15], opinion columns in Wall Street Journal’s[12] and the finance section of the New York Times [17] to earning press releases [21]. Specific words, phrases, paragraphs, and documents appearing in text data convey certain sentiments, and the analysis of these sentiments is gaining growing attention as a new method for stock price prediction in the financial field. Recent work has suggested that deep learning models may improve performance in predicting stock prices [41]. However, same words may convey different sentiments in different sectors, and performance can potentially degrade if the prediction model learns documents from multiple sectors simultaneously. For example, words such as war, attack, and terrorism are generally associated with negative sentiments, while they may positive implications for firms in military supply or military intelligence industry. Therefore, it is necessary to design a model that can accurately account for different industry effects when considering textual information in solving prediction tasks.
(a) 8-K announcement of Citigroup Inc. and subsequent stock price movement (b) 8-K announcement of JP Morgan Chase & Co and subsequent stock price movement.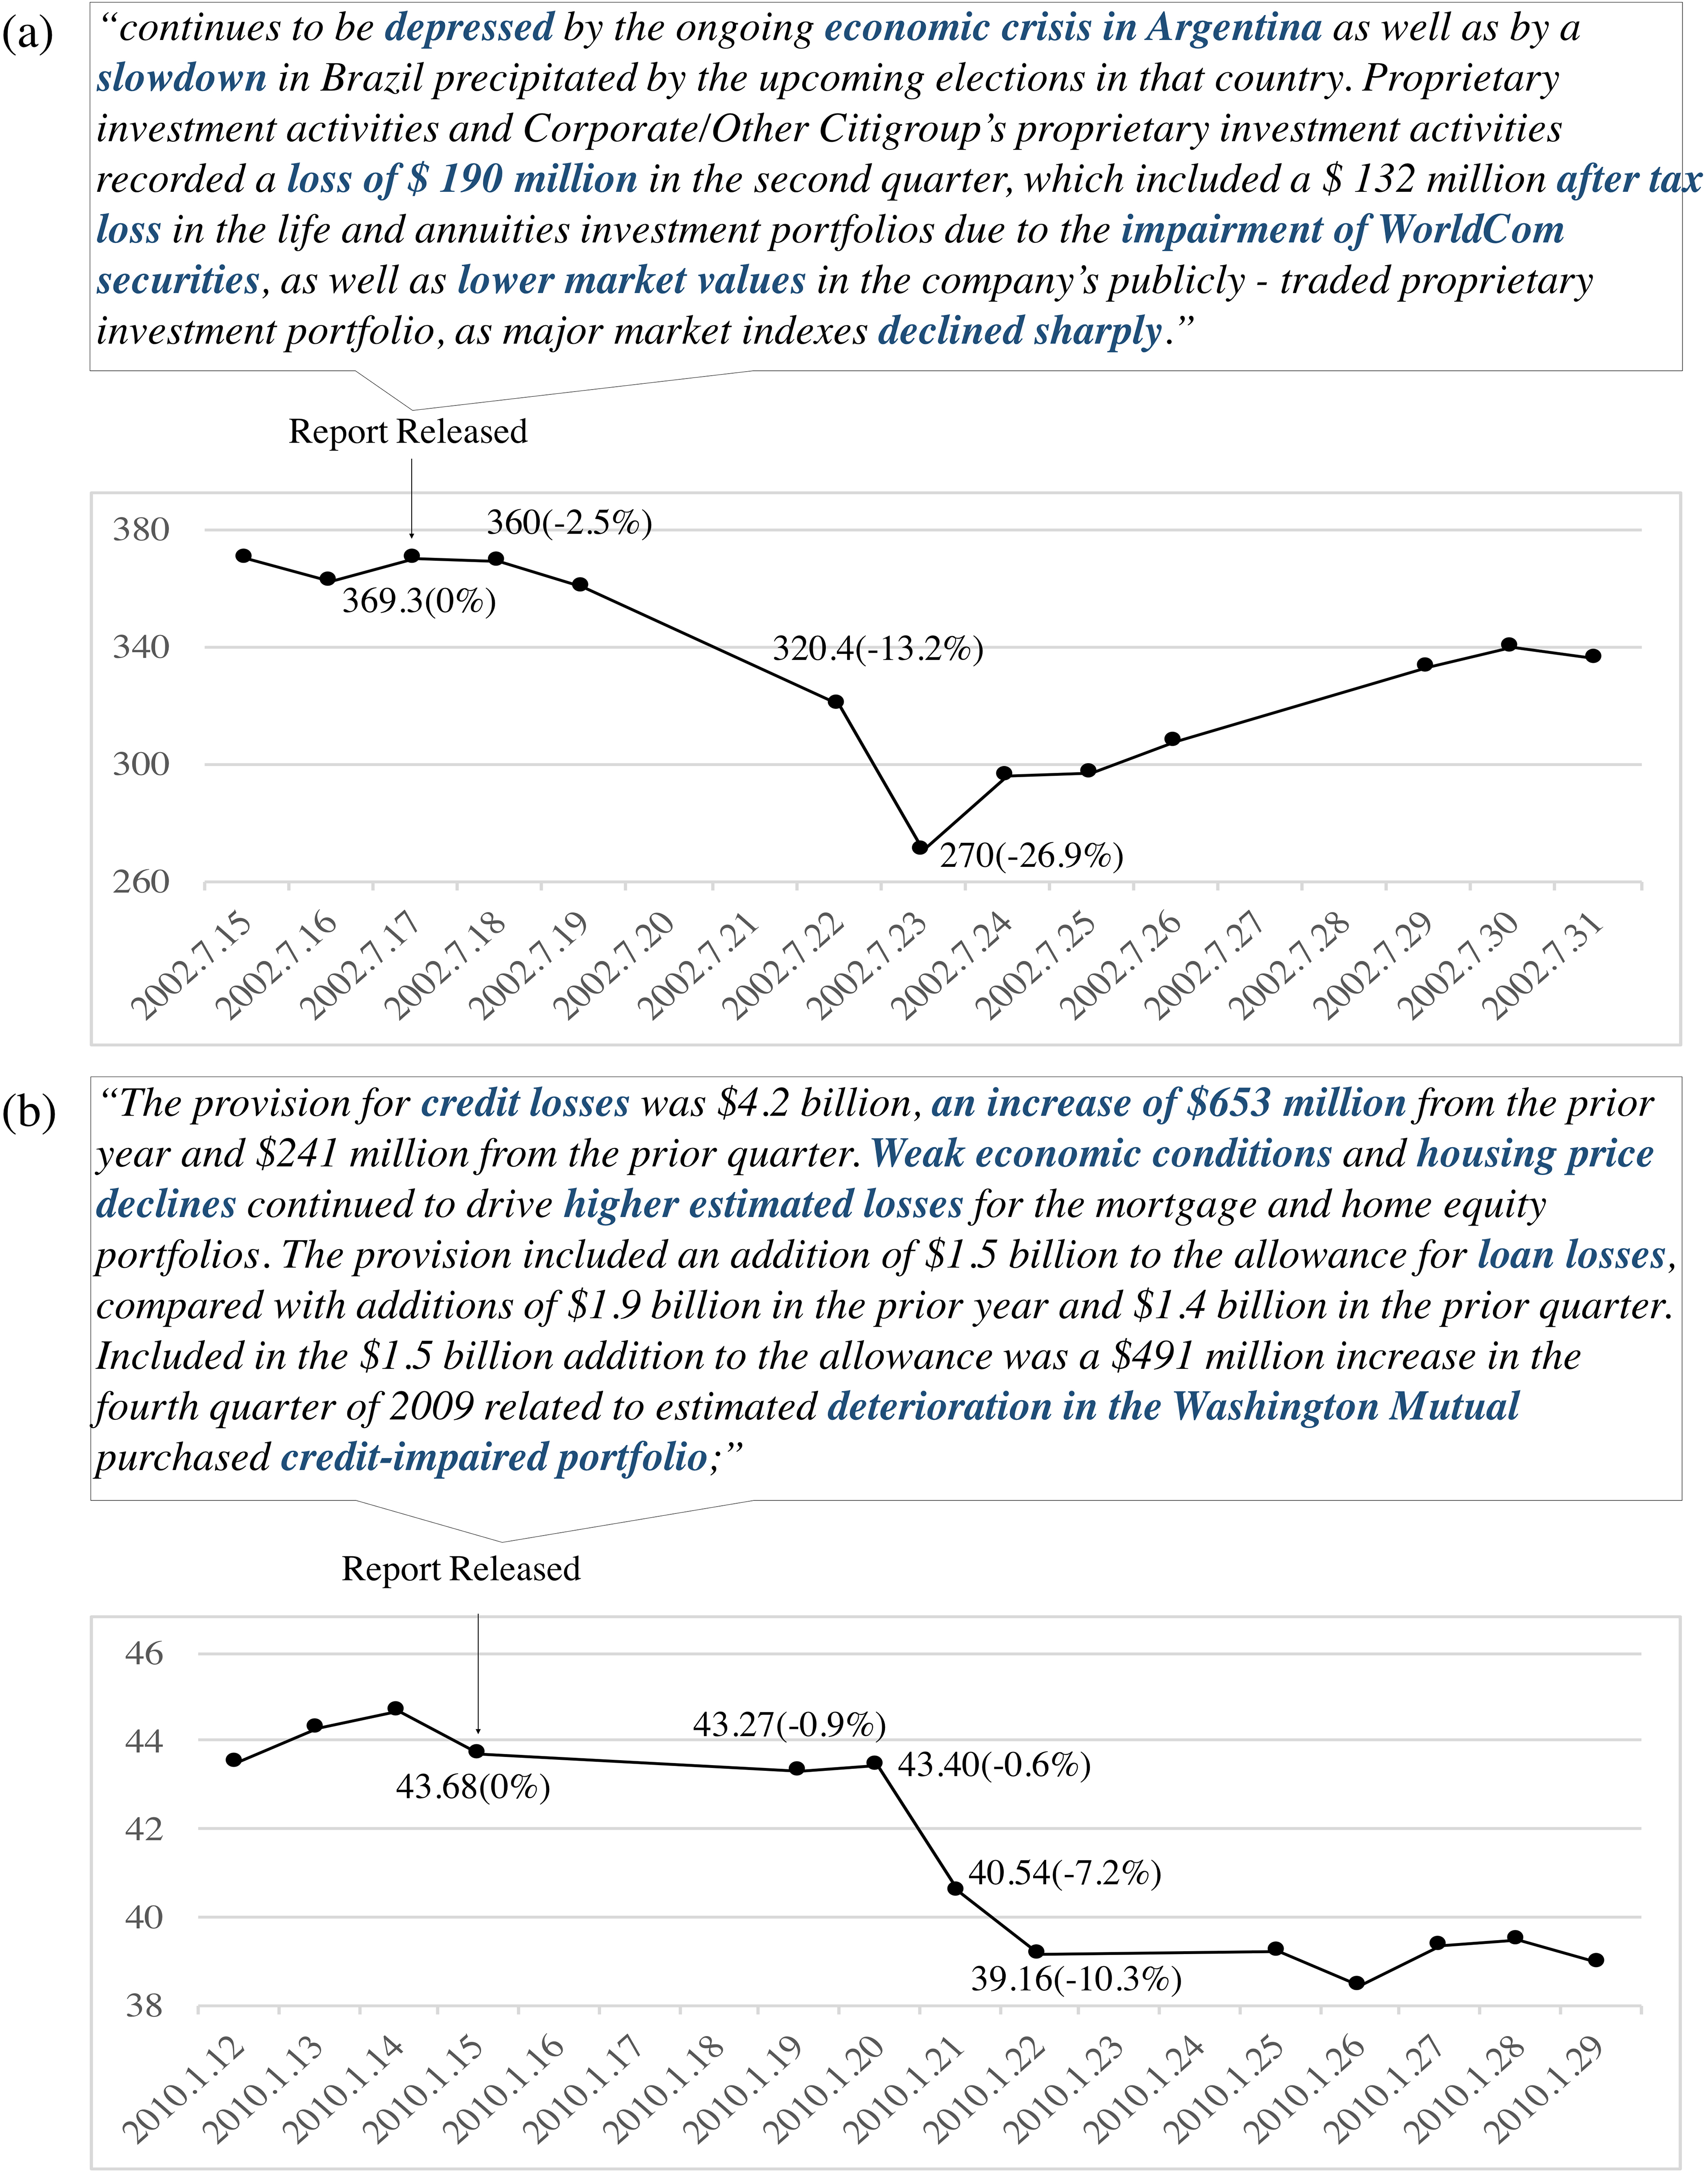
The objective of this paper is to predict stock price movements in both quantitative and qualitative ways by analyzing the sentiments of 8-K financial reports based on the means of distributed representation. For example, consider the excerpts from 8-K reports by Citigroup Inc. and JP Morgan Chase & Co and their respective stock price movements presented in panels (a) and (b) of Fig. 1. Citigroup’s 8-K report, presented in panel (a), was released on July 17, 2002; JP Morgan’s, presented in panel (b), was released on Jan 15, 2010. Words highlighted in blue are associated with negative sentiments. The values in parentheses show the percentage decline in stock prices following the 8-K announcement date. Figure 1 shows that the stock price of Citigroup has fallen by 26.9% in four business days after its announcement, while that of JP Morgan dropped by 7.2% within three business days after the announcement for JP Morgan. Observations from Fig. 1 indicates that the sentiment of financial report announcements may be a great tool to explain the subsequent stock price movements. Our goal is to automate such a process and produce meaningful results by employing distributed representation method.
Data flow diagram in terms of prediction and interpretation.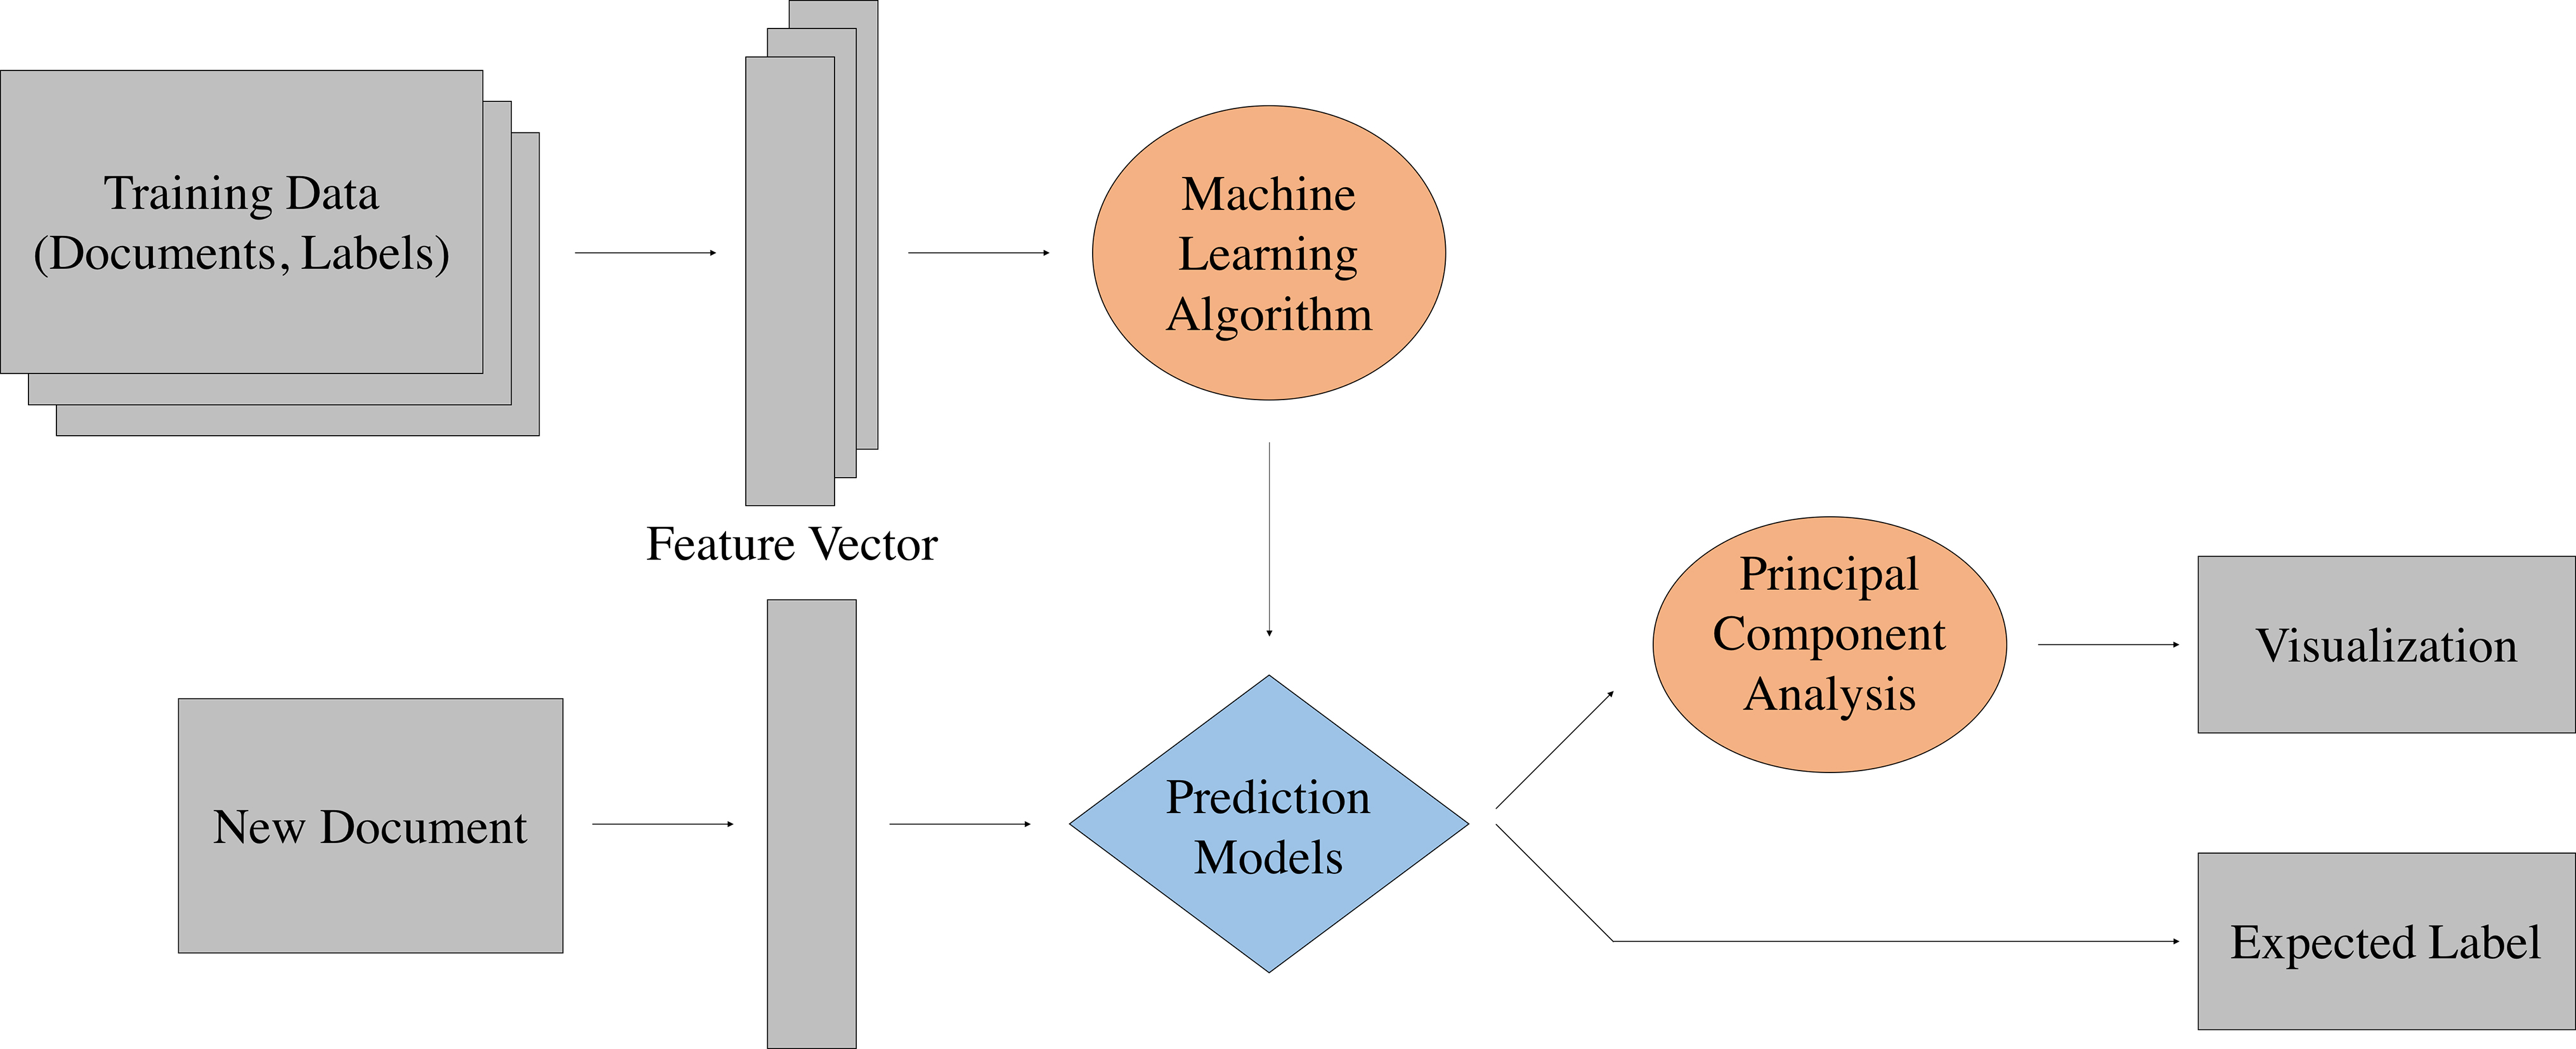
Distributed representation expresses documents as vectors, which are used to embed documents along with class information on the same space. This enables calculation of distances among documents and sentiment classes, hence allowing identification of the sentiment class of given documents. Moreover, since document representations are now in the form of vectors, one can easily visualize the sentiment class of the document after some dimension reduction process. A data flow diagram of our methodology is shown in Fig. 2. Distributed representation method incorporated in this study does not only improve predictability of the model as compared to the conventional one-hot encoding approach but also provide visualization of the prediction results, hence adding interpretability. Improvement in predictability of the model, as well as the visualizations produced as the result of the analysis, can be used to help active traders in the field when making time-split trading decisions or data-driven detection of promising companies. On the other hand, the visualization produced by the model may directly benefit the decision-making agents of the industry by providing intuitive illustration of the relationship between the sentiment and the stock price movement. Because our visualization results place stock price movements side-by-side to the sentiment trend of documents reporting about the respective company, which help enhance the understanding of the readers and assist with their decision-making by providing intuitive insights.
The remainder of this paper is structured as follows: Section 2 introduces past literature that has incorporated text data in solving stock price prediction tasks. We introduce model framework of this study in Section 3. Section 4 describes experiment settings and reports results. Finally, we conclude this paper in Section 5.
Various hypotheses and models have been proposed and applied to explain financial markets. According to the efficient market hypothesis of Fama [14], it is impossible to predict the market perfectly since publicly available information is fully reflected in stock price and the market will respond only to the new information. However, Lo and MacKinlay [26] insisted that the market could be predicted to some extent. Apart from the traditional autoregressive integrated moving average (ARIMA) models [3], more recent work began to look to artificial intelligence algorithms to solve stock price prediction tasks. For instance, R. Sitte and J. Sitte[39] used a neural network (NN) to detect weak signals in the S&P 500 time series, while Ballings et al. [4] employed random forest (RF) model to predict the direction of stock price movements. Support vector machine (SVM) was another technique utilized in various studies to predict stock price indices [43]. In addition, in the financial market and industry, researchers have actively employed both textual and numerical data in order to predict stock price changes. Chen and Liu[7] and Schumaker and Chen[38] make use of both news articles and text from social network services as well as online blogs, where the former represents market sentiment, while the latter, individual investor’s sentiments.
Druz et al.[13] collected earning transcripts from 2004 to 2012 for all stocks belonging to the S&P 500 index and studied the relationship between the managerial tone and the investor’s variables of interest, including future stock returns. A “negativity” score, defined as the number of negative words minus the number of positive words divided by the sum of negative and positive words plus 1, was used to standardize the “one surprise”, the excessive components of managerial tone. Druz et al. [13] reported that tone surprise was a significant factor in predicting earnings per share adjustments to the sell-side trader. Furthermore, from the adjusted long-short strategy from the regression framework taking long stocks with positive tone surprise and short stocks with negative tone surprise they obtained 1% return within 60 days after the earning call. Jegadeesh and Wu [22] found a meaningful relationship between market reaction and the tone quantified from the Form 10-K documents by counting negative and positive words. The results from multivariate regressions showed that both negative and positive words were significant features in explaining market reaction, and the effect of the tone of documents were observed quickly in the market, mostly within two weeks. The same methodology was applied to the IPO prospectuses to examine the relationship with IPO underpricing and found that tone of IPO prospectuses adversely affected IPO underpricing. Heston and Sinha [19] predicted stock prices exploiting almost 1 million news stories. The sentiment of news stories was measured by using the Thomson Reuters sentiment engine, and the sentiment of companies was calculated by subtracting negative sentiment score from the positive. Results showed that the duration of stock return predictability depended on the temporal aggregation of news. Sentiment of news over a day has predictability only a few days, while the sentiment of news over a week lasts the predictability for up to a quarter. In addition, positive news causes stock returns to rise quickly, while negative news affects stock returns with a long-delayed reaction. Bollen et al. [5] studied the relationship between Dow Jones Industrial Average (DJIA) and public mood measured by quantifying twitter data using OpinionFinder. Google-Profile of Mood States (GPOMS) measured public mood in terms of six dimensions: calm, alert, sure, vital, kind, and happy. The correlation between public mood and DJIA was analyzed by Granger causality analysis, and it was observed that “Calm” mood was the most significant feature. The self-organizing fuzzy NN method predicted a daily up and down change of DJIA closing-values and obtained 86.7% accuracy and a 6% decrease in mean average percentage error (MAPE). Lee et al. [25] reported that the performance of stock price prediction improved when using linguistic features of financial reports rather than the existing analysis using quantitative indicators such as earning surprise, recent movement, volatility, and event category for S&P 1500 companies. The unigram features, extracted from documents, were expressed using non-negative matrix factorization (NMF) and used as input variables. For three classification problem through RF, the model with quantitative indicators was used as a baseline with 50.1% accuracy, on the other hand, when linguistic factors were added, the prediction accuracy was 55.5% and improved by more than 10% over baseline performance. Sun et al. [42] explored the effect of text information from user-generated microblogs on the market. On a financial communications platform called StockTwits
As many studies have confirmed that the performance of stock price prediction was improved by using text data rather than numerical data only. Therefore, various algorithms have been developed and applied to better represent text data to improve the prediction performance.
Maas et al. [27] proposed a method to capture sentiment and semantic term-document information by combining unsupervised and supervised techniques to overcome the problem of not capturing sentiment information when representing documents. In order to capture semantic similarities, they constructed a probability model of a document that uses a continuous mixed distribution of words,
Previous work, however, never attempted to combine distributed representation and visualization for the sake of assisting agents the industry-side. The model of this study is designed to do exactly that, by exploiting distributed representation of documents to improve predictability, while providing easy-to-understand summary of the result via visualization, which, altogether, may help guide the decision making process of financial agents in the field.
This study predicts stock price movements in two ways: model-based and visualization-based. The framework of our methodology is shown in Fig. 3.
Diagram of stock price change prediction.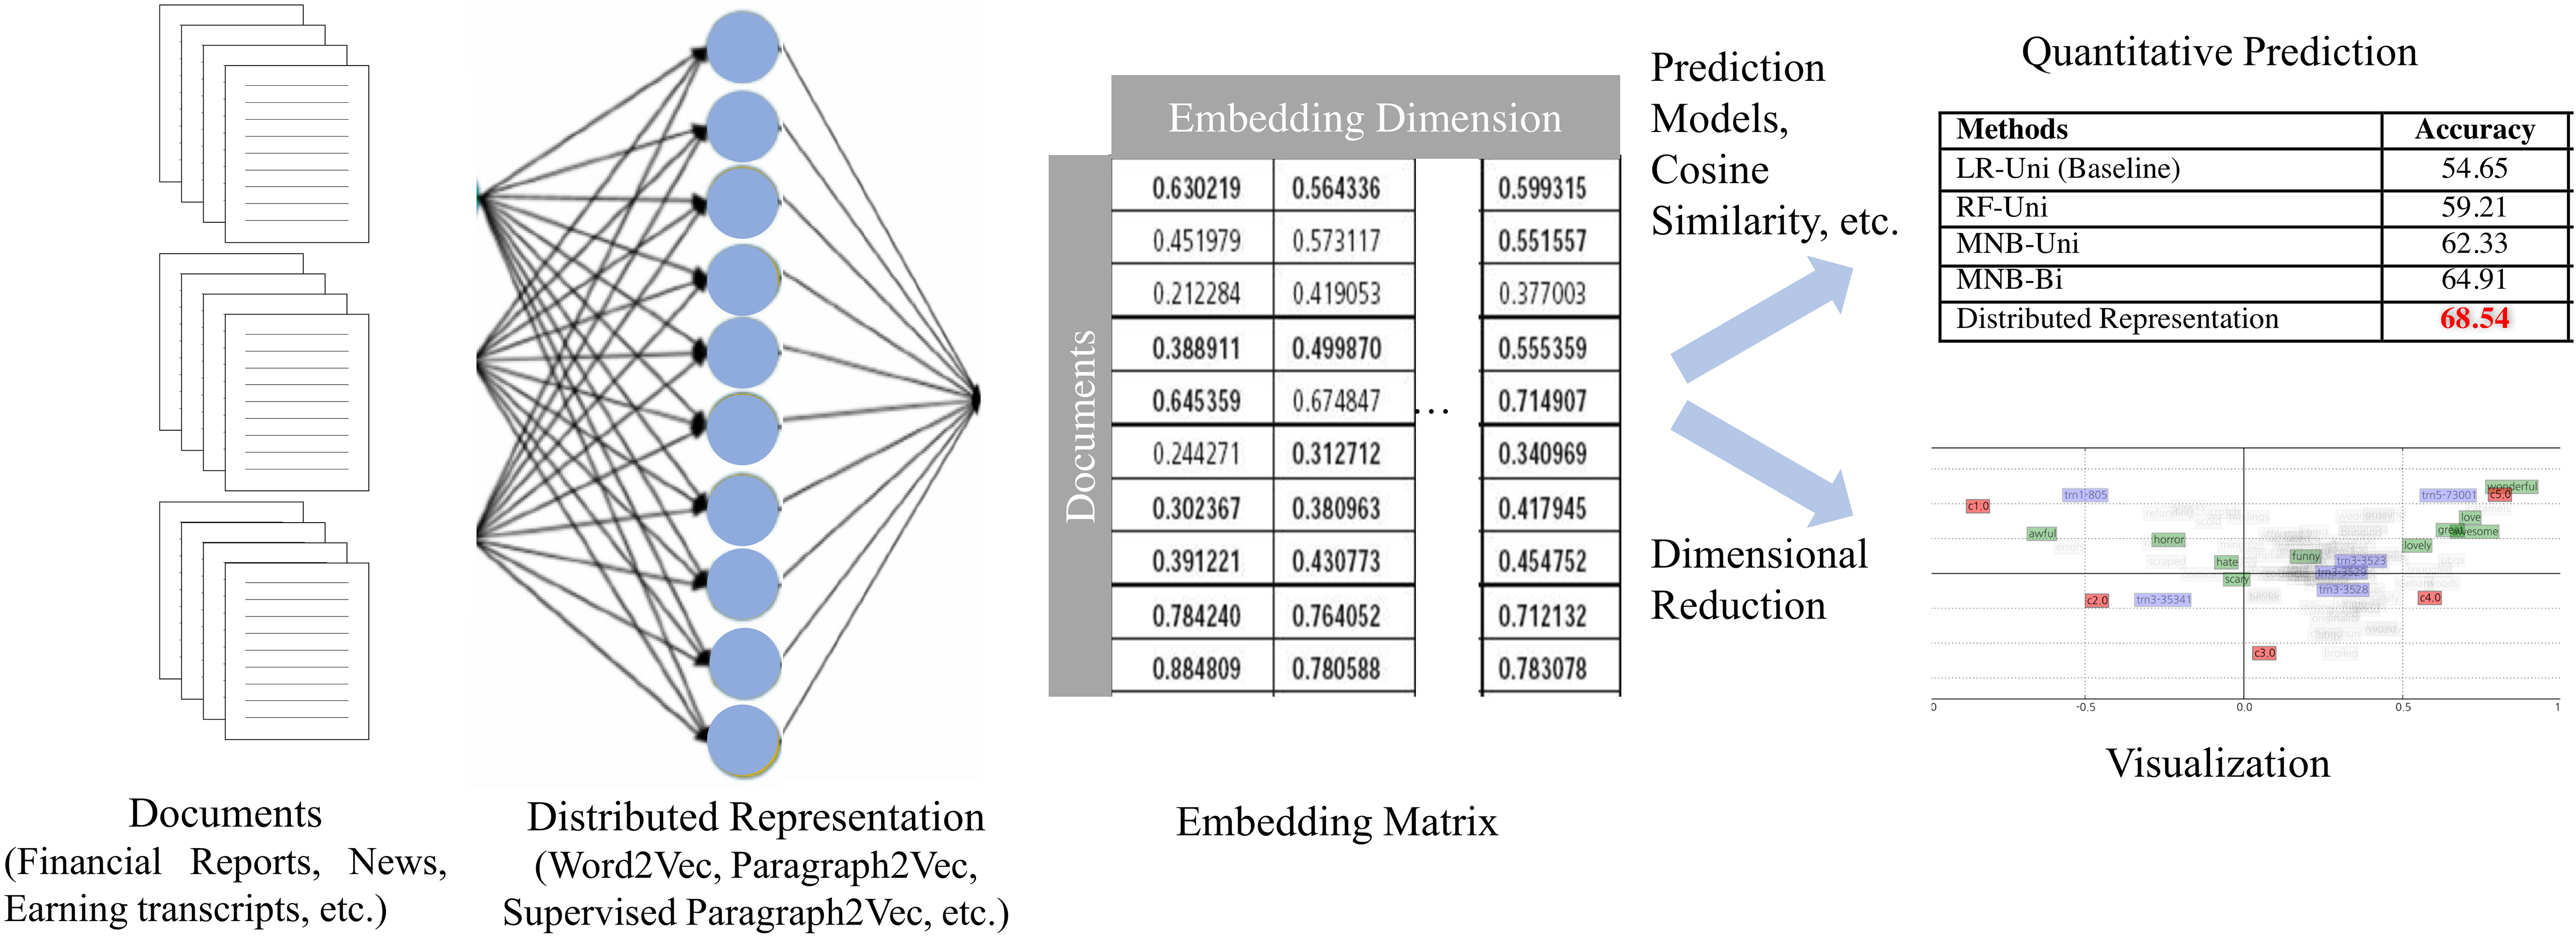
Model-based analysis calculates the sentiment of 8-K financial reports via distributed representation method [35] to predict stock price changes, while the visualization-based analysis provide qualitative assessment of the prediction results.
In order to form the stock price prediction problem into a classification model with text as input, it is important to appropriately and clearly represent documents for the task in hand. The most basic way to represent documents is through a bag-of-words (BoW) approach. BoW model considers a document as a bag of its words, disregarding grammar and word order. The biggest shortcoming of BoW model is that as the number of words increases, the dimension of the one-hot representations explodes astronomically. Distributed representation addresses such a limitation by projecting input data onto a continuous space of a smaller dimension [37]. The similarity between words and documents can easily be calculated, because each document is projected on to the same, continuous embedding space. The resulting representation then can be used in various ways, from extracting words that are “closer” to a given word to clustering similar documents. Moreover, it has been reported that performance, to some extent, is guaranteed even when working with a small dataset. In this study, we employ word2vec [30] to obtain distributed representations of documents. Word2vec is a simple NN model that embeds words onto a continuous embedding space, and it has become the most widely used word embedding model by reducing the computational time and enabling learning several times faster than, for instance, calculating a sparse matrix as required by the conventional BoW method. One interesting feature of word2vec is that linguistic regularities can be applied to the representation vectors. For example, one may express Rome as a combination of Paris, France, and Italy in the following way: v(“Rome”)
Skip-gram model is reportedly suitable for learning distances in discrete data that is difficult to define similarity. It represents textual data as a continuous vector, with which words within similar contexts are placed close to each other on the same embedding space. Figure 4 shows the structure of the skip-gram model.
The structure of the Skip-gram model[30].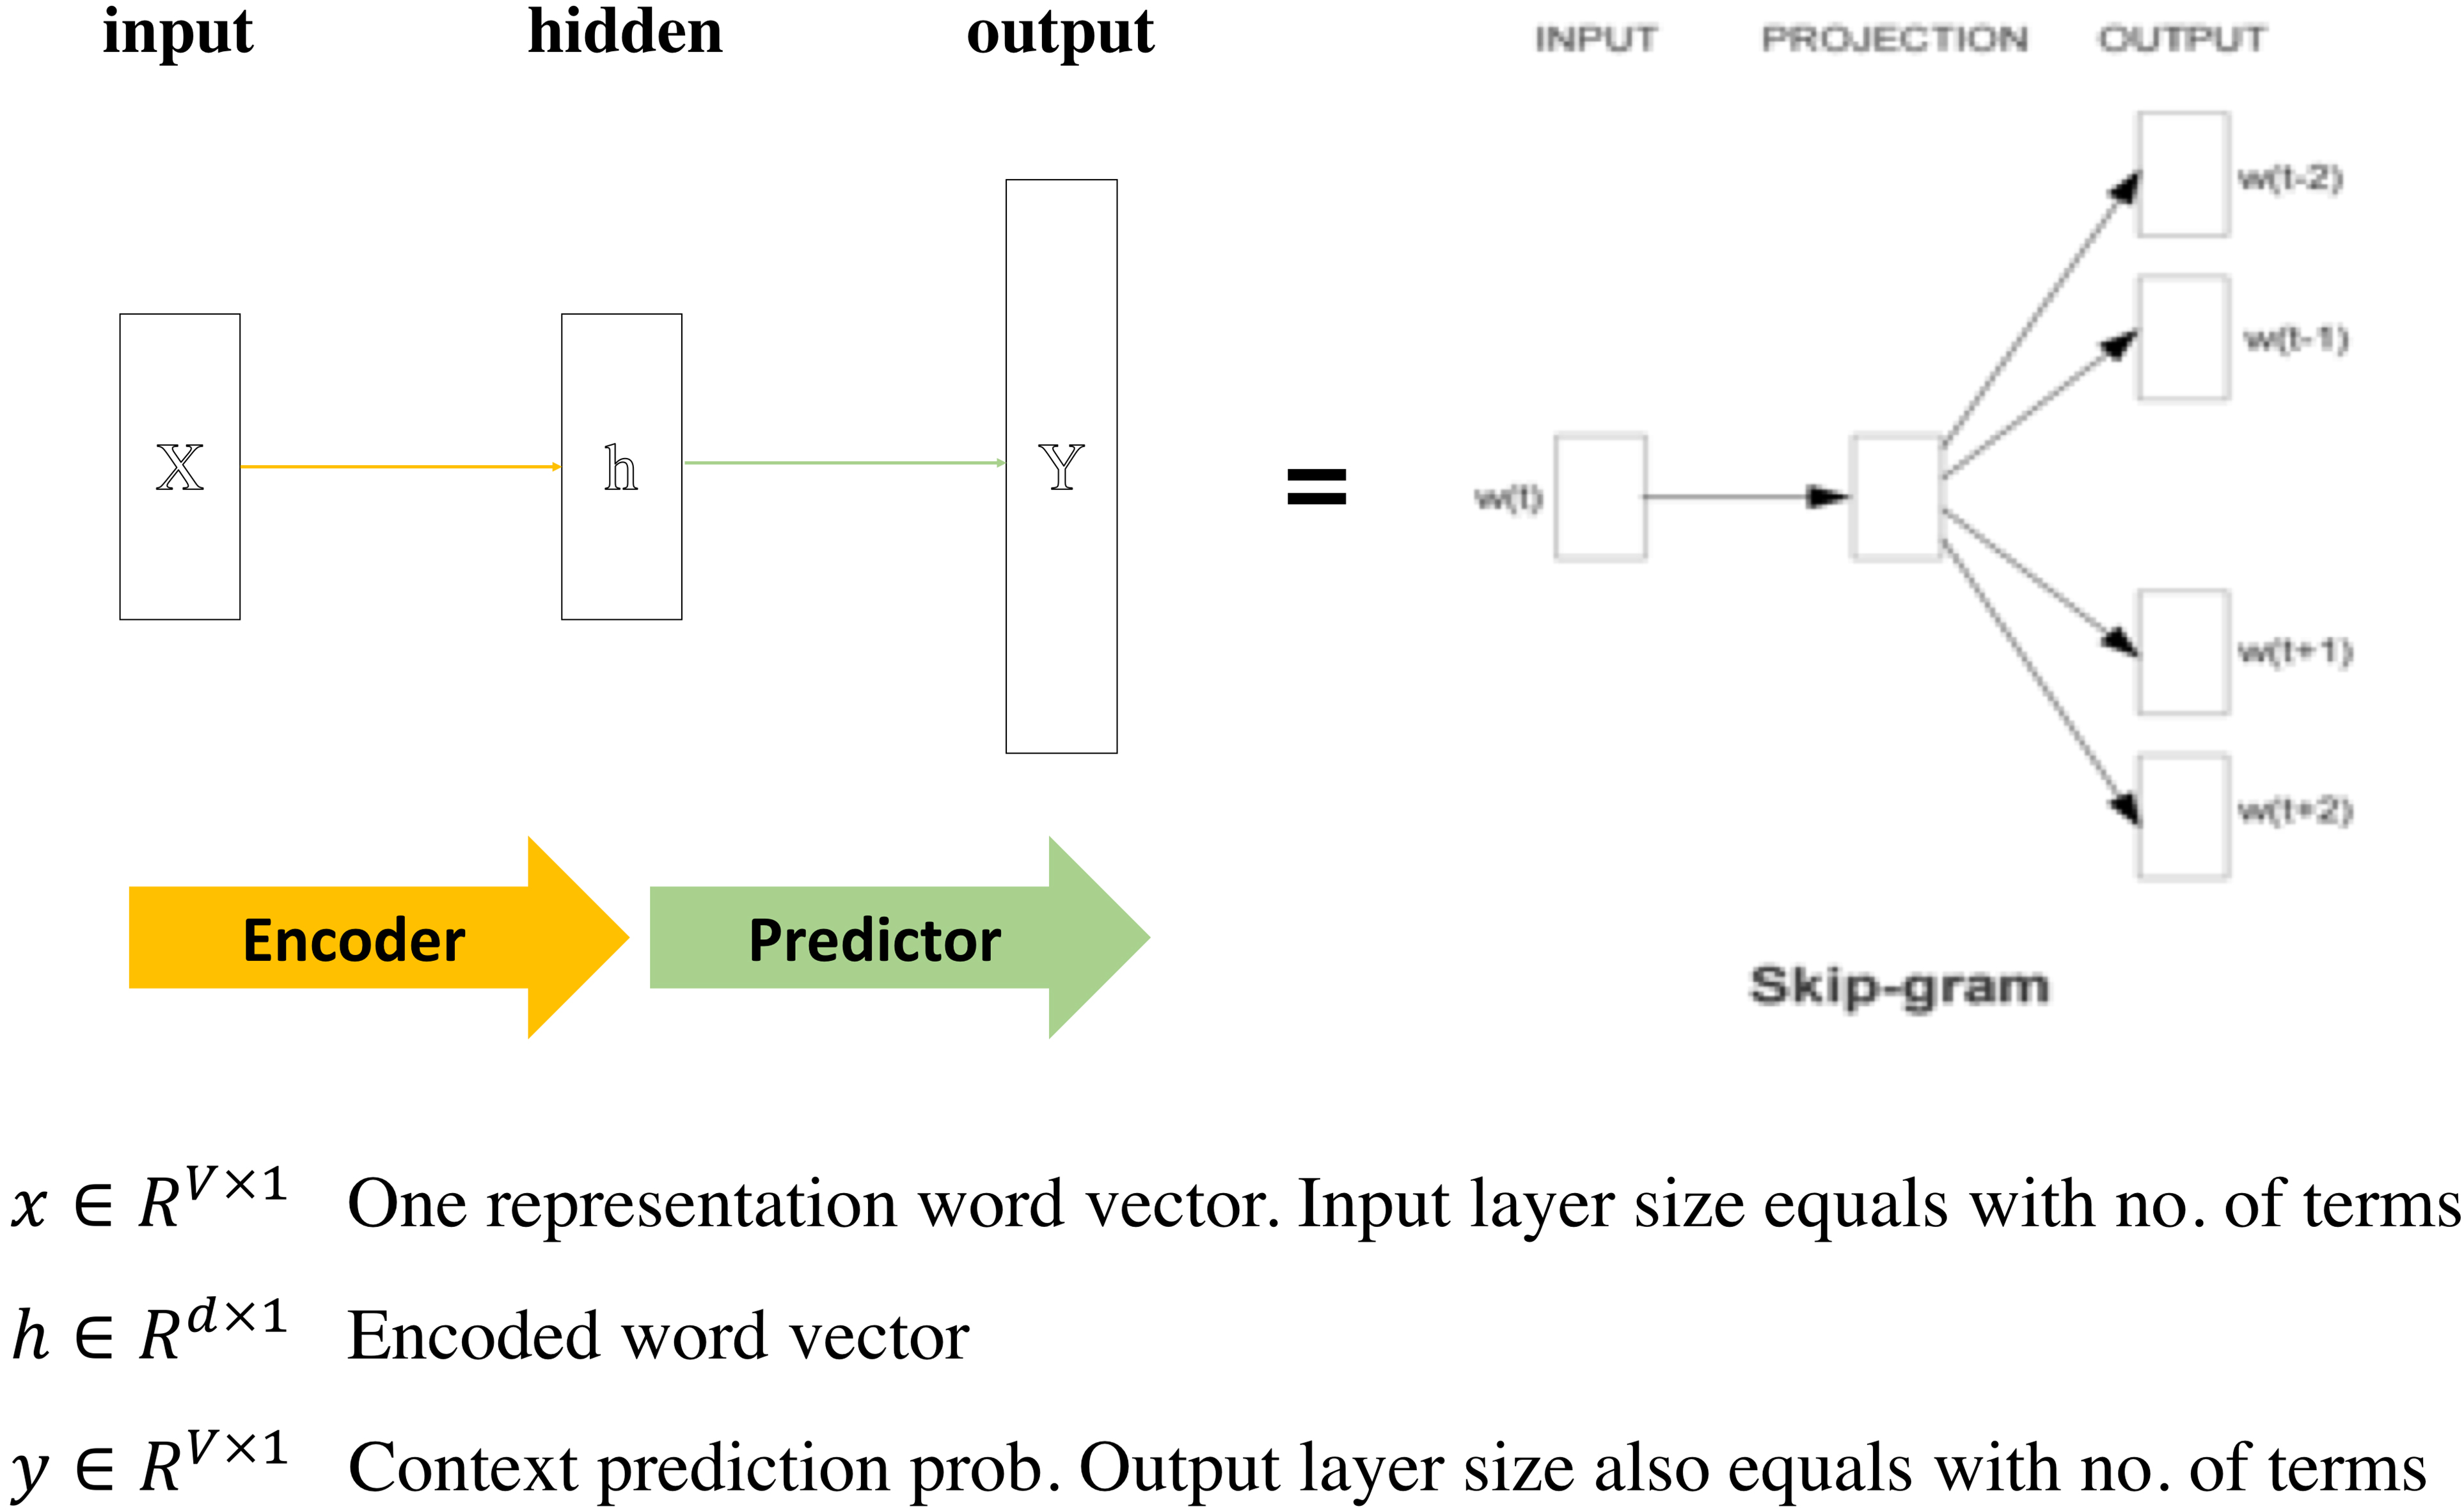
Skip-gram utilizes a NN, which consists of an encoder and a predictor. The encoder converts the input words, coded discretely, into a continuous vector; the predictor, then, uses the resulting vector from the encoder to predicts context words. Mathematically, given training words
where
where
Distributed model using paragraph vectors [24].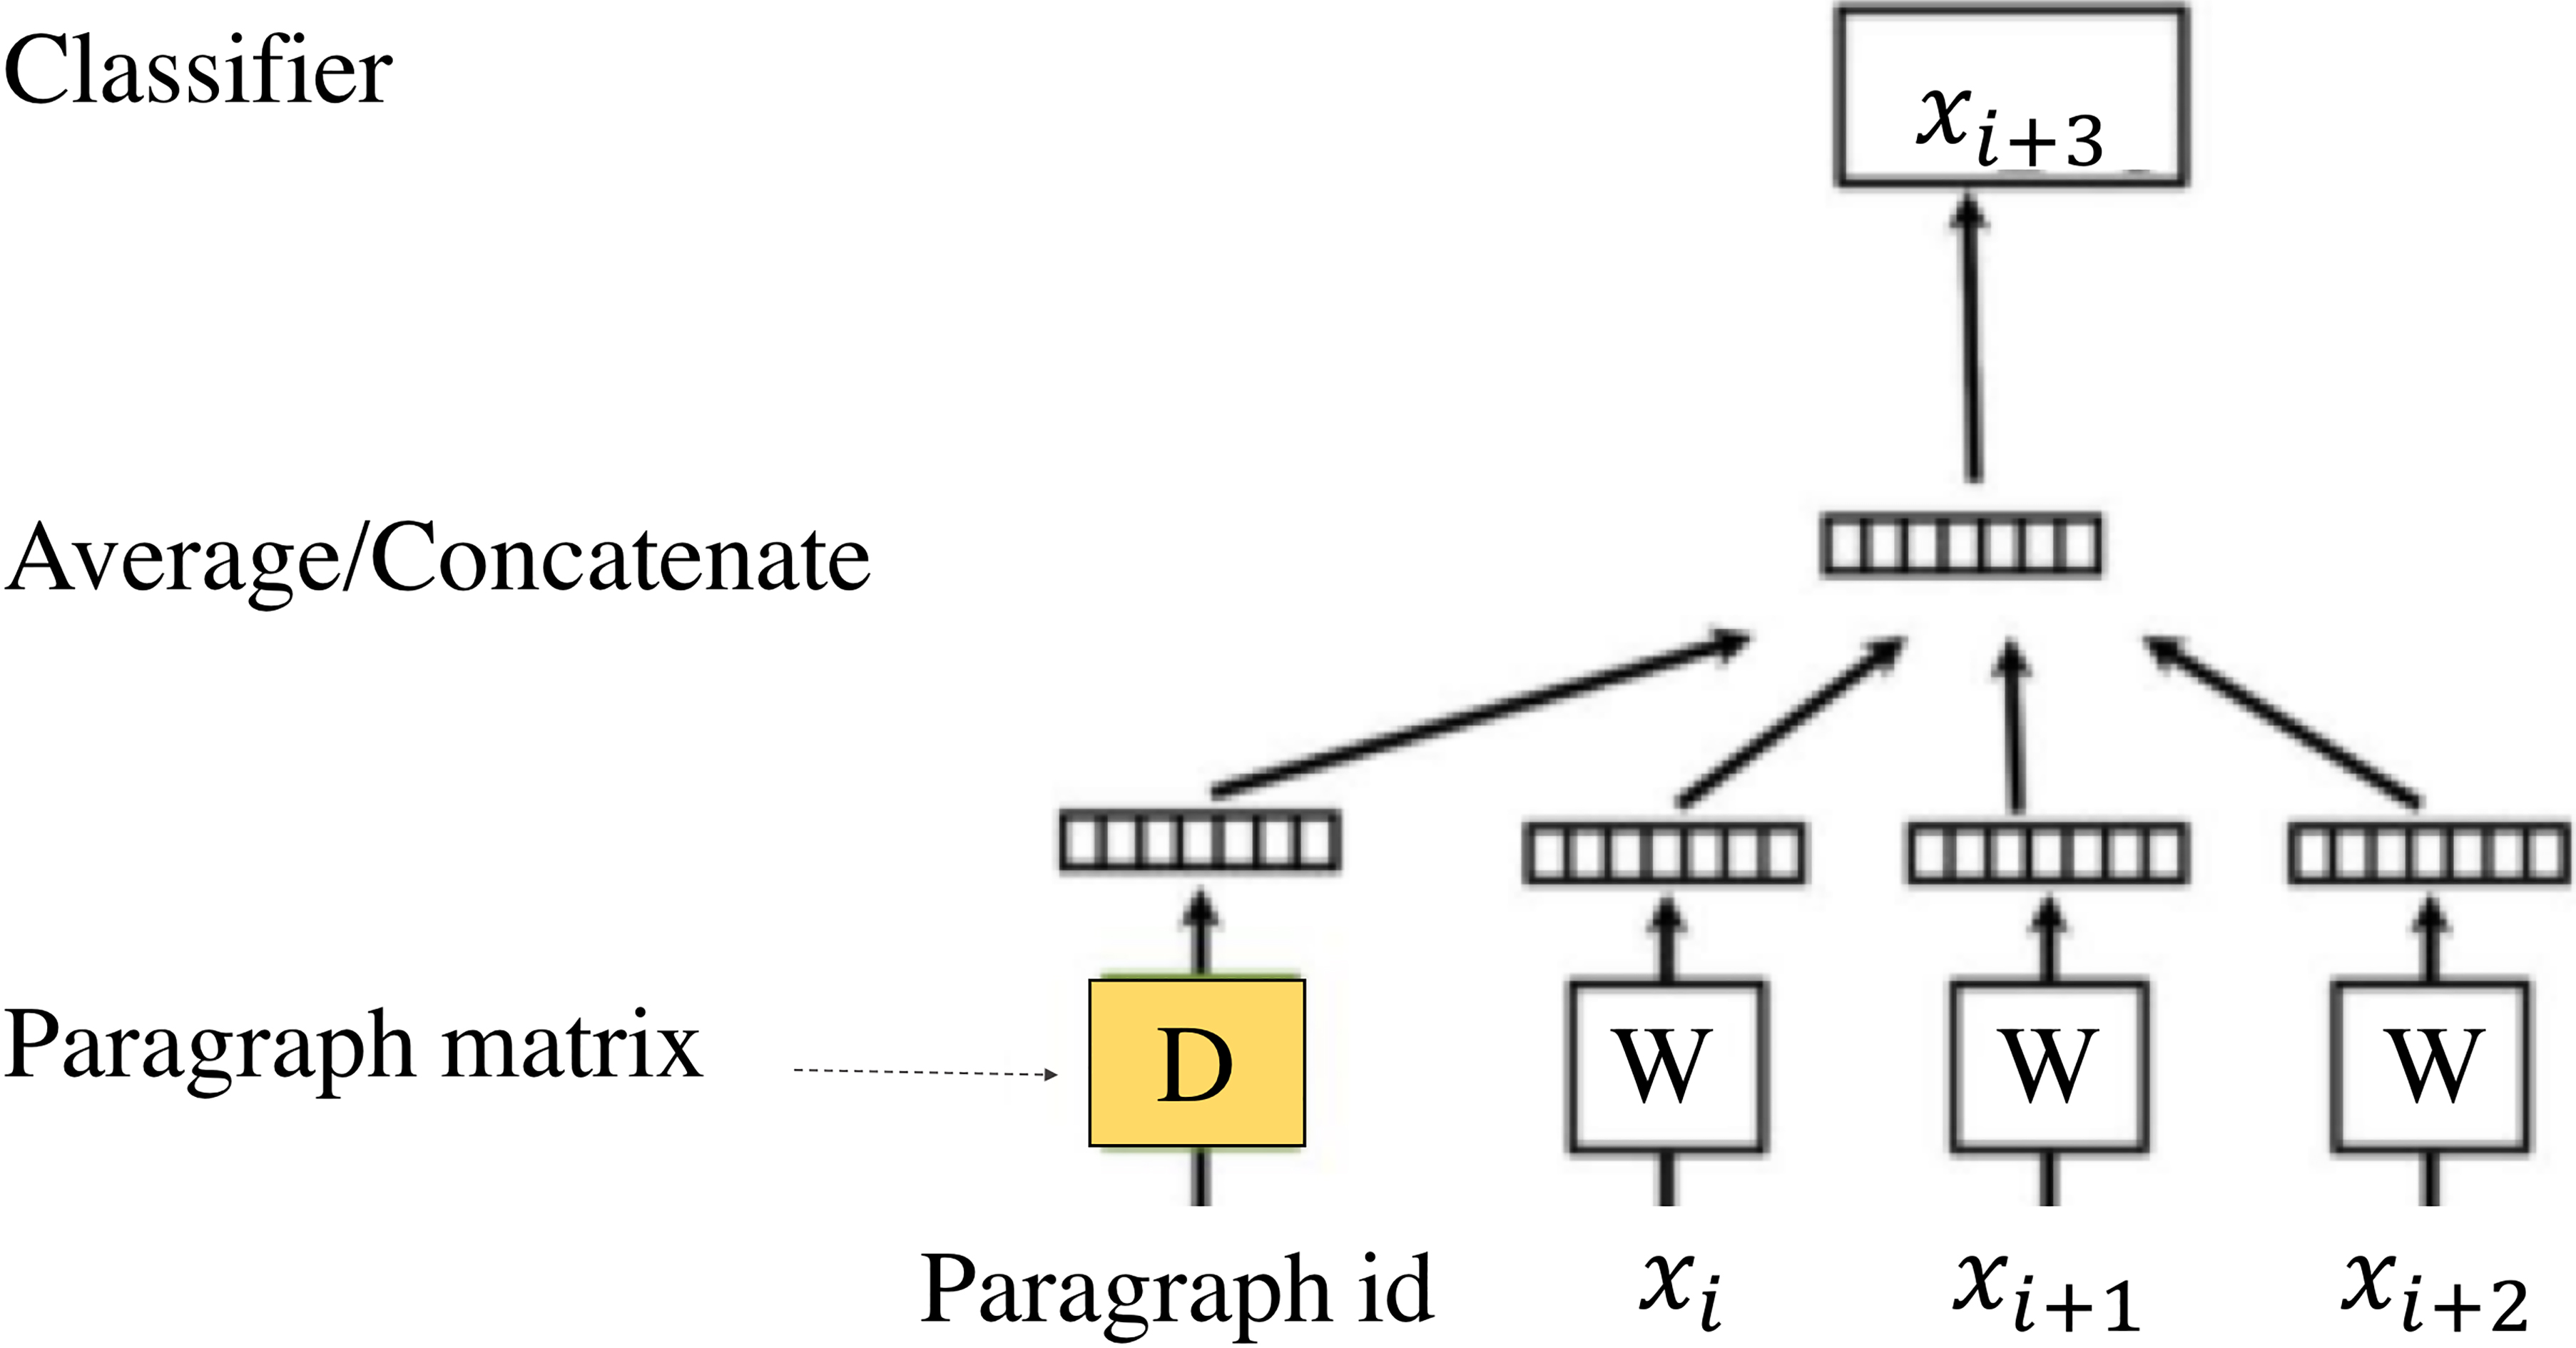
In the Fig. 5,
On top of the PV vector, we enrich the model by adding the class vectors when learning the document. This is because PV model, without the class vector, may produce results that may not be suitable for sentiment analysis of financial documents. Since word2vec slides through the input text word-by-word, when the set of context words are similar, the target words will end up being placed very closely to each other on the embedding space even if they may convey very different sentiments. For example, suppose there are two documents evaluating the operational performance of two different firms, Firm A and Firm B, namely. Document 1 evaluates Firm A well by stating: “
Class information is the sentiment labeling of documents using the direction of the closing price movement of the next business day. Each document is assigned one of the two labels (“UP” and “DOWN”) as its class depending on the stock price shift the next business day. “UP” means that the price went up more than criterion, while “DOWN” means that prices went down more than criterion. Because stock price movements are already known at the time of learning, we design our model as supervised learning. The main difference of Supervised PV (SPV) models and PV models is that the class label information of documents is added on to the input vector at the time of training. The objective function of SPV models is defined as:
where
In this study, we visualize the result of sentiment analysis via distributed representation. By expressing a document with a distributed representation, words, sentences, documents and class information in the text document can be represented by the vectors of same dimension. It is, however, very difficult to visualize vectors with large dimensions. There exists a number of dimensionality reduction techniques for visualization purposes, such as LDA, t-Distributed Stochastic Neighbor Embedding (t-SNE), and Principal Component Analysis (PCA). LDA calculates a linear combination of variables to categorize them into two or more groups, and its performance is reported to be fairly good. However, because it is a supervised method, and its applications are limited [16]. t-SNE is one of the newer methods, which reduces dimension by maintaining the relative distance between observations based on the non-linear relationship in between. Nonetheless, it is a non-linear method, hence it takes a long time to compute [28]. PCA, which is similar to LDA but unsupervised, is a multivariate technique that analyzes data in which observations are described by several inter-correlated dependent variables. PCA extracts important information from the data in the form of orthogonal variables called principal components [1]. PCA has a mathematical relationship to other popular machine learning methods such as
Example of visualization[35].
In the above figure, we represent class information, namely ‘c1.0’, ‘c2.0’,
The framework of model-based prediction is outlined in Fig. 7.
The framework of model-based prediction.
An input document is parsed to extract unigram and bigram features, and the document term matrix is created using the term frequency (TF) and term frequency-inverse document frequency (TFIDF). We use six prediction models: logistic regression (LR), random forest (RF), multinomial Naïve Bayes (MNB), support vector machine (SVM), Naïve Bayes SVM (NBSVM), and supervised PV (SPV) as introduced in Section 3.1. LR and RF serve as baseline models, and they use unigram features only as input variables. A detailed description of each algorithm is given in Section 3.3.1 through 3.3.5.
RF, an ensemble learning method for classification and prediction, is a combination of a number of decision trees or regression trees. Given a training set
where
LR is widely used when the output variable is a categorical variable. The probability of response can be estimated through logistic function [10, 45]. The logarithm of the odds ratio,
where
The resulting probability
MNB is a classification model that uses conditional probability of belonging to a class, assuming that each variable is independent [36]. Given data
where, the denominator is a constant value, regardless of the class, which is calculated only from the observed data. Since each variable is independent, a probability model can be expressed using only the numerator:
We can now define the class of each variable that maximizes the Eq. (8) as follow:
Because MNB assumes that all variables are independent of each other, it can lead to inaccurate results depending on the data set. However, it is possible to estimate the distribution of a class as a one-dimensional distribution, so the model has good performance and exhibits fast speed even with large datasets.
SVM is a supervised learning model, which constructs a hyperplane in a high dimensional space for classification, regression, or other tasks. The hyperplane,
Support vector machine.
We search for a decision boundary (shown in the solid line in Fig. 8) and the ones closest to the boundary are called the support vectors. The distance between these support vectors and the decision boundary is
We classify the data using a discriminant function,
NBSVM is very similar to SVM, except that we use transformed input variables
where
where
Data
We use the 8-K financial reports2
Company lists
Preprocessing included removing stopwords and changing all numbers in various meaning to the word ‘num’. We gather company’s daily stock prices from Yahoo! Finance3
where
We set the parameters the same as used by [46] for direct comparison of results to his work. The full list of parameters for each algorithm are reported in Table 2.
Parameters
Parameters
Tradeoff indicates the tradeoff between the training errors and the model complexity;
Based on the assumption that the day after the announcement of a financial report will have the greatest impact on the company’s stock price, we applied all algorithms mentioned in Section 3.3. The results are shown in Table 3.
Prediction accuracy
Prediction accuracy
We used two types of input variables extracted from unigram and bigram models and set the output variable as the stock price change after 1 day of the announcement. ‘Uni’ and ‘Bi’ are abbreviations of the input variable used in the prediction models with the unigram or bigram features, respectively. Using unigram features as input variables, results show that RF performs better than LR. SVM outperforms MNB, and NBSVM has been found to improve SVM results. Models with bigram features tend to perform better in general when compared to those using unigram features. In case of the SPV-model, the improvement over the LR baseline amounts to 25.4%. In order to compare the performance of prediction models, we conducted an independent 2-sample t-test assuming unknown standard deviation. The test was run 28 times for 28 pairs of combination among 8 different models. A null hypothesis,
Unlike other areas, documents in financial markets are not independent of each other and affect stock prices for a certain period of time. Based on this property, we visualize the sentiment of 8-K report over time and confirmed that the relationship between the sentiments and the stock price movements makes sense. The sentiment of the published documents and the stock prices of Wells Fargo Company from 2008 to 2009 is shown in Fig. 9. During this time period, stock prices of Wells Fargo were volatile due to financial crisis. Documents from the same time period were split every two months due to the limit number of documents.
Sentiment of 8-K reports and stock price for Wells Fargo Company.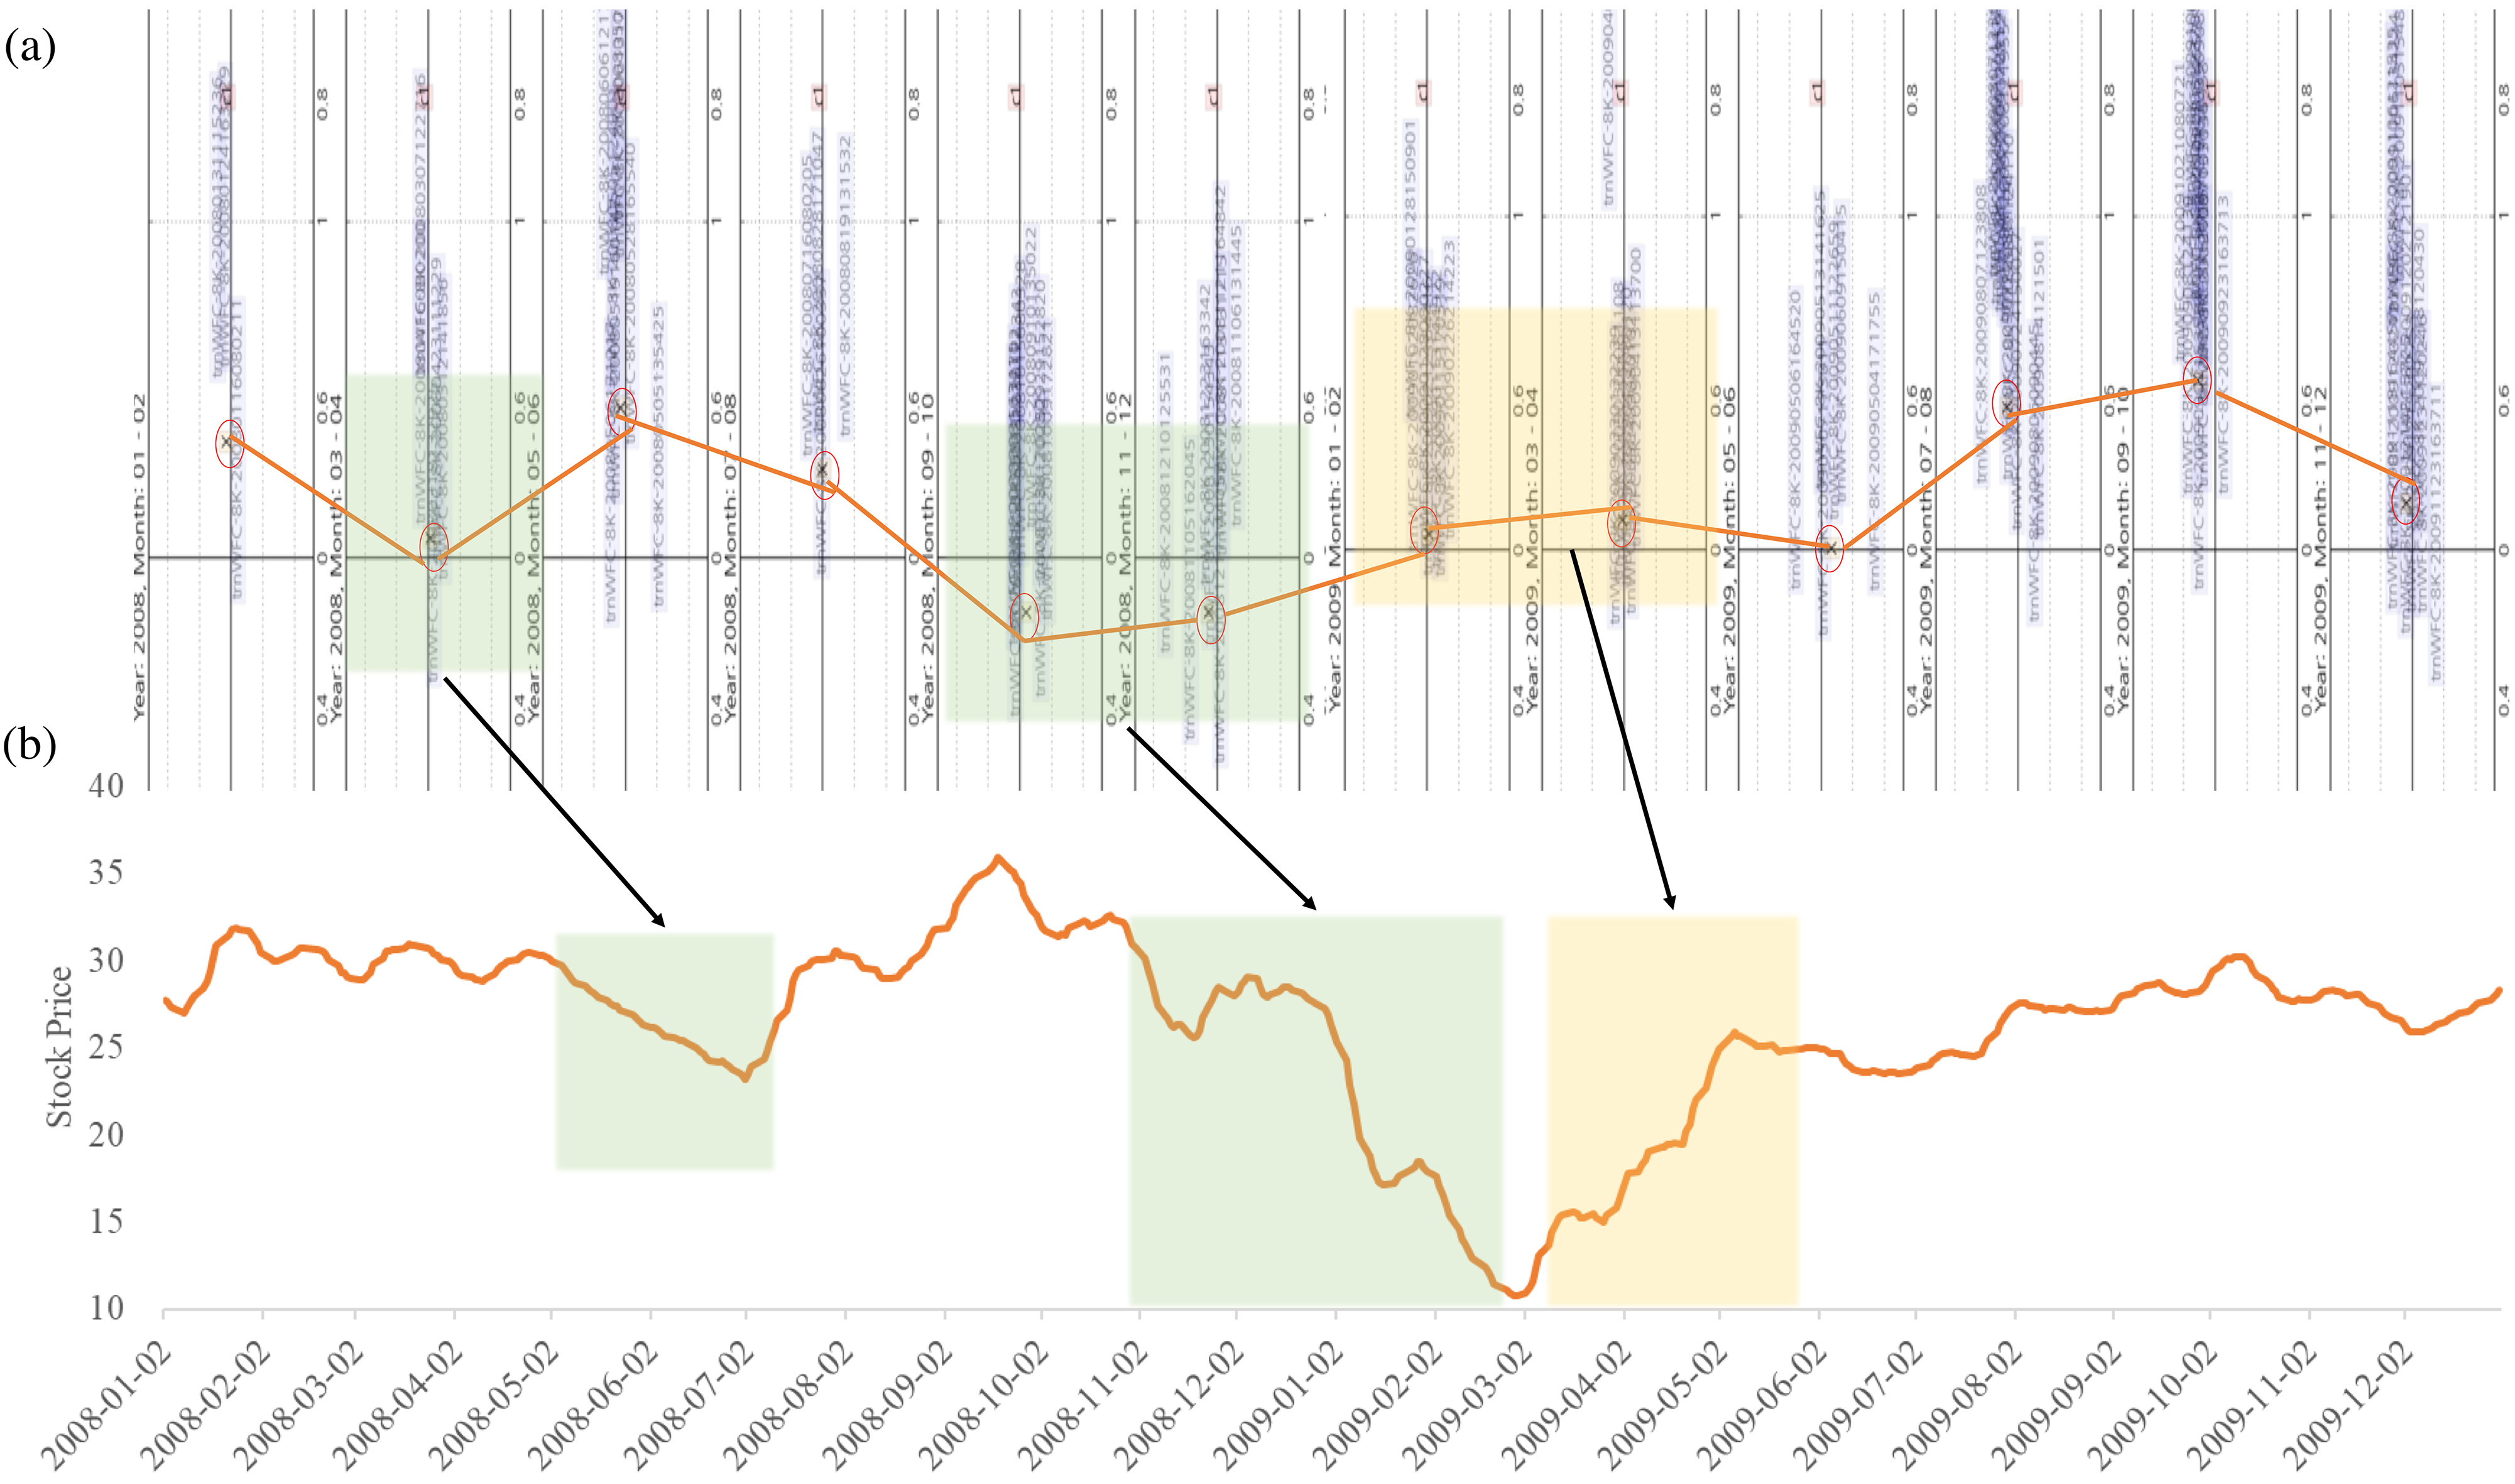
Panel (a) of Fig. 9 exhibits a graph representing the sentiment of documents every two months, whereas (b) plots the 10-day moving average of the stock prices. As the sentiment of documents changes, stock price moves accordingly to the sentiment trend. For example, in panel (a), the sentiment of the document in March-April 2008 grew relatively more negative, which is reflected in the stock price is affected from the end of April, 2008 where it fell moderately steeply, as plotted in panel (b). In addition, the sentiment of the documents from October 2008 to February 2009 is negative, and it can be seen that the stock price has been steadily decreasing since December 2008. Above illustration shows that the sentiment of the documents is closely related to the stock price and that, since the direction of the stock price appears after the document announcement, the sentiment of documents can be used as the leading indicator. Furthermore, plots like Fig. 9 can serve as qualitative evaluation of the model, providing the practitioners with more interpretable insights.
We plot the sentiment trend of documents over time for the four selected companies as listed in Table 1. Furthermore, we compare the sentiment trend of entire documents with stock price movements side-by-side for each selected company from 2002 to 2012. The resulting visualization is shown in Fig. 10.
The sentiment of entire documents (left) and stock price trend (right) for each company.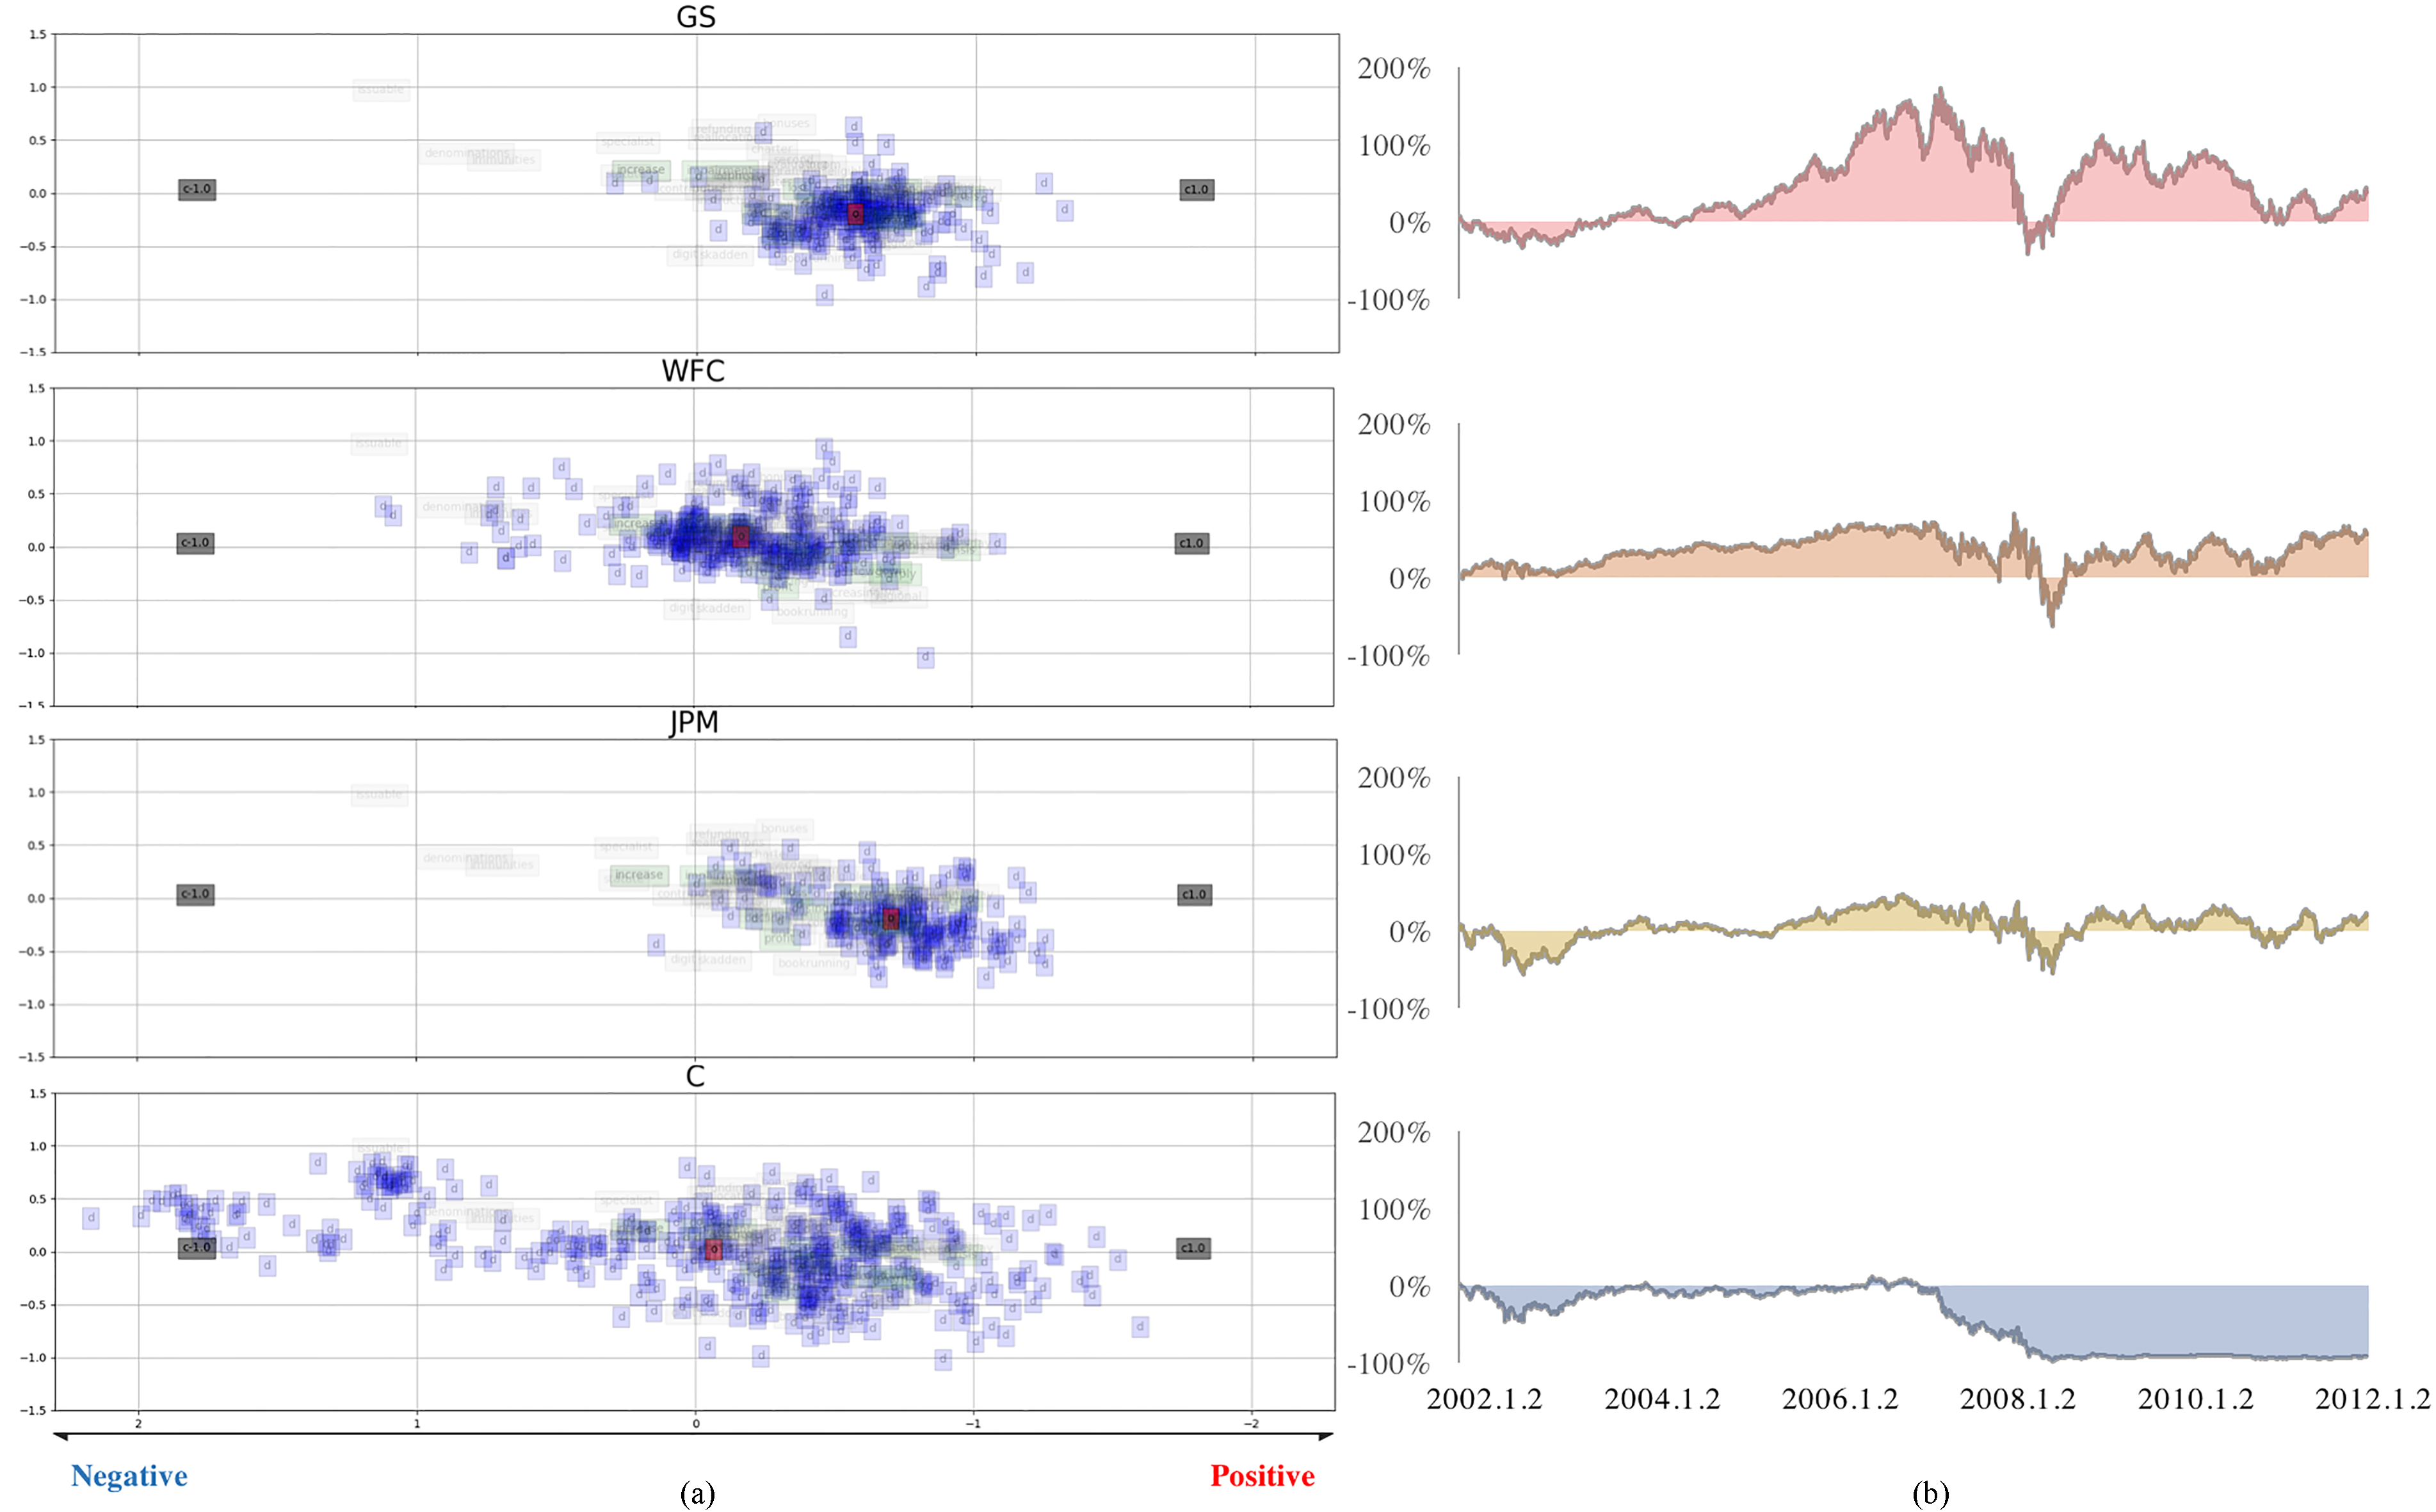
Panel (a) of Fig. 10 exhibits a graph representing the sentiment of documents belonging to each company as considered in analysis. The more to the right the documents are distributed, the more positive the document is. The center of the documents in space is represented by a red dot. Plots in the panel (b) represent the volatility in stock prices when compared to the first business day in 2002. For example, if the y-value is 30%, it means that the stock price rose 30% compared to the first business day in 2002. As shown in the lots on panel (a) of the figure, the sentiment trend is different for each company. There is a handful of documents with neutral or positive sentiments for Goldman Sachs, Wells Fargo and Company, and JP Morgan, while many documents of Citigroup Inc. exhibit relatively negative sentiment. In the meantime, Goldman Sachs shows the steepest positive volatility of stock price as presented in panel (b), while and Citigroup displays negative volatility. Observations from Fig. 10 indicate that Citigroup had a number of issues that had greatly reduced stock prices since 2002, and these issues appeared to have been associated with negative sentiment conveyed by the financial reports. We represent the negative index of sentiment and volatility of stock price as shown in Fig. 11.
Correlation between negative sentiment index and negative stock price index.
In the above graph, x-axis is the negative sentiment index and y-axis is the negative stock price index. Both indices are calculated as follows:
where
where
This study predicts the direction of stock price changes using 8-K financial reports for the four selected companies in the financial sector. We propose two methods to solve the prediction task: the model-based method and the visualization-based method. For the model-based stock price prediction, unigram features were extracted from financial reports and applied to the LR and RF models, and the results were used as baselines. The same unigram and bigram features were applied to MNB, SVM, and NBSVM models for comparison. Finally, we predicted stock price change using distributed representations. Experiment results show that distributed representation produced the most accurate predictions and the improvement in prediction accuracy over the baseline model amounts to an impressive 24.5%. For the visualized-based method, we visualize the sentiment of the document by projected the class information and the document on to the space of the same dimension. The benefits of this visualization helps one easily understand the sentiment changes in financial documents of a select company, while providing rich illustration of the relationship between sentiment trends and stock price trend movements. Visualization results confirmed that when the sentiment of documents was positive, the stock price movement showed an upward trend. On the other hand, when the sentiment of the document was negative, the stock price fell. The mean values of sentiment were calculated to create a sentiment index for the entire document. Visualization results showed that different sentiment trends of documents for selected companies were well reflected in the stock price movements of the corresponding companies. For GS firms, the sentiment of the entire documents was positive, of which the trend was consistent with the stock price moving mostly in the positive direction. On the other hand, in the case of company C, there were many documents with negative sentiment, and the stock price had continuously decreased since 2002.
Our proposed model does not only improve accuracy, but it also provides interpretability by producing visualizations that can show the sentiment trends of associated documents. It allows a trader to visualize the sentiment of documents of the company of interest, to view the trend of the sentiment at a glance, which help the active traders and decision-making agents in the field to make more data-informed decisions. In the financial market, traders are often required to make split-second decisions, and our proposed model can potentially provide them with opportunities to monitor new investment companies objectively and detect companies at crisis.
In this study, we analyze only a few companies in the finance sector, but in the future, we expect to gain more insights by analyzing a wider range of companies. In addition, by analyzing public documents and private document such as SNS and online blogs through distributed representation, it may be possible to extract sentiment words that are specific to the financial sector using our method to build the sentiment dictionary specifically designed for the financial domain. Finally, since visualizing the sentiment of documents is a powerful tool, research is needed on more effective visualization tools.
Footnotes
Acknowledgments
This work was supported by the BK21 Plus Program (Center for Sustainable and Innovative Industrial Systems, Department of Industrial Engineering, Seoul National University) funded by the Ministry of Education, Korea (No. 21A20130012638), the National Research Foundation (NRF) grant funded by the Korea government (MSIP) (No. 2011-0030814), and the Institute for Industrial Systems Innovation of SNU.