Feature selection is a common solution to microarray analysis. Previous approaches either select features based on classical statistical tests that can be tuned up with a classifier, or using regularization penalties incorporated in the cost function. Here we propose to use a feature ranking and weighting scheme instead, which combines statistical techniques with a weighted -NN classifier using a modified forward selection procedure.
We demonstrate that classification accuracy of our proposal outperforms existing methods on a range of public microarray gene expression datasets. The proposed method is also compared to state-of-the-art feature selection algorithms by means of the Friedman test.
Although a bunch of feature selection techniques has been used for genomic data, the experimental results show the classification superiority of our method on most of the present gene expression datasets.
The wide use of gene expression technologies, such as microarrays, permits to screen thousands of genes over multiple observations. In general, a microarray is a high-dimensional structure consisting of few samples () with thousands of genes (). Gene expression information helps to monitor and measure relevant data to understand different biological information and facilitates the analysis in specific contexts such as cancer diagnosis or the classification of different tumor types [7, 18, 21]. Due to the nature of microarrays, some drawbacks in the use of classic machine learning and statistical algorithms for classification purposes have been identified. First, one of them relies on the poor classification performance in high-dimensional domains with few samples, referred to as , in which machine learning techniques do not have sufficient observations to perform a good classification or prediction. Secondly, datasets with thousands of features are more likely to have many correlated or irrelevant features (genes) yielding poor classification accuracy and high computational costs [36].
One possible solution to these issues is to use feature selection methods to perform data dimensionality reduction thus preserving uncorrelated genes with the most discriminative information. Feature selection (FS) techniques have been widely explored in the past decades [8, 30]. The main idea behind FS is to select a small subset of features from a larger set of variables without degenerating the classification performance [4, 27, 36]. According to the way they operate, feature selection techniques are grouped into three main categories: filter methods, wrapper methods, and embedded methods.
The filter methods remove correlated features before the classification step, typically by evaluating and selecting the most relevant features individually [34]. On the other hand, wrapper methods are tuned up with a classifier to evaluate the relevance of different subsets of features. The selected feature subset would be the one with the highest classification accuracy. As a benefit, wrappers tend to lead to better classification results [19, 28]. In embedded methods, the feature selection is a part of the model construction, where strongly correlated features tend to be in or out of the model altogether commonly by means of 1-norm penalization, also known as sparse discriminant analysis [9, 45, 59].
Evidently, it would be necessary to evaluate all possible feature subsets to guarantee the optimum classification accuracy; however, this would be an inefficient solution. To perform a trade-off between efficiency and effectiveness, some strategies have been developed, where feature ranking plays an important role to find the best features leading to competitive and close-to-optimum results [48, 57].
Several feature selection techniques have been used in the microarray data context. Some of them use genetic algorithms or meta-heuristics in order to perform the variable selection, as shown in [13, 29, 33, 41]. Other works combine different strategies, such as hybrid wrapper-filter methods [2, 23, 24, 31], an ensemble consisting of a variety of filters and classifiers [5], or a nearest neighbors wrapper-based ensemble [40], whereas some efforts are devoted to reducing the processing time, as in [49, 6] where authors propose a methodology to accelerate the evaluation of candidate features in a wrapper-based algorithm, and where a distributed filter approach to improve the running time is presented. Furthermore, a comprehensive study presented in [26] proves that statistical methods constitute a valuable feature ranking tool for gene selection in microarray data sets.
In this paper, an efficient feature selection method using a weighted nearest neighbor classification scheme is presented; this method uses a novel way to rank the feature relevance that is also used to obtain the weights for the Euclidean distance computation. Then, with the aim to select the genes with most discriminative information, a sequential search is carried out. A comparison with 5 state-of-the-art feature selection algorithms over 11 public microarray datasets was carried out in terms of the -measure and statistical significance by means of the Friedman test. Although a bunch of feature selection techniques has been used in genomic data, the experimental results show our method outperforms the previous work on most of the present gene expression datasets.
The rest of the paper is organized as follows: Section 2 presents the proposed feature selection algorithm; the feature ranking and weighting schemes, the forward selection algorithm and the weighted -NN procedure are also described. Section 3 is devoted to experimental results and discussion, where we present a comparative analysis of proposed feature selection method with feature selection algorithms in the literature. In addition, a multiple pairwise test over the Friedman test to provide a more precise comparison was carried out. The last section shows the conclusions of the present work.
Proposed feature selection algorithm
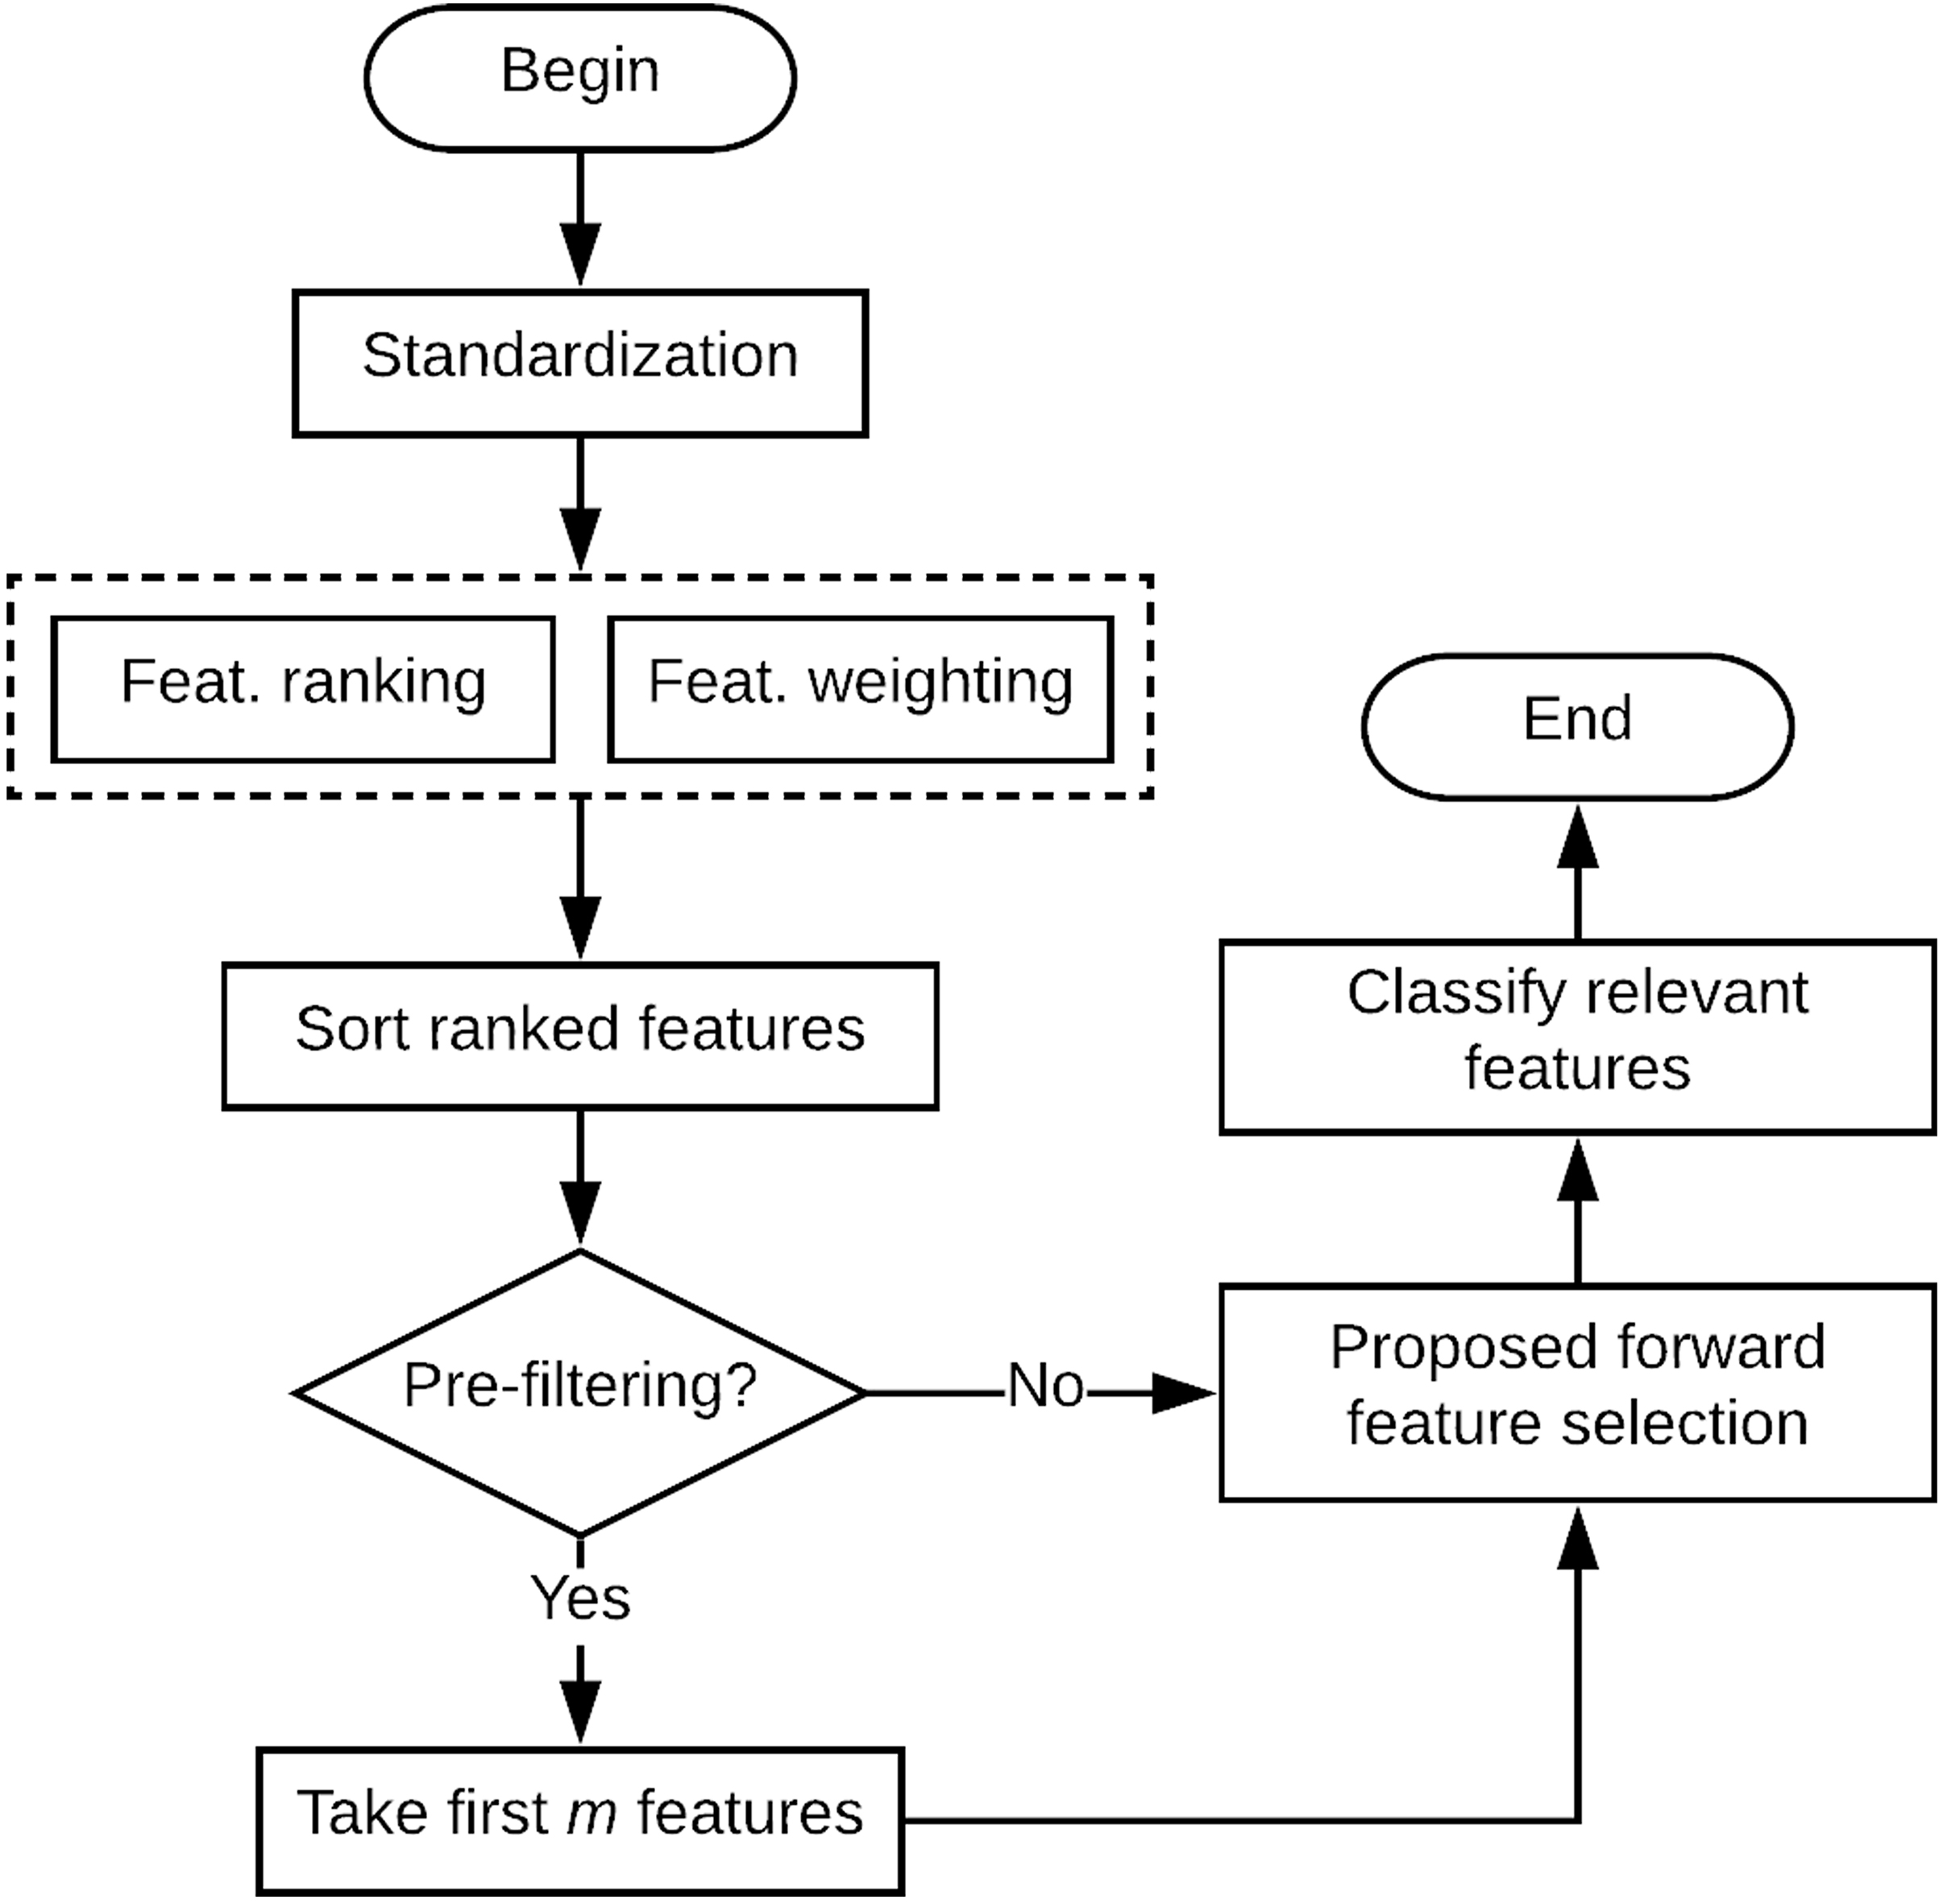
The aim of this section is to introduce the present proposal. As an initial condition, the dataset needs to be standardized, so each feature has zero mean and one standard deviation. The feature ranking and weighting are performed using the -NN classifier afterwards. If the user decides to take advantage of an early stopping condition, a pre-filtering step can be carried out by taking the first features from the feature-ranked dataset, otherwise, the algorithm takes all the features. As a final step, the proposed forward selection procedure is applied. A general view of the proposed method is illustrated in Fig. 1. The feature ranking and weighting, so as the forward selection method, are described in detail in following subsections.
Diagram of the proposed feature selection algorithm.
Feature ranking
Feature ranking, or variable ranking, is a common baseline step in several feature selection methods [19]. It helps to measure the relevance of each individual feature, in order to select variables providing an enhanced classification result. Commonly, a correlation criterion, a Shannon’s entropy-based mutual information, and classical statistical tests e.g., T-test, F-test, Chi-squared, among others, are used [20]. In this paper, a simple criterion for feature ranking is proposed, consisting of the evaluation of each feature based on the performance obtained by the -NN, measured on the training set, with that feature alone.
Let be a matrix of size with observations and features, and let be a -dimensional column vector containing the class of each observation in . The criterion used in this paper to rank the feature/genes is described as the feature-wise classification performance (FWC), which represents individual attribute evaluation using the -NN, as shown in the following equation:
where represents a function that evaluates each feature according to its ability to predict the value of the class variable , using the -NN classifier. Here, also will rank features from best to worse.
The incorporation of the function as a measure to estimate the relevance of each feature in the dataset constitutes a contribution to feature ranking methods. This property allows the reduction of the processing time while preserving the discriminatory ability of the classifier, as we will show in subsequent sections.
Feature weighting
One of the most important steps in this proposal is to compute the weights for each feature. The proposed method is a classification performance-based approach, in which the -NN classifier is executed having one feature at a time. The obtained classification performance is directly used as the feature weight, used to compute the Euclidean distance in order to predict the class of the corresponding sample. We observe that some methods use the classification performance to assess in the weights computation, however, none of these methods have used the classification performance as we propose in this paper. Commonly, performance methods parameterize a distance function with feature weights and use the performance feedback as a function to iteratively optimize these parameters [53]. In difference, we proposed a feature-wise classification weighting in such a way that the performance itself serves as the feature weight. The following equation describes the Feature-wise classification weighting: get the vector, computed as shown in Eq. (1) and map the values between 0 and 1, as follows:
Example: Let [58.6 48 88 87] be the feature-wise performance vector, the feature-wise weighting would be [0.586 0.48 0.88 0.87].
Note: Values for can be obtained by using different evaluation criteria, such as accuracy, area under roc curve, and so on. However, due to its capability to deal with class-imbalanced problems, authors adopt the -measure as the evaluation measure.
Weighted k-NN
The -nearest neighbor classifier (-NN) is a non-parametric classification algorithm, which constitutes one of the most representative instance-based classifier. Despite the algorithm was proposed in 1951 [15], it is still of contemporary relevance not only for a historical reason but also for its ease to implement and classification effectiveness. This is evidenced by a range of up-to-date papers in the literature using the -NN. These contributions include modifications on the referred classifier [14, 39, 42, 58], and its use in different applications, such as computational linguistics and text mining [17, 46], classification in big data and large-scale datasets [12, 32], in biomedical engineering [1, 51, 54] and, of course, in microarray dataset classification [5, 6, 35, 40, 49, 56].
The nearest neighbor ( 1) decision rule consists of assigning an unclassified instance to the class of the nearest previously classified instances, having a probability of error bound as twice the Bayes minimum error probability [10]; how close an instance is to another is determined by a distance function. The Euclidean, Manhattan, and the Mahalanobis distances are among the most commonly used metrics. However, the distance election is not an easy task, there are some previous works presenting a comprehensive study to help in this issue [3, 47, 52]. In [3] the authors discuss that the election of most popular similarity measures is commonly justified empirically from a practical point of view. They suggest that discussion about the use of different cost functions is not concluded, and contrarily, they encourage researchers to continue with the experimentation in this “fascinating area”. Similarly, in the study presented in [52], different metrics depending on the decision of what kind of classifier is desirable are reported. For example, for a highly accurate classifier, multiple locally metrics are suggested; for a high-speed -NN classifier, low-rank distance metrics with ball-trees are recommended. Regarding what is reported in [47], they conclude that Euclidean distance should be best suitable for practical implementations and applications, and its use is recommended when we do not have further prior knowledge of data. Moreover, the main advantages of choosing the Mahalanobis distance over the Euclidean are reviewed. Nevertheless, in the microarray context, which is a high-dimensional problem (), the Mahalanobis metric may increase the data computations since the inverse of the covariance matrix is needed to calculate the distances between each pair of instances. According to what is said in previous analysis, we decide to choose the Euclidean distance as a similarity measure to perform a nearest neighbor classification. Furthermore, is not mandatory to know exactly the distance between two instances, but the order relationship among the nearest ones; for this reason, the square of the Euclidean distance is taken instead, reducing the computing of a squared root at each pair of observations.
On the other hand, it is well-known that some features are more informative to make a class prediction than others [19]. In consequence, a nearest neighbor rule implementing a feature-weighted Euclidean distance is used in this paper. Regardless the election to calculate the weights , the distance function can be obtained as expressed in Eq. (3).
In accordance to what is presented in previous sections, the feature ranking values are also used as the weights to construct the nearest neighbor classifier.
Stepwise forward selection using the 1-NN
Wrapper methods evaluate the relevance of feature subsets by using a classification algorithm. Clearly, in order to guarantee the best classification results, it would be necessary to evaluate all possible combinations of gene subsets, exponentially increasing the computational complexity. For this reason, wrapper methods are commonly underestimated as they seem to be brute force methods [19, 28]. The time complexity represents a big problem when processing datasets with thousands of features. Fortunately, efficient strategies such as greedy search seem to be suitable to alleviate this issue.
Stepwise forward selection (SFS) uses a greedy search method which starts with an empty subset and selects the first feature at iteration zero. The algorithm considers all the () remaining features at the th iteration, for . Then progressively incorporate one variable at a time, from these () features, and identify the subset that best performs in a selected classifier. That is, the overall evaluated subsets amount to a total of [25, 44].
In this study, we modify this procedure by evaluate every feature individually and rank them from best to worst, in such a manner that the first feature processed by forward selection should be the best one (regardless what the approach to rank them is), thus having next in the queue the best of the remaining variables. Regarding the proposed feature selection method, the first step consists of the computation of feature ranking and feature weighting , and the initialization of parameters such as best classification 0, and best subset . Afterwards, append the next best-ranked feature to the best subset and perform the nearest neighbor classification. If classification performance improves, then add the corresponding feature to the best subset and update the best classification performance. Otherwise, discard it. Repeat this procedure from the first to the last ranked features.
The main advantage of this approach is that space search is sized only by , where is the number of features in the dataset. Albeit this approach reduces the number of computations in comparison to conventional stepwise forward selection (SFS) scheme, it is possible to provide a more efficient procedure by means of an early stopping criterion. Commonly, this criterion stops the subset search if, at any given iteration, the predictive performance decreases by adding the next feature to the current best subset. Instead, we decided to include a pre-filtering stage as the stopping criterion, in order to contribute to algorithm’s flexibility. Algorithm 1 shows a pseudo-code of this method. Unlike exhaustive best subset selection or conventional forward selection which involved fitting 2 models and models, respectively, our proposal only fits models, with as worst case scenario (when stopping criterion is not used).
Algorithm 1. Proposed Forward Selection-based scheme for the Weighted Nearest Neighbor classification
Input: Microarray gene expression dataset
Output: A set of selected features/genes: BS
(1) Select the parameters to use with algorithm
(2) Initialize 0 and
(3) for 1 to
(4) aux_subset
(5) aux_class ( aux_subset,y)
(6) if ()
(7)
(8)
(9) end if
(10) end for
Experimental results and discussions
Throughout the experimental study, 11 gene expression microarray datasets with thousands of features, as described in Section 3.1, were used. In Section 3.2, the details about the algorithm implementation, so as the measures for evaluating the classification performance and for significance analysis are presented. Finally, the comparative analysis results and discussion are presented in Section 3.3.
Datasets
The experiments were conducted over 11 publicly available microarray gene expression datasets with a variety number of classes, and can be obtained from [60]. Summarized data information about the number of features, samples, classes, class distribution and also a brief description can be consulted in Table 1. In general, datasets used in this paper have a class distribution, comprising serious complications for most machine learning algorithms. This difficulty comes when classification algorithms tend to ignore the minority class at the learning stage. As a result, instances belonging to small or minority classes are commonly misclassified [43]. In order to give more insight into imbalanced data, let us assume an imbalanced two-class problem in which the main goal is to determine whether a person is healthy or have a rare disease. As a consequence, instances from the class representing the disease case are scarce (e.g. 5% of instances) in comparison to the healthy group (95%). Having this scenario, it is relatively simple for an algorithm to maximize the classification performance on the dataset, without performing any learning, by predicting each person to be healthy. For this reason, the accuracy, i.e. the percentage of correctly classified instances, is not a convenient measure to evaluate the classification performance, and another evaluation measure should be used.
Microarray cancer datasets. First group description
Dataset
Feat
Samples
Classes
Class distribution (in %)
Description
9 tumors
5,726
60
9
15/12/13/10/10/13/13/4/10
9 various human tumor types
11 tumors
12,533
174
11
16/5/15/13/7/6/4/15/3/8/8
11 various human tumor types
14 tumors
15,009
308
26
10/4/6/5/7/4/3/3/5/4/4/5/4/
14 various human tumor types
6/2/3/2/4/2/2/2/2/4/3/1/3
Braintumor 1
5,920
90
5
67/11/11/4/7
5 human brain tumor types
Braintumor 2
10,367
50
4
28/14/28/30
4 malignant glioma types
DLBCL
5,469
77
2
75/25
Diffuse large b and follicular lymphomas
Leukemia 1
5,327
72
3
53/13/34
AML, ALL B-cell, and ALL T-cell
Leukemia 2
11,225
72
3
39/33/28
AML, ALL, and MLL
Lung cancer
12,600
203
5
68/9/10/10/3
4 lung cancer types and normal tissue
Prostate tumor
10,509
102
2
49/51
Prostate tumor and normal tissue
SRBCT
2,308
83
4
35/30/13/22
Small round blue cell tumors
Experimental setup
The FWC feature selection algorithm was implemented using the libraries of the Waikato Environment for Knowledge Analysis (WEKA) (version 3.8) [22]. This software is written in Java and allows the integration of different components in the data mining field, such as pre-processing methods, classification algorithms, cross-validated schemes, visualization, filters, and so on. The parameters for the -NN classifier (named IB1 in WEKA) remain in the default values. To validate the effectiveness of the proposed FWC, we use the ten-fold cross-validation method performing the feature selection within each fold evaluating the F-measure only in the training set. The average results achieved by this procedure over 30 repeated runs on each dataset are reported. As explained before, the classification accuracy rate is not a good evaluation to cope with imbalanced datasets and another measure should be used. The -measure is an evaluation measure, computed as the harmonic mean of precision () and recall (), which means that precision and recall are evenly taken under consideration for the classifier evaluation, being more suitable for class-imbalanced data. For this reason, the -measure was adopted for ranking, weighting, and evaluation purposes and it is computed as follows:
Statistical significance tests consist of rejecting (or not) the null hypothesis which suggests there are no significant differences between observations. To this regard, the Friedman test [16] was used. This is a non-parametric test based on average ranks that allows detecting statistically relevant differences among a group of classifiers. The results when comparing the proposed method and state-of-the-art algorithms indicate significant differences with a value of 1.52E-07. The Friedman test cannot precisely detect which classifier has significant difference towards others, for this reason we use the Nemenyi post-hoc test [37], a multiple pairwise test considering a confidence of 95% ( 0.05).
Besides, the -statistic was used to compare the -th with the -th methods directly, and can be calculated by Eq. (5) as shown by Demšar in [11] where and are the average ranks for the -th and the -th feature selection algorithms, respectively. SE is expressed in Eq. (6) and represents a standard error when performing the pairwise comparison between these methods, where is the number of methods to compare and ND represents the number of datasets. The value is obtained to find the corresponding -value from a normal distribution table in .
All experiments were carried out on a PC with an Intel Core i3 Processor (3.00 GHz) running Windows 7 Professional operating system with 4096 MB of RAM.
Experimental results
In this section, the proposed FWC feature selection algorithm was compared to conventional SFS algorithm using the greedy stepwise search implemented in WEKA, and with state-of-the-art methods such as the bacterial colony optimization based feature selection algorithm (BCO-NN) [50], the hybrid information gain-genetic algorithm (IG-GA-NN) [55], the two population genetic algorithm with distance-based -nearest neighbor voting classifier (TGA-NNV) [29], and the sequential random -nearest neighbors (SRNN) [40]. The BCO-NN is a weighted-based feature selection method which exploits the benefits of evolutionary algorithms for optimization. To this end, it employs the evolutionary bacterial colony optimization (BCO) algorithm [38] to provide the features with different weights to guide the selection process. The feature subset classification error is taken as the fitness function for BCO. Regarding the IG-GA-NN and the TGA-NNV, both are hybrid filter/wrapper methods using a genetic algorithm (GA). The IG-GA-NN first computes the feature relevance by using the information gain (IG) criterion, and then features are filtered according to a relevance threshold. Finally feature selection is carried out by means of a GA. On the other hand, the TGA-NNV performs a gene clustering using Fisher’s least significant differences in a first step, followed by a second step in which a two-population GA is applied. The first population is used to select a cluster from the first step, whereas the second population is devoted to select genes from clusters by its relevance. Furthermore, the SKRNN approach is an ensemble of -NN classifiers arranged similar to the Random Forests, where each of the base classifiers uses a forward selection strategy and a majority voting scheme to give a predictive result.
The experimental comparative results of the proposed FWC, conventional forward selection, and state-of-the-art feature selection methods are given in Table 2, best results are bold-faced. The number of selected features is shown in corresponding parentheses. According to Table 2, FWC algorithm outperforms the rest of methods achieving a higher F-measure in most of the present datasets (7 out of 11). In general, algorithms such as IG-GA/NNV and SRKNN, tend to select more features, which are either irrelevant or redundant. The BCO-NN is consistently the algorithm that selects the smaller number of features. However, the results of classification are quite similar to obtained with proposed FWC.
It should be mentioned that in FWC, the genes selection is consistent even if the pre-filtering stage is applied to reduce the search space to (/3), (/5), or (/10) features at most (early stopping condition is used). Regardless this election, our proposal selects the same attributes in datasets such as Braintumor1, Leukemia1, Lung cancer, Prostate tumor, and SRBCT. Similarly, in some other datasets (11 tumors, Braintumor2, DLBCL, and Leukemia2) our proposal selects attributes consistently, i.e., FWC (/10) selects only 2 attributes less than the FWC without stop condition. This is a proof that the proposed feature ranking schema properly evaluates the attributes improving the -measure.
Classification performance (-measure and selected features) comparison of feature selection methods on microarray datasets
So far, effectiveness of the different feature selection algorithms reported very similar results. Nevertheless, Table 3 depicts the Friedman average ranks for comparative methods, where the 4 proposed strategies in this paper were ranked within the best five.
Table 4 summarizes the results for the Nemenyi post-hoc on the Friedman test and the -test, where we compare our proposal with other feature selection methods. Accordingly, we can in general safely reject the null hypothesis with a significance level of 5% for the FWC, and FWC (/3) methods as compared to -NN using conventional SFS, IG-GA, and TGA schemes, and also in comparison with the SRKNN classification ensemble. In particular, the proposed FWC (/5) is significantly different to two state-of-the-art methods described here (TGA-NN and SRKNN). Results regarding the -test reported an analogous comparative behavior.
Friedman average ranks
Dataset
Avg. rank
Proposed FWC
2.7727
Proposed FWC (/3)
3.2273
BCO-NN
3.6364
Proposed FWC (/5)
4.1364
Proposed FWC (/10)
5.0000
TGA-NNV
5.5909
Conventional SFS (w/stopping criterion)
5.8182
IG-GA-NN
6.0909
SRKNN
8.7273
Friedman test with significance level 0.05, and -test with critical value 2.576 for two-tailed Nemenyi post-hoc test. The -values 0.05 are shown in bold
Time comparison (in seconds) of feature selection methods on a range of data sets
Data set
Proposed
Proposed
Proposed
Proposed
Conventional
Conventional
FWC 1
FWC (/3)
FWC (/5)
FWC (/10)
SFS
SFS. Stop
1
1
1
1
crit. 1
9 tumors
268.54
99.95
64.71
43.46
–
478.00
11 tumors
3294.79
1130.41
875.82
397.68
–
1959.00
14 tumors
10004.84
3282.85
1909.56
1026.04
–
18:56:21
Braintumor1
392.31
143.51
97.70
60.23
–
252.00
Braintumor2
789.91
286.46
207.79
119.00
–
231.00
DLBCL
293.47
109.70
72.43
47.08
–
102.00
Leukemia1
261.38
98.61
64.82
42.11
–
85.00
Leukemia2
1214.49
397.10
276.54
153.76
–
278.00
Lung cancer
4397.32
1727.84
958.48
552.86
–
903.00
Prostate tumor
1345.42
419.05
298.75
168.56
–
296.00
SRBCT
77.89
30.72
22.18
18.47
40:25:02
72.00
Average
2030.94
702.38
440.80
239.02
–
465.60
From Table 4, we can say that our proposed FWC and FWC (/3) are equivalent to evolutionary BCO-NN algorithm. Likewise the FWC (/10) and conventional SFS with stopping criterion were equally evaluated by post-hoc analysis. Although the SFS seems to be effective in some cases, the proposed FWC yielded much better execution times, as shown in Table 5. On the other hand, the conventional SFS leads to very large execution times making it impractical for high-dimensional problems.
Conclusions
In this paper, an efficient feature selection method with a simple strategy for gene ranking and weighting was presented. It comprises an unexplored procedure to perform feature ranking based on the individual feature classification performance. The ranking values also serve as the weights for Euclidean distance on the -NN classifier. Experiments over eleven well-known microarray datasets were carried out. In order to compare our proposal with state-of-the-art algorithms, a ten-fold cross validation scheme was used. Comparative analysis shows that the FWC was the best ranked algorithm according to statistical Friedman test. Also, significant differences between both the proposed FWC and FWC (/3) feature selection strategies and four algorithms were found by the -test. As reported in this study, the FWC can speeds up the feature selection process by adding an early stopping criterion (pre-filtering stage), leading to an efficient classification performance. In the pre-filtering stage, the maximum number of features is limited to a predefined size, speeding up the selection by having a smaller search space. However, it is necessary to identify an appropriate search space for classification in high-dimensional domain without prior knowledge of data.
According to the results, the FWC constitutes a reliable and effective feature selection method. It is worth noticing that our proposal is able to remove more than 98% of correlated or redundant genes, providing enhanced classification accuracy as well.
In future research, we focus on a wide analysis including a variety of classification algorithms using the presented feature selection scheme. Moreover, we suggest extending this proposal to other high-dimensional datasets in different contexts. This would greatly help to characterize the behavior of presented method concerning the classification performance and, also, for measuring the removal of redundant genes by using classification algorithms based on different approaches, such as statistical learning, decision trees or knowledge-based algorithms. Hence, our proposal is competitive to state-of-the-art methods and can be applied in problems of high research interest.
Footnotes
Acknowledgments
The authors would like to thank the following institutions for their support: Science and Technology National Council of Mexico, Universidad Autónoma de Guerrero (School of Engineering), Instituto Politécnico Nacional of Mexico (Center for Computing Research, and Center for Innovation and Computing Technological Development). A special thanks to Line Clemmensen, for her constructive comments helped to improve the present work.
Conflict of interest
The authors declare no conflict of interest.
References
1.
AmaralJ.L.M.LopesA.J.VeigaJ.FariaA.C.D. and MeloP.L., High-accuracy Detection of Airway Obstruction in Asthma Using Machine Learning Algorithms and Forced Oscillation Measurements, Comput Methods Programs Biomed (2017).
2.
ApolloniJ.LeguizamónG. and AlbaE., Two hybrid wrapper-filter feature selection algorithms applied to high-dimensional microarray experiments, Appl Soft Comput38 (2016), 922–932. doi: 10.1016/j.asoc.2015.10.037.
3.
BiehlM.HammerB. and VillmannT., Distance measures for prototype based classification, in: Int Work Brain-Inspired Comput, 2013, pp. 10.0–116.
4.
BlumA.L. and LangleyP., Selection of relevant features and examples in machine learning, Artif Intell97 (1997), 245–271. doi: 10.1016/S0004-3702(97)00063-5.
5.
Bolón-CanedoV.Sánchez-MaroñoN. and Alonso-BetanzosA., An ensemble of filters and classifiers for microarray data classification, Pattern Recognit45 (2012), 531–539. doi: 10.1016/j.patcog.2011.06.006.
6.
Bolón-CanedoV.Sánchez-MaroñpN. and Alonso-BetanzosA., Distributed feature selection: An application to microarray data classification, Appl Soft Comput30 (2015), 136–150. doi: 10.1016/j.asoc.2015.01.035.
7.
ChanW.H.MohamadM.S.DerisS.ZakiN.KasimS.OmatuS.CorchadoJ.M. and Al AshwalH., Identification of informative genes and pathways using an improved penalized support vector machine with a weighting scheme, Comput Biol Med77 (2016), 102–115. doi: 10.1016/j.compbiomed.2016.08.004.
8.
ChandrashekarG. and SahinF., A survey on feature selection methods, Comput Electr Eng40 (2014), 16–28. doi: 10.1016/j.compeleceng.2013.11.024.
CoverT. and HartP., Nearest neighbor pattern classification, IEEE Trans Inf Theory13 (1967), 21–27. doi: 10.1109/TIT.1967.1053964.
11.
DemšarJ., Statistical comparisons of classifiers over multiple data sets, J Mach Learn Res7 (2006), 1–30. doi: 10.1.1.141.3142.
12.
DengZ.ZhuX.ChengD.ZongM. and ZhangS., Efficient kNN classification algorithm for big data, Neurocomputing195 (2016), 143–148.
13.
ElyasigomariV.LeeD.A.ScreenH.R.C. and ShaheedM.H., Development of a two-stage gene selection method that incorporates a novel hybrid approach using the cuckoo optimization algorithm and harmony search for cancer classification, J Biomed Inform67 (2017), 11–20.
14.
ErtuugrulöF. and TauglukM.E., A novel version of k nearest neighbor: Dependent nearest neighbor, Appl SoftComput55 (2017), 480–490.
15.
FixE. and HodgesJ.L., Discriminatory analysis nonparametric discrimination: Consistency properties, Int Stat Rev/Rev Int Stat57 (1989), 238. doi: 10.2307/1403797.
16.
FriedmanM., The Use of Ranks to Avoid the Assumption of Normality Implicit in the analysis of variance, J Am Stat Assoc32 (1937), 675–701. doi: 10.1080/01621459.1937.10503522.
17.
GaliN.Mariescu-IstodorR. and FräntiP., Using linguistic features to automatically extract web page title, Expert Syst Appl79 (2017), 296–312.
18.
GolubT.R., Molecular Classification of cancer: Class discovery and class prediction by gene expression monitoring, Science (80-.)286 (1999), 531–537. doi: 10.1126/science.286.5439.531.
19.
GuyonI. and ElisseeffA., An introduction to variable and feature selection, J Mach Learn Res3 (2003), 1157–1182.
20.
GuyonI. and ElisseeffA., An introduction to feature extraction, in: Featur Extr, Springer, 2006, pp. 1–25.
21.
GuyonI.WestonJ.BarnhillS. and VapnikV., Gene selection for cancer classification using support vector machines, Mach Learn46 (2002), 389–422.
22.
HallM.FrankE.HolmesG.PfahringerB.ReutemannP. and WittenI.H., The WEKA data mining software: an update, ACM SIGKDD Explor Newsl11 (2009), 10–18.
23.
HiraZ.M. and GilliesD.F., A review of feature selection and feature extraction methods applied on microarray data, Adv Bioinformatics2015 (2015), 1–13. doi: 10.1155/2015/198363.
24.
HsuH.-H.HsiehC.-W. and LuM.-D., Hybrid feature selection by combining filters and wrappers, Expert Syst Appl38 (2011), 8144–8150.
25.
JamesG.WittenD.HastieT. and TibshiraniR., An Introduction to Statistical Learning, Springer, 2013.
26.
JefferyI.B.HigginsD.G. and CulhaneA.C., Comparison and evaluation of methods for generating differentially expressed gene lists from microarray data, BMC Bioinformatics7 (2006), 359.
27.
KiraK. and RendellL.A., The feature selection problem: Traditional methods and a new algorithm, in: AAAI, 1992, pp. 129–134.
28.
KohaviR. and JohnG.H., Wrappers for feature subset selection, Artif Intell97 (1997), 273–324. doi: 10.1016/S0004-3702(97)00043-X.
29.
LeeC.P. and LinW.S., Using the two-population genetic algorithm with distance-based k-nearest neighbour voting classifier for high-dimensional data, Int J Data Min Bioinform14 (2016), 315. doi: 10.1504/IJDMB.2016.075820.
30.
LiJ.ChengK.WangS.MorstatterF.TrevinoR.P.TangJ. and LiuH., Feature selection: A data perspective, ACM Comput Surv50 (2017), 94.
31.
LuH.ChenJ.YanK.JinQ.XueY. and GaoZ., A hybrid feature selection algorithm for gene expression data classification, Neurocomputing (2017).
32.
MailloJ.RamírezS.TrigueroI. and HerreraF., kNN-IS: An Iterative Spark-based design of the k-Nearest Neighbors classifier for big data, Knowledge-Based Syst.117 (2017), 3–15.
33.
MandalM. and MukhopadhyayA., Multiobjective PSO-based rank aggregation: Application in gene ranking from microarray data, Inf Sci (Ny)385 (2017), 55–75.
34.
MolinaL.C.BelancheL. and NebotA., Feature selection algorithms: A survey and experimental evaluation, in: 2002 IEEE Int. Conf. Data Mining, 2002. Proceedings, IEEE Comput. Soc, 2002, pp. 306–313. doi: 10.1109/ICDM.2002.1183917.
35.
MortazaviA. and MoattarM.H., Robust feature selection from microarray data based on cooperative game theory and qualitative mutual information, Adv Bioinformatics2016 (2016), 1–16. doi: 10.1155/2016/1058305.
36.
NarendraP.M. and FukunagaK., A branch and bound algorithm for feature subset selection, IEEE Trans Comput26 (1977), 917–922. doi: 10.1109/tc.1977.1674939.
PanZ.WangY. and KuW., A new general nearest neighbor classification based on the mutual neighborhood information, Knowledge-Based Syst.121 (2017), 142–152.
40.
ParkC.H. and KimS.B., Sequential random k-nearest neighbor feature selection for high-dimensional data, Expert Syst. Appl42 (2015), 2336–2342. doi: 10.1016/j.eswa.2014.10.044.
41.
ShreemS.S.AbdullahS. and NazriM.Z.A., Hybrid feature selection algorithm using symmetrical uncertainty and a harmony search algorithm, Int J Syst Sci47 (2016), 1312–1329.
42.
SongY.LiangJ.LuJ. and ZhaoX., An efficient instance selection algorithm for k nearest neighbor regression, Neurocomputing (2017).
43.
SunY.WongA.K.C. and KamelM.S., Classification of imbalanced data: A review, Int J Pattern Recognit Artif Intell23 (2009), 687–719.
44.
TangJ.AlelyaniS. and LiuH., Feature selection for classification: A review, Data Classif Algorithms Appl (2014), 37.
45.
TibshiraniR., Regression shrinkage and selection via the lasso, J R Stat Soc Ser B (1996), 267–288.
46.
TrstenjakB.MikacS. and DonkoD., KNN with TF-IDF based framework for text categorization, Procedia Eng69 (2014), 1356–1364.
47.
Walters-WilliamsJ. and LiY., Comparative study of distance functions for nearest neighbors, Adv Tech Comput Sci Softw Eng (2010), 79–84.
48.
WangA.AnN.ChenG.LiL. and AlterovitzG., Improving PLS-RFE based gene selection for microarray data classification, Comput Biol Med62 (2015), 14–24. doi: 10.1016/j.compbiomed.2015.04.011.
49.
WangA.AnN.ChenG.LiL. and AlterovitzG., Accelerating wrapper-based feature selection with K-nearest-neighbor, Knowledge-Based Syst83 (2015), 81–91. doi: 10.1016/j.knosys.2015.03.009.
50.
WangH.JingX. and NiuB., A discrete bacterial algorithm for feature selection in classification of microarray gene expression cancer data, Knowledge-Based Syst126 (2017), 8–19. doi: 10.1016/j.knosys.2017.04.004.
51.
WeiL.WanS.GuoJ. and WongK.K.L., A novel hierarchical selective ensemble classifier with bioinformatics application, Artif Intell Med (2017).
52.
WeinbergerK.Q. and SaulL.K., Distance metric learning for large margin nearest neighbor classification, J Mach Learn Res10 (2009), 207–244.
53.
WettschereckD.AhaD.W. and MohriT., A review and empirical evaluation of feature weighting methods for a class of lazy learning algorithms, Artif Intell Rev11 (1997), 273–314.
54.
YangC.-H.WengZ.-J.ChuangL.-Y. and YangC.-S., Identification of SNP-SNP interaction for chronic dialysis patients, Comput Biol Med83 (2017), 94–101.
55.
YangC.-H.ChuangL.-Y. and YangC.H., IG-GA: a hybrid filter/wrapper method for feature selection of microarray data, J Med Biol Eng30 (2010), 23–28.
56.
YangJ.ZhouJ.ZhuZ.MaX. and JiZ., Iterative ensemble feature selection for multiclass classification of imbalanced microarray data, J Biol Res23 (2016), 13.
57.
ZhangC.LuX. and ZhangX., Significance of gene ranking for classification of microarray samples, IEEE/ACM Trans Comput Biol Bioinforma3 (2006), 312–320. doi: 10.1109/TCBB.2006.42.
58.
ZhangX.LiY.KotagiriR.WuL.TariZ. and CherietM., KRNN: k Rare-class Nearest Neighbour classification, Pattern Recognit62 (2017), 33–44.
59.
ZouH. and HastieT., Regularization and variable selection via the elastic net, J R Stat Soc Ser B67 (2005), 301–320. doi: 10.1111/j.1467-9868.2005.00503.x.
60.
Cancer microarray data sets. Plymouth University, (2005). http://www.tech.plym.ac.uk/spmc/links/bioinformatics/microarray/microarray_cancers.html (accessed February 14, 2017).