The problem of efficiently classifying imbalanced data has become one of the most challenging tasks in machine learning. Some real world examples include medical image analysis, fraud detection, fault diagnosis, and anomaly detection. Although several data-level algorithms have been developed to address imbalance, they are typically subject to some restrictions. We propose a novel variant of the -NN family of classifiers, and name this as Density-based Adaptive-distance NN (DANN). It can effectively handle data with skewed distributions and varying class-densities using the concept of adaptive distance. Comparative superiority is experimentally established over related data-level algorithms (SMOTE, ADASYN), using ten sets of two-class data, in terms of geometric mean (of the true positive and negative rates) and accuracy. Additionally, five sets of multi-class data are considered and compared with different variants of -NN, which are currently very popular. Finally, DANN is successfully applied on the highly imbalanced Lower Grade Glioma (LGG) MR images, with an Average-Dice score of 0.9082 for delineating the tumor regions. The results demonstrate clear superiority over state-of-the-art algorithms.
The problem of imbalanced data arises in a variety of applications, and continues to attract the machine learning community around the world to explore from various perspectives. A dataset is termed imbalanced or skewed when the number of patterns in one or more class(es) is considerably higher than that of the other class(es). Classifying such imbalanced dataset is difficult due to the inherent bias of training towards the majority class(es). Usually the error rate increases when the minority classes do not have sufficient patterns to represent them in the dataset [1], thereby often getting treated as noise. In the year 2009 He and Garcia [2], published an article on learning from imbalanced data. This was followed by several research-works demonstrating the necessity of different approaches and associated variety of methodologies for handling varied applications of imbalanced data.
Designing a classifier for imbalanced datasets is a challenging problem in machine learning. It is caused by the skewed distribution of data among the classes. Most standard algorithms assume balanced class distribution with equal misclassification cost. Therefore, when presented with large imbalanced datasets, most of these algorithms fail to properly represent their distributive characteristics. There are two main approaches to be considered, viz. data-level and algorithm-level. Most of the studies in the first category apply resampling techniques to get a balanced distribution. One can either under-sample the majority class [3] or over-sample the minority class [4], or pursue both strategies concurrently; the Synthetic Minority Over-sampling TEchnique (SMOTE) [5] being a typical example. At algorithmic level, one can apply boosting or adjust the misclassification cost. A boosting algorithm constructs a strong classifier from some baseline classifiers, like SVM or -NN [2].
Contribution
The contribution is threefold: Firstly a new algorithm based on -NN classifier, using a modified adaptive distance measure, is proposed for handling skewed distribution involving different densities (number of points in unit area/volume). Secondly, it is validated with state-of-the-art algorithms and found to be superior for both two- and multi-class problem. Thirdly, it is also evaluated on medical image segmentation, which typically consists of imbalanced data, and found to conform to the ground truth. The main advantage of the proposed method is that it can be applied to any type of data, whether small or large, balanced or imbalanced.
The rest of the paper is organized as follows. Related works are reported in Section 2. Section 3 provides an overview of the existing variants of nearest neighbor classifiers, as reported in literature. Section 4 presents the proposed algorithm Density-based Adaptive distance -NN (DANN). This is followed by the experimental results in Section 5, on 15 publicly available datasets along with an application in medical image analysis, to establish its effectiveness in different scenarios. Some state-of-the-art methods, described in the following section, are compared with our algorithm DANN. Finally Section 6 concludes the article.
Related works
In recent years, different approaches to classify imbalanced data has become one of the focused tasks in machine learning [6]. This situation is extremely common in many real world classification problems, like fault diagnosis [7, 8, 9, 10], anomaly detection [11, 12, 13], fraud detection [14], medical diagnosis [15, 16, 17, 18, 19, 20], image segmentation [20], face recognition [21], spam detection [22], vehicle classification [23], land cover classification [24, 25], string space [26], face detection [27, 28], train management [29], transportation system [30], etc. To overcome this problem many algorithms have been developed. Japkowicz [31] provided a comparison between performances of different classifiers on imbalanced data. Hulse et al. [32] presented a comprehensive and systematic experimental analysis of learning from imbalanced data. Batista et al. [33] studied the behavior of several methods for balancing training data in machine learning. Different sampling methods were developed [2, 34, 35], for imbalanced data, using Synthetic Minority Over-sampling TEchnique (SMOTE) [36, 5, 37, 38], cluster-based under-sampling [39], feature selection [40] and suitable classifiers [41, 42, 43, 44, 45, 46, 47]. However most of them were implemented in the binary classification scenario, and are not suited for handling multi-class problems. Good review articles on handling imbalanced data are also available [48, 49, 50, 51]. Many of the recent publications demonstrate the importance, necessity and difficulty in solving problems with imbalance data and its possible solutions [41, 42, 48, 7, 22, 15, 16, 29, 36, 8, 20, 24, 23, 11, 17, 25, 30, 26, 18, 40, 27, 43, 44, 28, 34, 45, 46, 52, 53].
All these methods, although successful in several applications, may not be suitable for all problems, particularly those involving medical images; where simply changing the data statistics by augmentation may not be an appropriate strategy. In medical data typically the disease (or abnormal) region(s) in images are very small in size as compared to the larger normal regions; thus making it an important application of imbalanced data. Detection of the diseased class, which normally smaller in size, and its accurate delineation in a medical image is typically more important for proper diagnosis and prognosis. Since most of the treatment and cure are based on this analysis, it makes the problem even more challenging in the framework of machine learning.
Although many algorithms have been developed over the years, yet finding a better (or improved) solution remains a major issue in medical image analysis. It is to be noted that data-level approaches (like over-sampling, under-sampling) are not suitable for this kind of problems. Although use of some variations of SMOTE have been reported in medical image segmentation [20], yet it is more appropriate to use an algorithm-level method such that the data statistics remains unchanged. In this scenario we propose the Density-based Adaptive distance -NN (DANN) algorithm.
Nearest neighbour classification and some variants of k-NN
Nearest neighbor (NN) classifier [54] constitutes a popular family of non-parametric supervised learning models which can effectively identify an unknown sample with one of the predefined classes . It is one of the fundamental and simplest classifiers in literature, and requires little or no prior domain knowledge about the data. It was developed from the need to perform discriminant analysis in the absence of reliable parametric estimates of probability densities. Initially a set of distances is computed from the query instance to each of the training patterns . The decision is based on the class label of its nearest neighbor from the training patterns.
Let , be the training set with each belonging to a class . The distance of from is computed as
where indicates the distance norm (like absolute, Euclidean, etc.). The nearest neighbor is selected as
with being assigned the class label corresponding to .
It can be shown mathematically, for and , that the -NN classification error is bounded above by twice the Bayesian error rate [54]. The well-known -NN classifier [54] applies majority voting to determine the class label of , based on those of its nearest neighbors . This is computed after sorting the ’s of Eq. (1) in an ascending order, and considering the first such training patterns with the class label for being assigned as the one having the maximum votes amongst the , here can be 1, 2, 3, …etc.
This was followed by a series of investigations encompassing new approaches with a reject option [55], refinements with respect to Bayes error rate [56], distance weighted approaches [57, 58], soft computing [59], and fuzzy sets [60, 61]. Subsequently a simple adaptive distance measure [62] and threshold on voting between two classes [63] were introduced. However in situations involving skewed data, where the cardinality of a class is very high as compared to that of the other class(es), all these algorithms are found to present a bias favoring the class with high cardinality.
The basic -NN, as defined by Cover and Hart [54], is described in Section 1. We consider here some of its variants, popularly used for avoiding the dangers of improperly modeling the underlying data distribution in various applications.
A simple and intuitively appealing extension to the -NN classifier uses a neighbor weighting function for assigning a class to a query pattern [57]. The th nearest neighbor of pattern is provided with a weight , for , defined as
where , are the distances from its nearest and farthest (th) neighbors, respectively. The algorithm assigns to that class, for which the sum of weights of all its representatives (amongst the nearest neighbors) is the maximum. However, this algorithm was shown to be not necessarily better than -NN for small sample sizes, when ties among classes are resolved judiciously [58]. In the infinite sample case -NN is found to be the best [58].
The Pseudo nearest neighbor (PNN) classifier [64] considers local learning in each class, with training patterns from the “” classes being weighted class-wise on the basis of their distances from pattern . This helps incorporate not only the information about its nearest pattern, but also that of its neighbors from every class. We have , such that decreases with increasing (because is the rank, proportional to distance, of the nearest neighbourhood). The weighted distance of , from its -nearest neighbors, is computed as
with its class assignment for being made by
Algorithm TNN [63] was developed to handle high-dimensional document data involving sparsity. Here is not fixed, but is dependent on the threshold between the highest and second-highest cardinalities of neighboring pattern classes. Authors consider the distance of the (normally taken as a suitably large value) patterns from . For a choice of , where is a user-defined parameter, let the class having the highest count be and that with the second-highest count be .
The algorithm gets outlined as follows. Initialization: At start the value of will be same as . {} exit remains unassigned [otherwise] exit
The -NN family of classifiers has also been fuzzified to design the fuzzy -NN (FNN) model [61]. This is another approach to handle overlapped classes. Here each pattern is assigned a finite membership value to each of the classes, with being labeled with that class having the maximum value of . While in -NN every point of a class is considered to be equally important for identifying the class label of an unknown query pattern, the FNN associates each such pattern with a membership value based on the local overlapping amongst different classes. Besides, here each NN pattern is assigned a finite membership value inversely proportional to its distance from the query pattern.
Initially the nearest neighbors of are identified, and sorted in ascending order of their distance by Eq. (1). Let the number of patterns in belonging to class be . Then all are assigned membership to each class using
The test pattern is assigned membership to class , , as
where and is a fuzzifier which determines the weighting of the distance component. The class , for which is the maximum, is assigned as the class label of . As , the nearer neighbors get weighted more heavily than those farther away; such that the number of training patterns influencing the classification of query pattern get reduced.
Apart from those mentioned above algorithmic variants there are some popular data-level over-sampling approaches also. SMOTE [5] is a simple and intuitively-appealing algorithm which over-samples the minority class(es) in a systematic manner. It is very effective in handling imbalanced data, and generates data points in a minority class by using the feature-space instead of the data-space.
Let us consider nearest points of a minority class sample . This is over-sampled by introducing synthetic points along the straight line connecting all or any nearest point with . Each straight line can contain only one synthetic point. The number of synthetic points for is selected using the imbalance ratio between the classes, with the selection of the straight lines (from among the lines) being purely random. The algorithm, thereby, can generate imaginary data points in the feature-space to be used to train any classifier. As the reality of such imaginary points in the data-space remains unknown, therefore this algorithm is often unsuitable for many applications (like in image segmentation).
A major disadvantage of SMOTE is that, the algorithm gives same priority to all points whether or not they lie in the overlapped or non-overlapped regions; thereby leading to the generation of some unnecessary data points in non-overlapped regions. The objective of the ADAptive SYNthetic (ADASYN) [38] sampling approach for imbalanced learning is to minimize this problem. ADASYN is a variant of SMOTE, and handles the skewed distribution in imbalanced data by assigning different priority (weight) to the minority class points. First the number of minority points , required to balance the dataset, is calculated. Using the density distribution of the dataset, it then chooses the minority class regions which need to be over-sampled. Finally it randomly over-samples the chosen region(s), by inserting data point(s) between randomly chosen pair(s) of samples belonging to the minority class.
Although both SMOTE and ADASYN perform well in a class imbalanced scenario, there exist some problems. Both the algorithms use pre-processing (over-sampling), thereby increasing the computational cost by generating these (imaginary) data points. The physical significance of these imaginary points remains unknown. Moreover both the algorithms operate mainly on two-class problems, and extending them to the multi-class scenario is not straight-forward. Research has considered One vs one [65] or One-against-all [66] strategies, to extend this to the multi-class domain.
In order to circumvent this situation, we propose DANN. The algorithm works on both the two-class as well as multi-class scenarios, without requiring any modification of data statistics. It is elaborated in the next section.
Incorporating adaptive distance and data density: Algorithm DAkNN
Our algorithm considers the density of a class and the adaptive distance with respect to neighboring points. Both these concepts, separately, have been used in machine learning in various ways, towards achieving better estimation.
One such adaptive distance based -NN is the Simple Adaptive Distance Measure (SADM) [62]. It introduces a new distance measure to circumvent some of the problems in a two-class scenario. Let be the radius of the training pattern , such that
where is the nearest pattern of in X which belongs to a different class from the class of , , and . This corresponds to the radius of the largest circle, drawn with center , which excludes training patterns in from any other class. In a binary framework this reduces to for . Now the modified distance is scaled from Eqs (1) and (8) as
Therefore if belongs to a region of high overlap then is less with increasing , and vice versa. The user-defined parameter in Eq. (8) ensures that , where is an arbitrarily small real value. The distances of (the query pattern) from , computed using Eq. (9), are sorted in an ascending order to determine the set of nearest neighbors in this modified situation. The class label of is assigned from the majority vote of class labels in . Therefore patterns lying nearer the center of a class have a larger as compared to those towards the class boundaries.
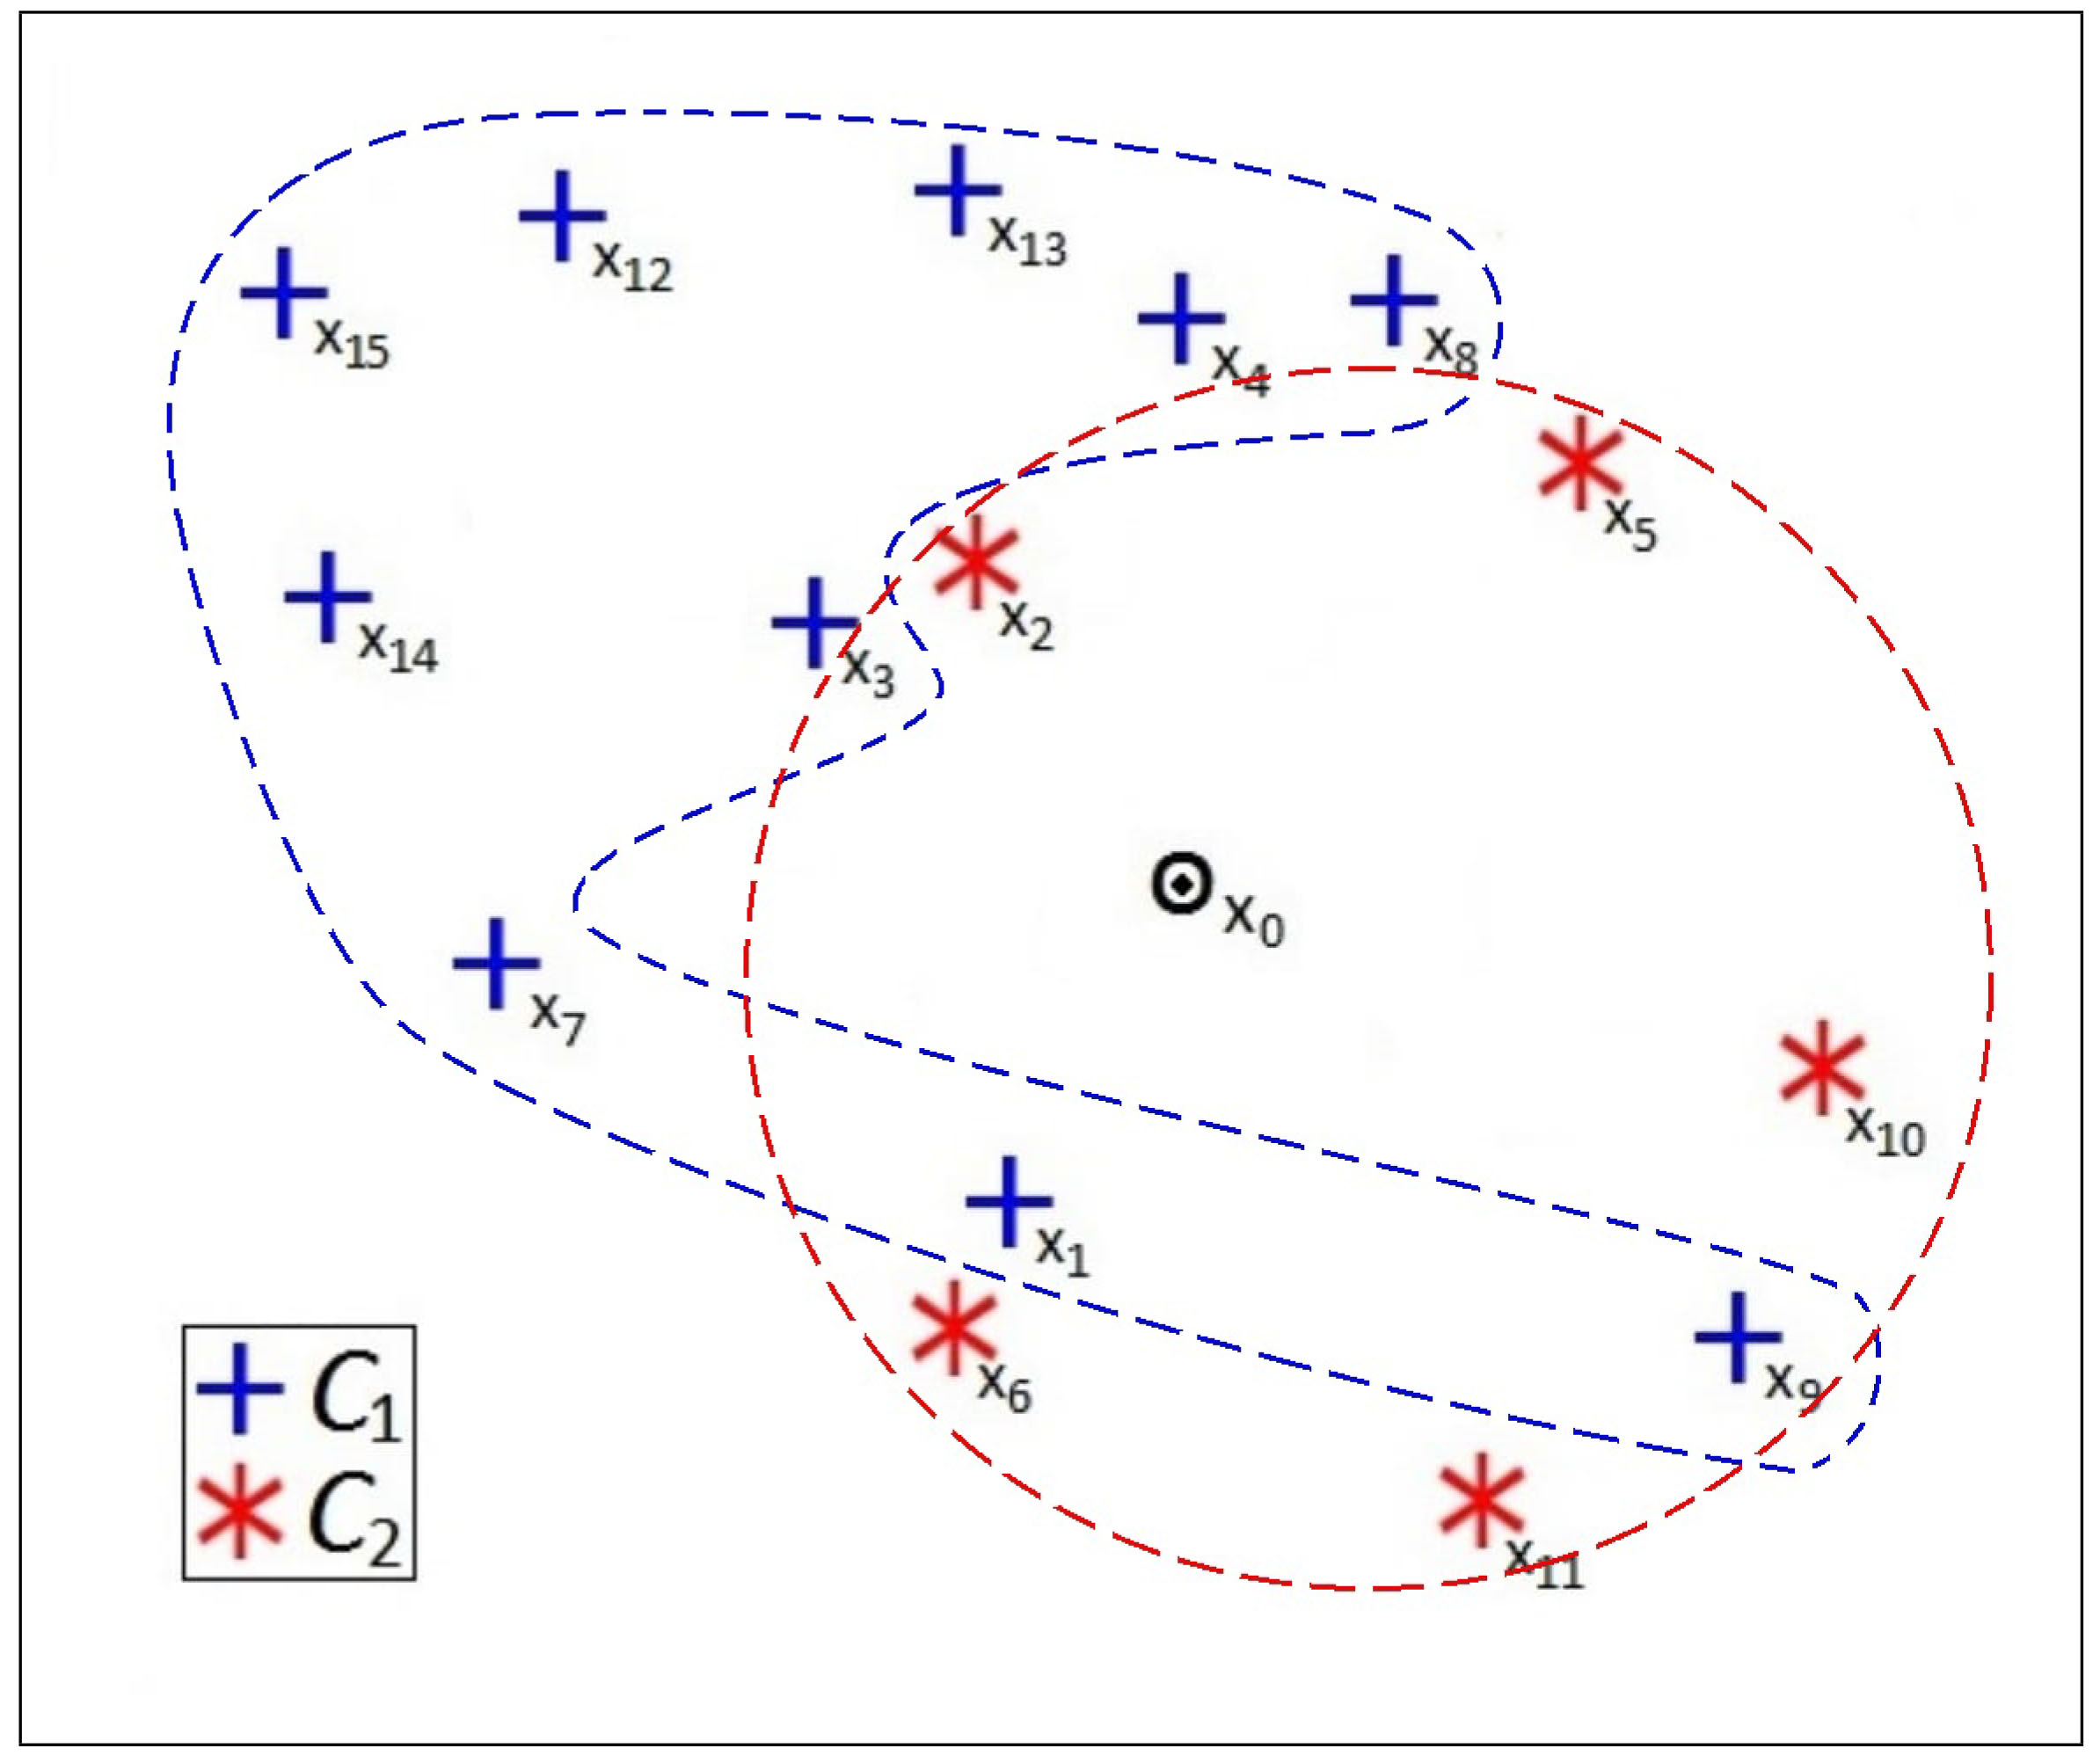
Let us consider the two-class scenario of Fig. 1a, where the symbols “” and “*” indicate classes and , respectively. It is evident that with , -NN would always assign to class . Figure 1b depicts the radii of these five neighbors using Eq. (8). Applying the scaled distance of Eq. (9), the five new nearest neighbors are shown in Fig. 1c. This is because the radii of all points in class are less than their physical distance from . On the other hand, the modified distances computed by the training patterns of class are less than “one” because their corresponding radii are greater than their physical distances from . Hence SADM assigns to class .
However problems arise in SADM when the pattern distribution in the different classes is largely skewed and with varying class density. Thereby causing uneven domination by a class with a large radius and/or density, and leads to increased misclassification; and sometimes the smaller class could even get missed from detection. Thus query pattern from an overlapped region experiences greater influence from training patterns lying towards the class centers.
Two-class discrimination. (a) Using -NN classifier, for 5 with (b) radii of five nearest neighbors, marked on surrounding circle, and (c) using SADM classifier.
Two-class skewed distribution.
The proposed algorithm is a new approach to handle skewed distributions by using the concept of adaptive distance modified by the class density factor. Let us intuitively explain with an example. Consider two class and of Fig. 2 having different densities. The training patterns are numbered in an ascending order, sorted according to their distance from the test pattern . It is obvious that -NN would assign to class . Algorithm SADM defines a radius around every training pattern to compute the scaled distance from using Eqs (8) and (9). Thereby would again be assigned to class (as , , would become closest). But in reality belongs to class . In order to circumvent this problem in underlying skewed distributions of data, involving widely varying class cardinalities, we introduce algorithm DANN using the principle of density. The proposed algorithm, using the concept of density, estimates an adaptive distance for classifying the data point; thereby providing balanced weights to larger and smaller classes.
It is evident from the figure that and are the two (closest) training patterns from the two classes and , respectively. We incorporate the notion of density while computing the modified distance of as
where, is defined by Eq. (9) and is the corresponding distance of the closest pattern (belonging to ) to . Note that only the training patterns belonging to are considered when evaluating . Thereby all patterns from will come closer if [if in Eq. (9)], and vice versa. The central tendency of is calculated as
where is given by Eq. (1) and is the cardinality of the class . Finally, using Eqs (10) and (11), we express the modified distance as
This helps emphasize the impact of the rare class on the computation of distance. The steps of algorithm is given below.
Algorithm 1: Algorithm DANN:
1. At first for a given point , compute using Eq. (9).
2. Find the nearest pattern, belonging to , to compute from it.
4. Compute the final modified distance using Eq. (12).
5. Based on this as the final modified distance, the proposed classifier is used to determine the class label of the query point.
Observations
Nearest neighbors may change after this distance modification.
-nearest neighbors may be completely different.
Voting can result in a different class label for .
The proposed algorithm may completely change the final results depending on the distribution of patterns from the different classes. It is observed from our experiments, in Section 4, that the results by our algorithm are generally better than those of existing -NN versions, as well as those employing over-sampling strategies like SMOTE and ADASYN.
Experimental results
The performance of the proposed algorithm DANN was exhaustively evaluated and compared with state-of-the-art related methods, for classification and image segmentation in the framework of imbalanced data. These are elucidated in this section.
Classification
The performance of the algorithm DANN was evaluated on 15 benchmark datasets, from which ten were two-class and the remaining five were multi-class. Among the ten two-class datasets, five were taken from KEEL [67], three from UCI [68] (Sonar, Heart, Liver) and two were synthetically generated (SYNTH_DATA1, SYNTH_BIG). Among the five multi-class datasets, three were taken from the publicly available UCI [68], one was a publicly available highly overlapped Vowel data [69], and the remaining one was synthetically generated (SYNTH_DATA2). The details of these datasets are shown in Table 1.
Imbalanced datasets used
S. no.
Name
Source
Classes
Features
Instances
IR
1
glass-0-6_vs_5
KEEL
2
9
108
11.0
2
Ecoli-0_vs_1
KEEL
2
7
220
1.86
3
Pima
KEEL
2
8
768
1.87
4
Glass-0-1-2-3_vs_4-5-6
KEEL
2
9
214
3.20
5
Ecoli2
KEEL
2
7
336
5.46
6
Sonar
UCI
2
60
208
1.14
7
Heart
UCI
2
13
270
1.25
8
Liver
UCI
2
6
345
1.38
9
SYNTH_DATA1
Synthetic
2
2
400
1.67
10
SYNTH_BIG
Synthetic
2
2
20000
1.50
11
Glass
UCI
6
10
214
7.60
12
Ecoli
UCI
8
7
336
28.6
13
Wine
UCI
3
13
178
1.48
14
Vowel
UCI
6
3
871
2.86
15
SYNTH_DATA2
Synthetic
3
3
800
2.67
IR for multi-class datasets are measured by the ratio of smallest to largest.
All the datasets, chosen for our experiments, are imbalanced. The Imbalance Ratio (IR) was computed between the majority and minority class cardinalities [40]. In this scenario, only the classification accuracy is not sufficient to evaluate the performance of a classifier. Many authors suggest the use of geometric mean of the true positive and negative rates (GM) [70] to evaluate a classifier over imbalanced data. However, an increased GM with decreased overall classification accuracy becomes meaningless. Therefore we have used both the GM and the classification accuracy to evaluate the performance of a classifier. GM is defined as follows:
where TP is True Positive, TN is True Negative, FN is False Negative and FP is False Positive.
The performance of DANN was first compared with SMOTE [5] and one of its variants ADASYN [38]. To evaluate SMOTE and ADASYN we have used k-NN as the base classifier. The results in Table 2 (with highest scores marked in bold), generated using Leave-One-Out (LOO) technique averaged over (where 1, 3, and 5), depict that our DANN (with an 0.8044 (0.1356)) generally outperforms SMOTE and ADASYN in the two-class scenario. Moreover, it is also found to be superior with respect to these methods in terms of classification accuracy. This leads to the conclusion that, unlike SMOTE, DANN does not compromise overall classification accuracy to achieve a better GM. It is also observed that ADASYN and DANN both consistently have a higher Accuracy as compared to GM values. Interestingly, in the case of data “Glass-0-6_vs_5”, ADASYN exhibits an adverse effect; this is perhaps due to the presence of overlapped data. On the whole, our algorithm DANN was found to perform consistently better than SMOTE and ADASYN over all the datasets used.
Comparative accuracy and GM averaged over , on two-class imbalanced data, using Leave-One-Out strategy
S. no.
Datasets
Accuracy
GM
SMOTE
ADASYN
DANN
SMOTE
ADASYN
DANN
1
Glass-0-6_vs_5
0.9475
0.9259
0.9753
0.7613
0.1925
0.8976
2
Ecoli-0_vs_1
0.9788
0.9318
0.9909
0.9692
0.9000
0.9869
3
Pima
0.6007
0.7053
0.7352
0.6289
0.6507
0.6671
4
Glass-0-1-2-3_vs_4-5-6
0.9502
0.9424
0.9720
0.9603
0.9183
0.9681
5
Ecoli2
0.9137
0.9474
0.9633
0.9123
0.9040
0.9243
6
Liver
0.5072
0.6280
0.6512
0.4509
0.6131
0.6421
7
Sonar
0.8029
0.8365
0.8638
0.8033
0.8297
0.8578
8
Heart
0.6259
0.6802
0.6963
0.4545
0.6636
0.6840
9
SYNTH_DATA1
0.5900
0.7675
0.7700
0.6082
0.7242
0.7345
10
SYNTH_BIG
0.5148
0.6977
0.7257
0.5611
0.6692
0.6820
Mean
0.7432
0.8063
0.8344
0.7110
0.7065
0.8044
Standard deviation
0.1938
0.1250
0.1330
0.1982
0.2150
0.1356
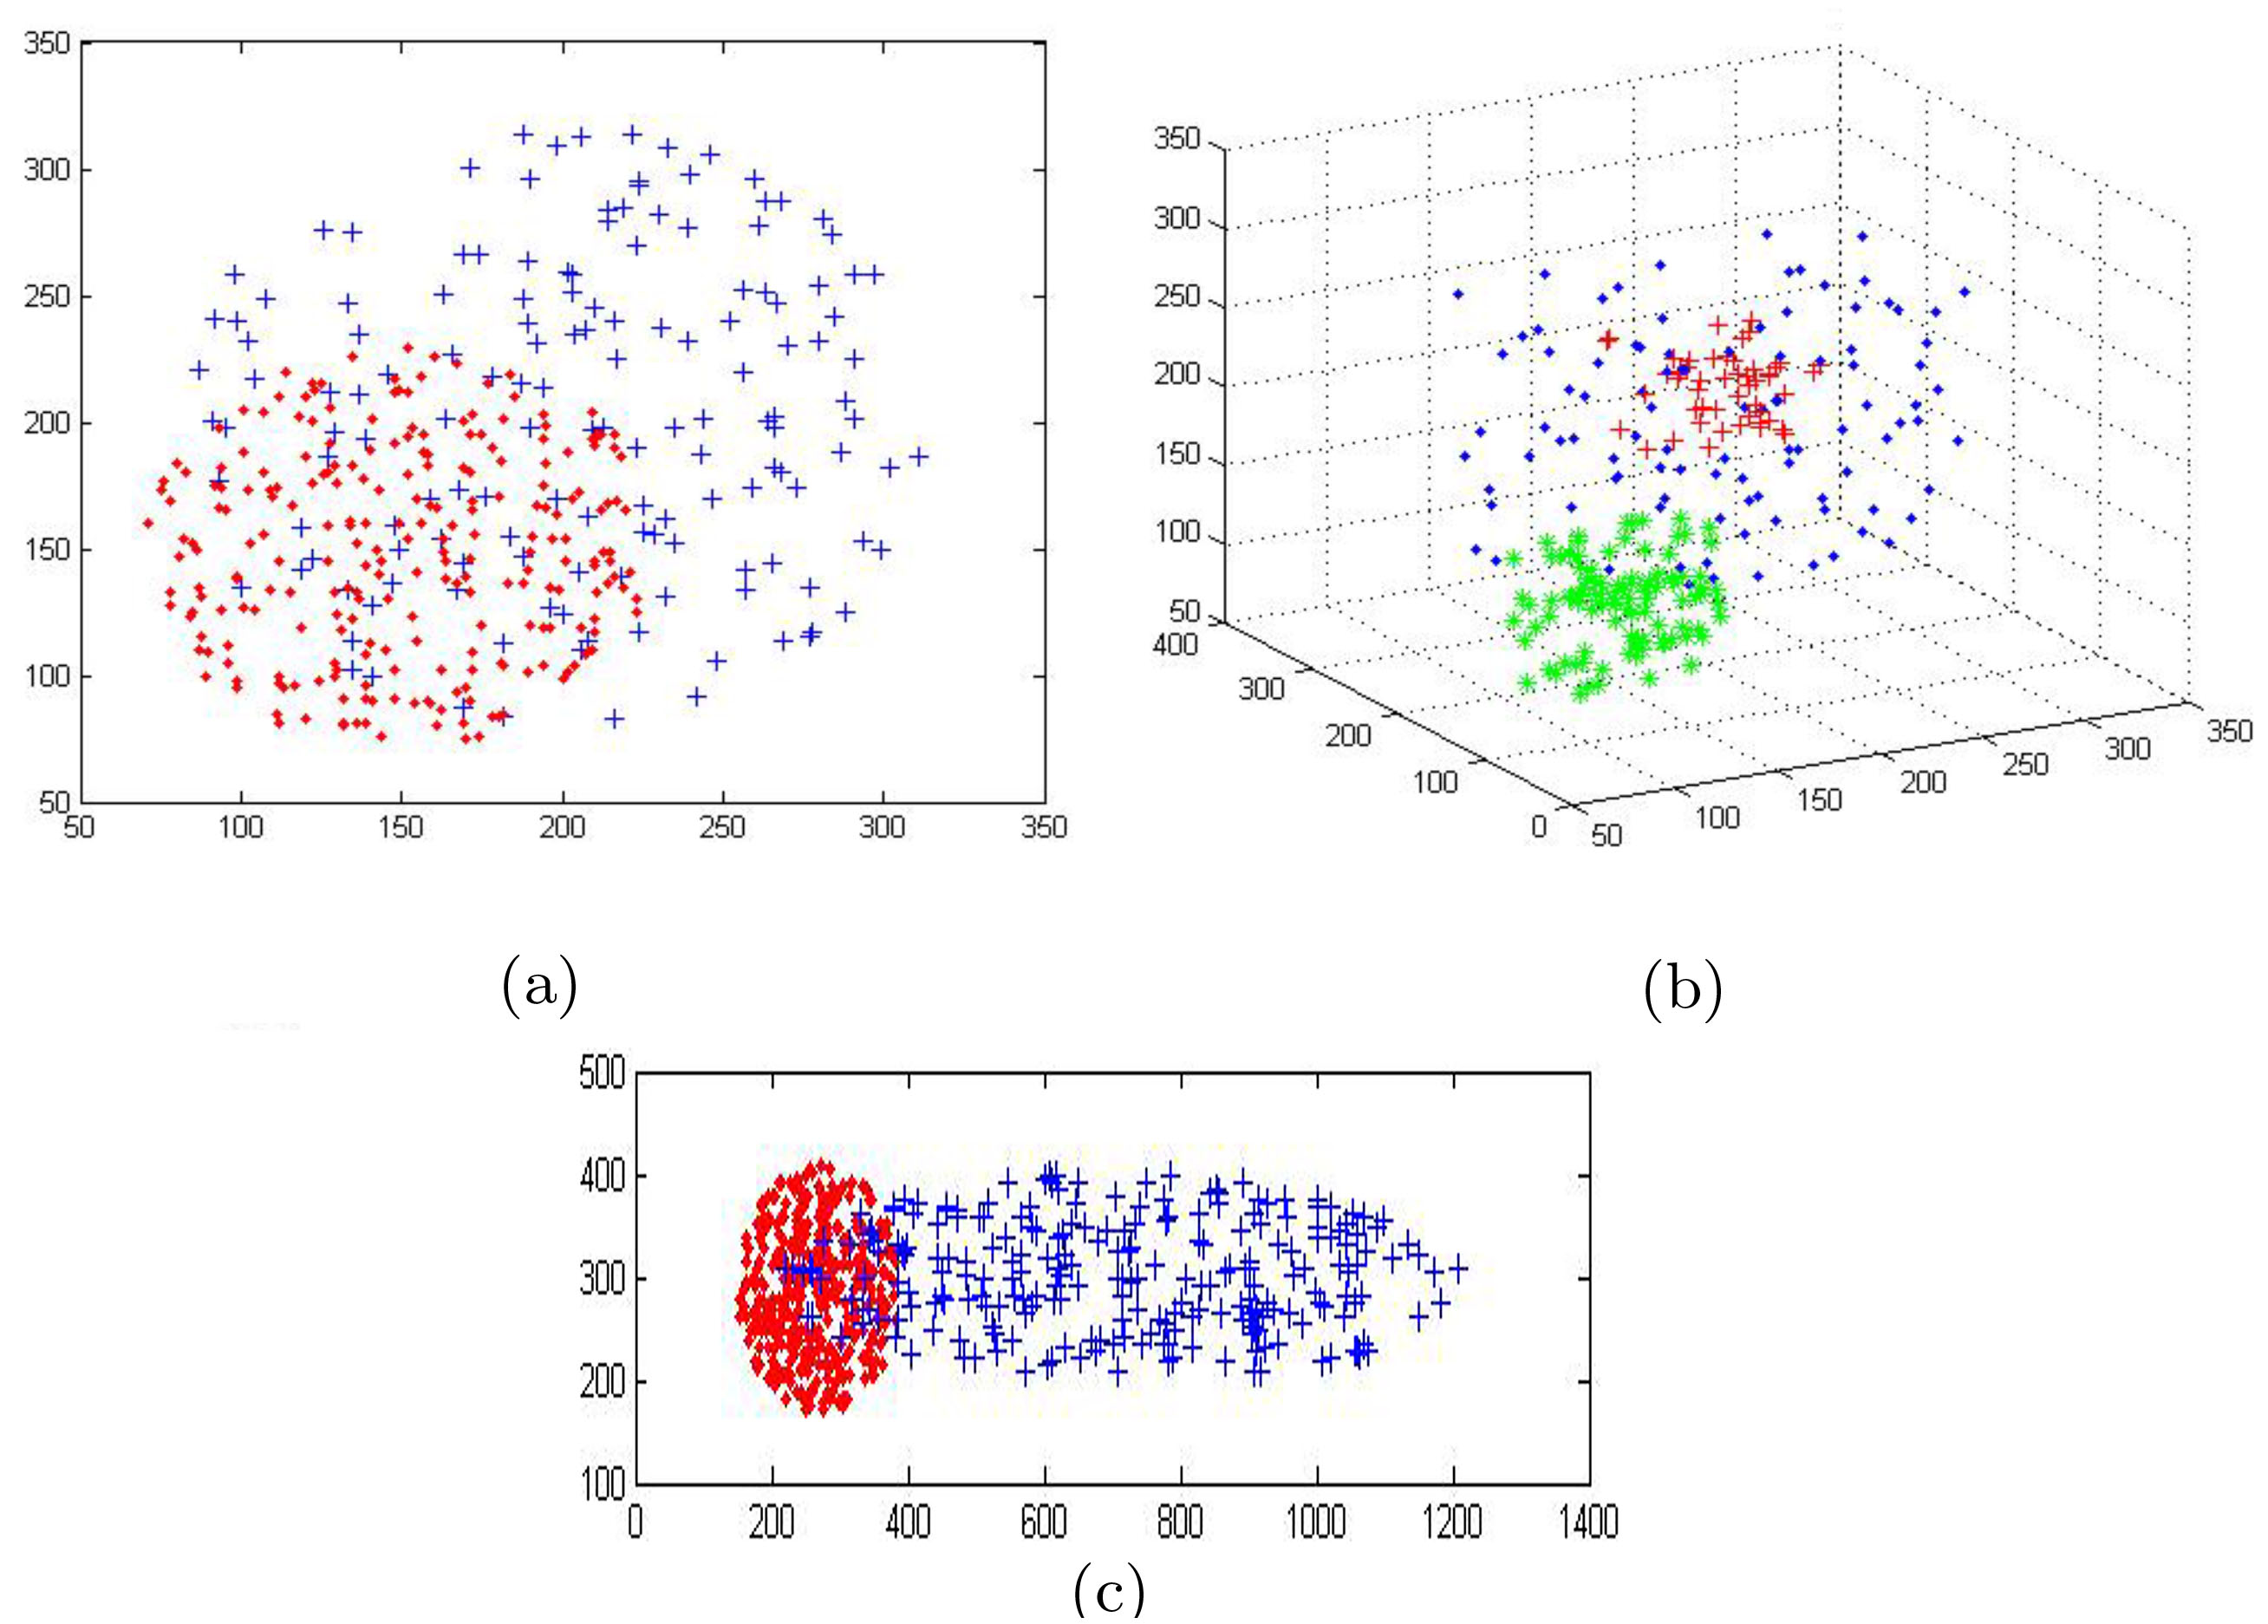
The three synthetic datasets are depicted in Fig. 3, with Table 3 indicating the skewed class distribution and corresponding density differences (as evidenced from the Radius of circle encompassing the data and the number of points within it) between the classes.
Synthetic data description
S. no.
Dataset
No. of classes
Class 1
Class 2
Class 3
Radius
Points
Radius
Points
Radius
Points
or axes
1
SYNTH_DATA1
2
120
150
80
250
–
–
2
SYNTH_BIG
2
120
12000
[550 and 100]
8000
–
–
3
SYNTH_DATA2
3
120
251
80
150
50
400
SYNTH_BIG: class 2 is an elliptic region with axes as 550 and 100.
Synthetic data (a) SYNTH_DATA1, (b) SYNTH_DATA2, and (c) SYNTH_BIG.
In Table 4, the average GM of DANN is compared with that of -NN, Fuzzy-NN (FNN) [61] and Pseudo-NN (PNN) [64] over 1, 3 and 5, whereas in case of TNN [63] is taken as 1, 2 and 3, using Leave-One-Out (LOO) strategy. The best performance is marked in bold. As SADM was developed mainly for binary classification [62], therefore we did not consider it here. Our algorithm DANN performed best in most cases.
Comparative GM averaged over ( for TNN), on multi-class imbalanced data using Leave-One-Out strategy
S. no.
Datasets
-NN
FNN
TNN
PNN
DANN
1
Glass
0.970
0.970
0.940
0.970
0.980
2
Ecoli
0.800
0.810
0.740
0.810
0.830
3
Wine
0.790
0.810
0.780
0.820
0.790
4
Vowel
0.840
0.830
0.840
0.850
0.860
5
SYNTH_DATA2
0.920
0.920
0.920
0.930
0.940
Mean
0.864
0.866
0.842
0.874
0.882
Standard deviation
0.0783
0.0729
0.0865
0.0706
0.0784
Of particular interest is dataset Ecoli, which contains some very small minority classes. Therefore GM becomes zero for all the algorithms compared. To circumvent this problem, the two classes having 2 points each were removed preceding the computation of GM. Except the wine data, where PNN performed better than the others, for the remaining datasets our algorithm DANN performed the best and resulted in an Average-GM(S.D.) value of 0.882(0.0784).
MR image segmentation
Next the algorithm DANN was employed for medical image segmentation on sequence slices (one per patient) of ten sample patient MRIs from The Cancer Genome Atlas-Low Grade Glioma (TCGA-LGG) image dataset [71]. A 13 13 window was defined around each pixel, from every MRI slice. Next features, like pixel intensity, Histogram of Oriented Gradients (HOG), standard deviation and mean value, were extracted from each such window. Leave-One-Out (LOO) strategy (one image for testing and remaining nine images for training) was used.
Table 5 represents the accuracy, GM, and the Dice score of the segmentation, as compared to the ground truth (manually segmented by radiologist). Dice score is intended to be applied on binary data. Considering the boolean definition of true positive (TP), false positive (FP), and false negative (FN), we have
It is evident that our algorithm DANN performs good segmentation of the LGG brain tumor MRI. As SMOTE or ADASYN generate imaginary points in the feature space corresponding to any image, and since the reality of such samples remains unknown, therefore we did not compare DANN with these algorithms on the image data. It is observed from Table 5 that our algorithm performed very well on serial nos. 2, 3, 4, 6, 8, with Dice greater than 0.9. The overall Average-Dice(S.D.) score was found to be 0.8830 (0.0513). A choice of 3 was made after several experiments. The overall Average-Accuracy(S.D.) 0.9706 (0.0133) and the Average-GM(S.D.) over all images was 0.9080 (0.0555). This demonstrates that the smaller class, consisting of the tumor region, was detected and delineated well.
The enhanced (histogram equalized) images were then considered for segmentation, and exhibited slight improvement as edvident from Table 6. With a high IR of 5.0182, in serial no. 4, the algorithm generates the highest accuracy, GM and Dice. Even with a small IR, in serial no. 1, the results are quite good. For a very small tumor region in serial nos. 2, 9, the value of Dice is relatively low but GM is very high. Although IR is very high in serial nos. 8, 10, yet the detection rates are found to be very good. It can be concluded from Table 6 that IR is not very important in defining the accuracy, GM and Dice, thereby establishing the robustness of our algorithm to IR.
The choice of DANN, which has performed better in all the cases, can be justified from Tables 2 and 4–6. Again Tables 5 and 6 demonstrate that there is an improvement on the segmentation after enhancement with histogram equalization on MR images. Enhancement of the images, using other techniques like filtering, noise removal, bias field correction, etc. can further improve the output.
Accuracy, GM, and Dice score of tumor segmentation using DANN on TCGA-LGG dataset
Accuracy, GM, and Dice of tumor segmentation using DANN on enhanced (histogram-equalized) TCGA-LGG dataset
S. no.
Patient ID
IR
Accuracy
GM
Dice
1
393
4.2726
0.9832
0.9693
0.9553
2
298
4.3688
0.9658
0.9072
0.8998
3
109
4.8453
0.9773
0.9476
0.9318
4
402
5.0182
0.9914
0.9806
0.9740
5
2
5.0868
0.9696
0.9490
0.9085
6
152
5.9482
0.9848
0.9582
0.9458
7
249
8.1351
0.9771
0.8943
0.8845
8
11
10.7733
0.9894
0.9544
0.9360
9
15
15.3012
0.9609
0.9530
0.7478
10
8
17.8853
0.9896
0.9312
0.8986
Mean
8.1635
0.9789
0.9445
0.9082
Standard deviation
0.0107
0.0267
0.0630
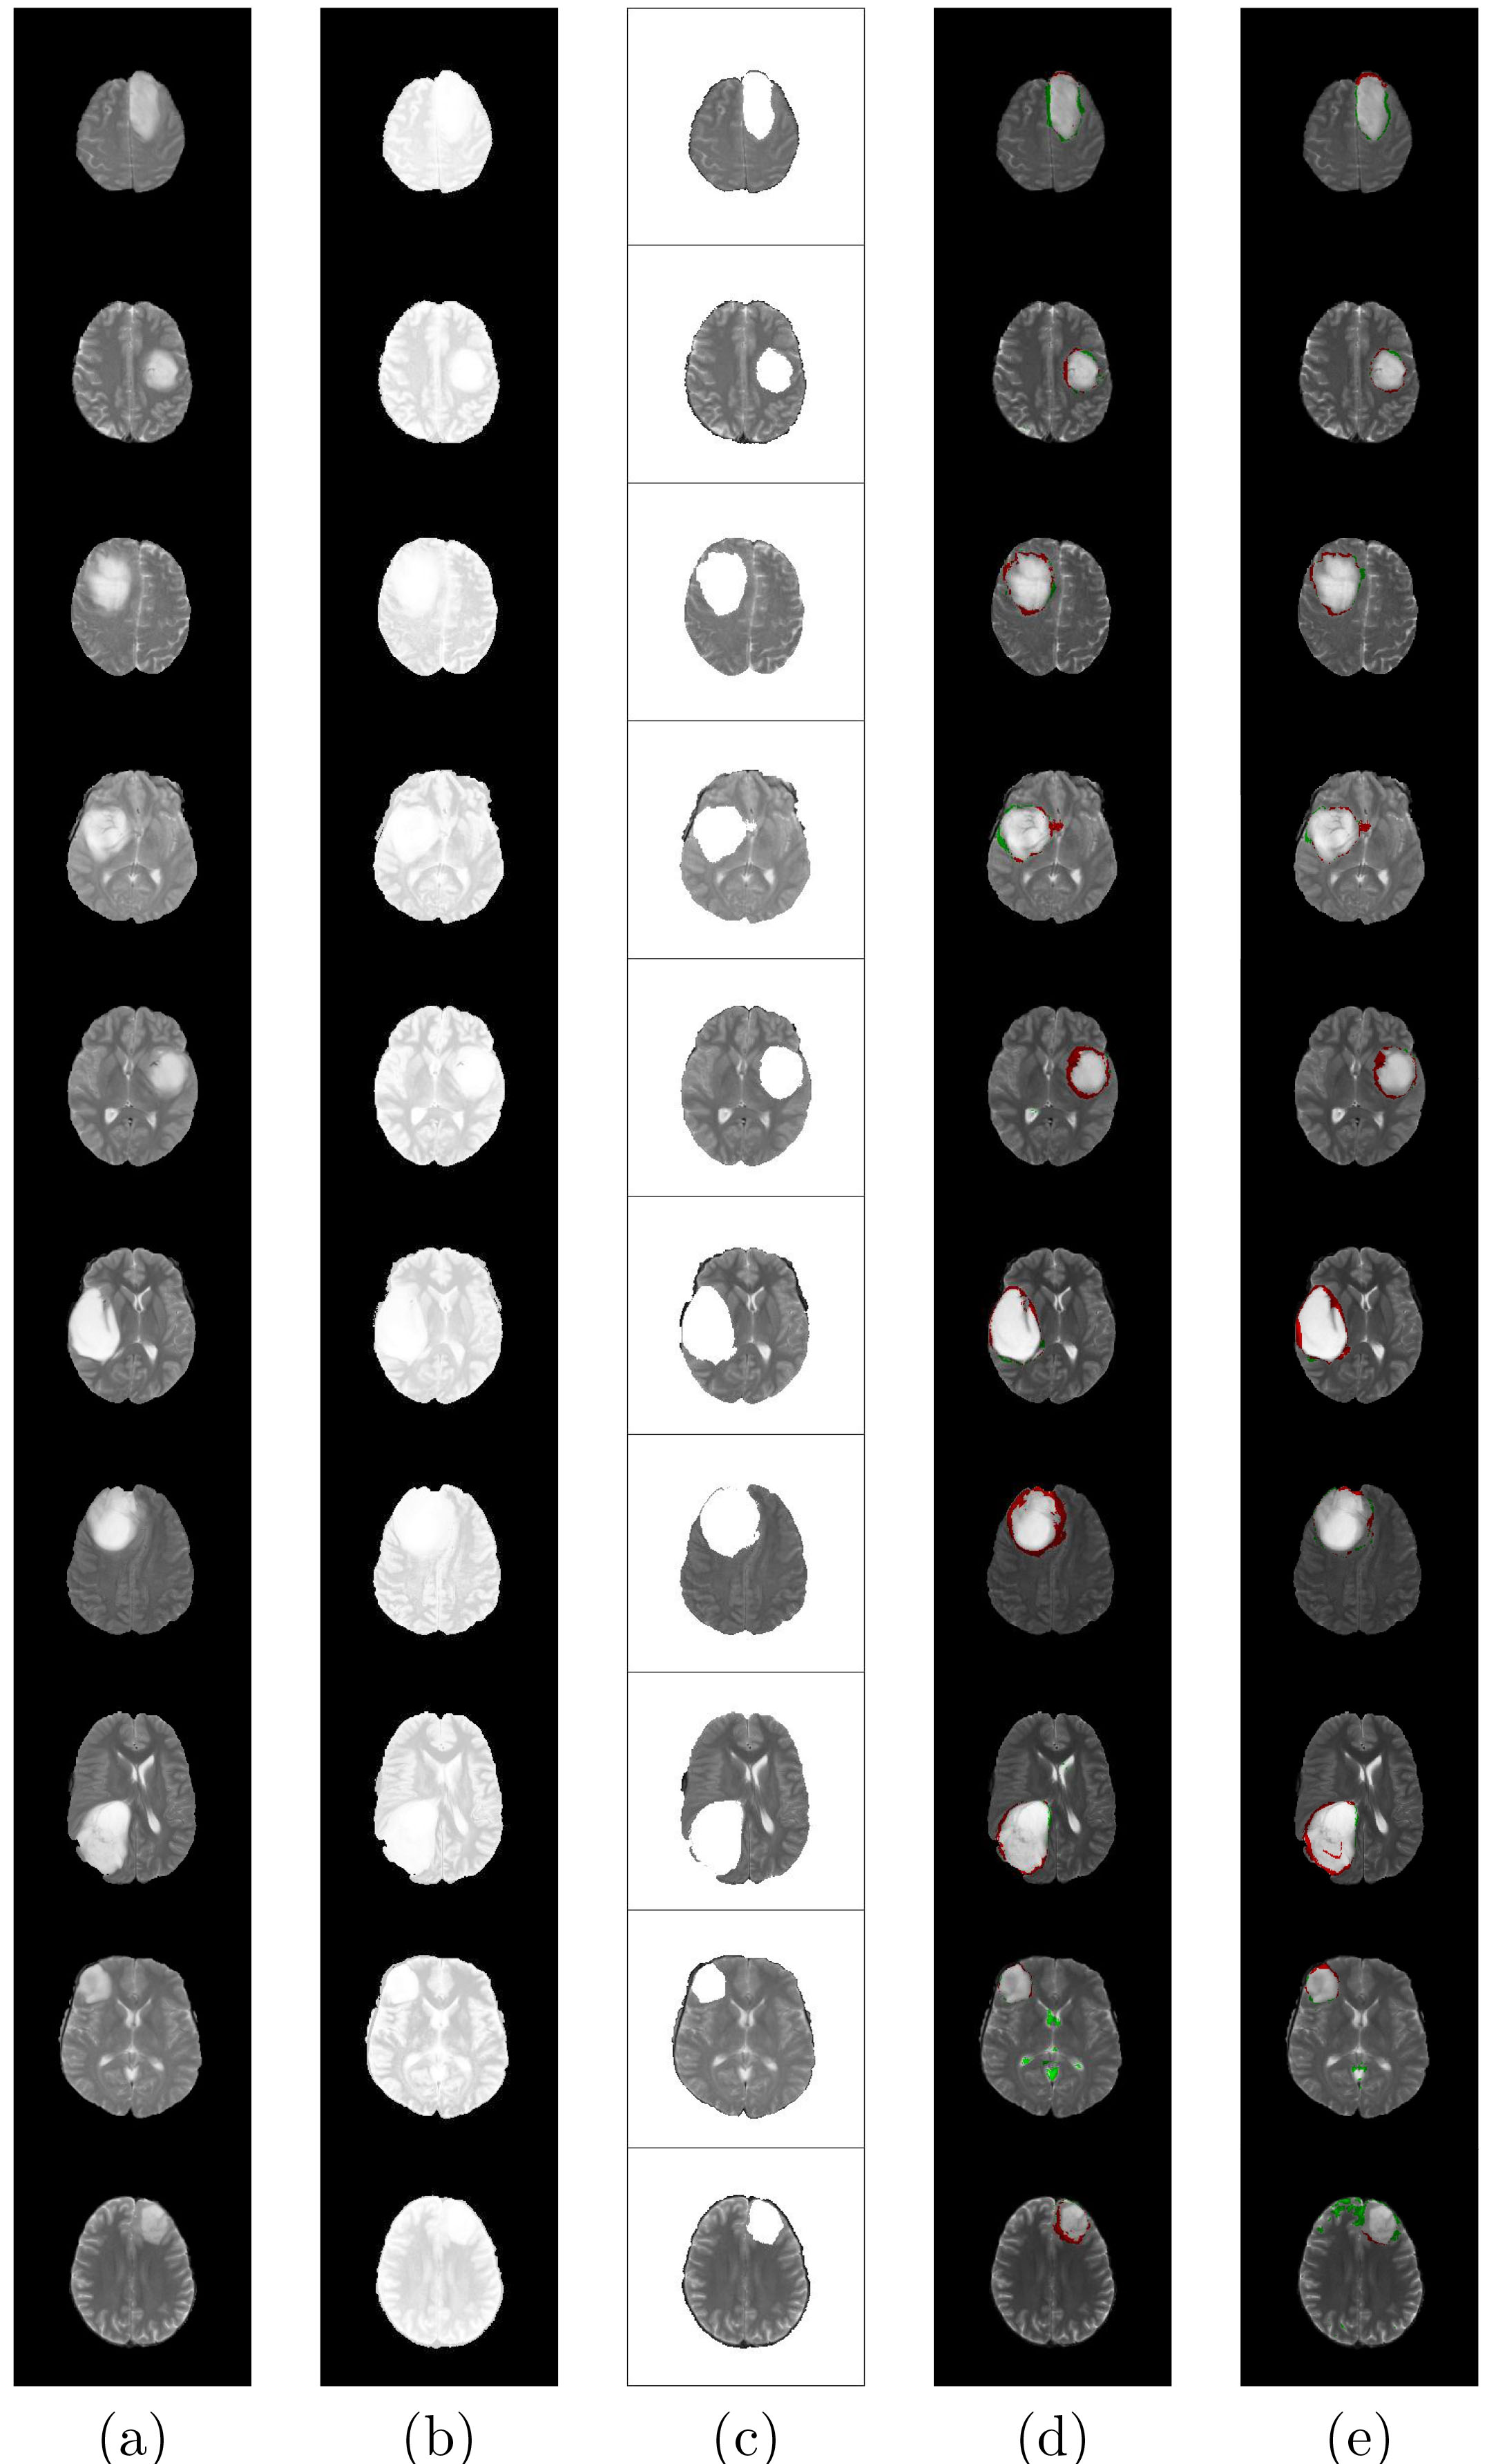
Finally the segmented images were visually compared with the ground truth in Fig. 4. The ground truth depicts the affected tumor region in white in part (c). While part (a) corresponds to the original brain MRI, in , part (b) represents the enhanced (histogram equalized) image. The segmented image, using DANN on the original image, is presented in part (d). Analogously, the output of DANN on the histogram equalized image is illustrated in part (e).The Red and Green pixels, in the segmented output of parts (d)-(e), correspond to the misclassified tumor and non-tumor regions, respectively. This corroborates the results of Tables 5 and 6, that DANN performs very well in LGG tumor segmentation of brain images.
Conclusions
Handling imbalanced data is a major problem in pattern recognition and machine learning. Although several algorithms have been developed for this purpose, yet none of them consider the concept of data density; which constitutes an inherent problem in imbalanced data. Principles of  over-sampling and under-sampling have also been employed to solve the problem of imbalanced data, but are unfortunately not suitable or appropriate in many domains. Therefore we have introduced a novel algorithm DANN, which takes care of density and adaptive distance while classifying the pattern points without employing any sampling technique. DANN was tested and compared on fifteen datasets consisting of two-classes and multiple classes, to establish its superiority. Its effectiveness on MRI image segmentation was also successfully demonstrated, both qualitatively and quantitatively.
References
1.
JapkowiczN. and StephenS., The class imbalance problem: a systematic study, Intelligent Data Analysis6(5) (2002), 429–449.
2.
HeH. and GarciaE.A., Learning from imbalanced data, IEEE Transactions on Knowledge and Data Engineering21(9) (2009), 1263–1284.
3.
GuoH.ZhouJ.WuC.-A.SheW. and XuM., Ensemble based on feature projection and under-sampling for imbalanced learning, Intelligent Data Analysis22(5) (2018), 959–980.
4.
ZouX.FengY.LiH. and JiangS., Improved over-sampling techniques based on sparse representation for imbalance problem, Intelligent Data Analysis22(5) (2018), 939–958.
5.
ChawlaN.V.BowyerK.W.HallL.O. and KegelmeyerW.P., SMOTE: synthetic minority over-ampling TEchnique, Journal of Artificial Intelligence Research16 (2002), 321–357.
6.
YangQ. and WuX., 10 challenging problems in data mining research, International Journal of Information Technology & Decision Making5(4) (2006), 597–604.
7.
LiuJ.AnY.DouR.JiH. and LiuY., Helical fault diagnosis model based on data-driven incremental mergence, Computers & Industrial Engineering (In Press) (2018), 1–16.
8.
SantosP.MaudesJ. and BustilloA., Identifying maximum imbalance in datasets for fault diagnosis of gearboxes, Journal of Intelligent Manufacturing29(2) (2018), 333–351.
9.
YangZ.TangW.ShintemirovA. and WuQ., Association rule mining-based dissolved gas analysis for fault diagnosis of power transformers, IEEE Transactions on Systems, Man, and Cybernetics, Part C (Applications and Reviews)39(6) (2009), 597–610.
10.
ZhuZ.-B. and SongZ.-H., Fault diagnosis based on imbalance modified kernel fisher discriminant analysis, Chemical Engineering Research and Design88(8) (2010), 936–951.
11.
BuzauM.-M.Tejedor-AguileraJ.Cruz-RomeroP. and G’omez-Exp’ositoA., Detection of non-technical losses using smart meter data and supervised learning, IEEE Transactions on Smart Grid (accepted) (2018).
12.
KhreichW.GrangerE.MiriA. and SabourinR., Iterative boolean combi-nation of classifiers in the ROC space: an application to anomaly detection with HMMs, Pattern Recognition43(8) (2010), 2732–2752.
13.
TavallaeeM.StakhanovaN. and GhorbaniA.A., Toward credible evalua-tion of anomaly-based intrusion-detection methods, IEEE Transactions on Systems, Man, and Cybernetics, Part C (Applications and Reviews)40(5) (2010), 516–524.
14.
FawcettT. and ProvostF., Adaptive fraud detection, Data Mining and Knowledge Discovery1(3) (1997), 291–316.
15.
MolinariF.RaghavendraU.GudigarA.MeiburgerK.M. and AcharyaU.R., An efficient data mining framework for the characterization of symptomatic and asymptomatic carotid plaque using bidimensional empirical mode decomposition technique, Medical & Biological Engineering & Computing (2018), 1–15.
16.
GaoT.HaoY.ZhangH.HuL.LiH.LiH.HuL. and HanB., Predicting pathological response to neoadjuvant chemotherapy in breast cancer patients based on imbalanced clinical data, Personal Ubiquitous Computing22(5–6) (2018), 1039–1047.
17.
PliakosK. and VensC., Mining features for biomedical data using clustering tree ensembles, Journal of Biomedical Informatics85 (2018), 40–48.
18.
NejatianS.ParvinH. and FarajiE., Using sub-sampling and ensemble clustering techniques to improve performance of imbalanced classification, Neurocomputing276 (2018), 55–66.
19.
MazurowskiM.A.HabasP.A.ZuradaJ.M.LoJ.Y.BakerJ.A. and TourassiG.D., Training neural network classifiers for medical decision making: the effects of imbalanced datasets on classification performance, Neural Networks21(2) (2008), 427–436.
20.
LiuR.HallL.O.BowyerK.W.GoldgofD.B.GatenbyR. and AhmedK.B., Synthetic minority image over-sampling technique: how to improve AUC for glioblastoma patient survival prediction, in: Systems, Man, and Cybernetics (SMC), 2017 IEEE International Conference on, 2017, pp. 1357–1362.
21.
LiuY.-H. and ChenY.-T., Total margin based adaptive fuzzy support vector machines for multiview face recognition, in: Proceedings of IEEE International Conference on Systems, Man and Cybernetics, IEEE, Vol. 2, 2005, pp. 1704–1711.
22.
LiC. and LiuS., A comparative study of the class imbalance problem in Twitter spam detection, Concurrency and Computation: Practice and Experience30(5) (2018), e4281.
23.
XuC.WangY.BaoX. and LiF., Vehicle classification using an imbalanced dataset based on a single magnetic sensor, Sensors18(6) (2018), 1690.
24.
HeydariS.S. and MountrakisG., Effect of classifier selection, reference sample size, reference class distribution and scene heterogeneity in per-pixel classification accuracy using 26 Landsat sites, Remote Sensing of Environment204 (2018), 648–658.
25.
Thanh NoiP. and KappasM., Comparison of random forest, k-nearest neighbor, and support vector machine classifiers for land cover classification using Sentinel-2 imagery, Sensors18(1) (2017), 18.
26.
CastellanosF.J.Valero-MasJ.J.Calvo-ZaragozaJ. and Rico-JuanJ.R., Oversampling imbalanced data in the string space, Pattern Recognition Letters103 (2018), 32–38.
27.
RyuH.J.MitchellM. and AdamH., Improving smiling detection with race and gender diversity, arXiv preprint arXiv:171200193. (2017).
28.
HuangC.LiY.LoyC.C. and TangX., Deep imbalanced learning for face recognition and attribute prediction, arXiv preprint arXiv:180600194. (2018).
29.
WangX.LiS.TangT.WangX. and XunJ., Intelligent operation of heavy haul train with data imbalance: a machine learning method, Knowledge-Based Systems (accepted) (2018).
30.
LiuJ. and ZioE., A scalable fuzzy support vector machine for fault detection in transportation systems, Expert Systems with Applications102 (2018), 36–43.
31.
JapkowiczN. et al., Learning from imbalanced data sets: A comparison of various strategies, in: Proceedings of AAAI Workshop on Learning from Imbalanced Data Sets, Menlo Park, CA, Vol. 68, 2000, pp. 10–15.
32.
Van HulseJ.KhoshgoftaarT.M. and NapolitanoA., Experimental perspectives on learning from imbalanced data, in: Proceedings of the 24th International Conference on Machine Learning, ACM, 2007, pp. 935–942.
33.
BatistaG.E.PratiR.C. and MonardM.C., A study of the behavior of several methods for balancing machine learning training data, ACM SIGKDD Explorations Newsletter6(1) (2004), 20–29.
34.
DouzasG. and BacaoF., Effective data generation for imbalanced learn- ing using conditional generative adversarial networks, Expert Systems with Applications91 (2018), 464–471.
35.
ChawlaN.V.JapkowiczN. and KotczA., Special issue on learning from imbalanced data sets, ACM SIGKDD Explorations Newsletter6(1) (2004), 1–6.
36.
KoziarskiM. and WożniakM., CCR: a combined cleaning and resampling algorithm for imbalanced data classification, International Journal of Applied Mathematics and Computer Science27(4) (2017), 727–736.
37.
HanH.WangW.-Y. and MaoB.-H., Borderline-SMOTE: a new over-sampling method in imbalanced data sets learning, Advances in Intelligent Computing (2005), 878–887.
38.
HeH.BaiY.GarciaE.A. and LiS., ADASYN: ADAptive SYNthetic sampling approach for imbalanced learning, in: Proceedings of IEEE International Joint Conference on Neural Networks (IJCNN), 2008, pp. 1322–1328.
39.
YenS.-J. and LeeY.-S., Cluster-based under-sampling approaches for imbalanced data distributions, Expert Systems with Applications36(3) (2009), 5718–5727.
40.
NikpourB. and Nezamabadi-pourH., HTSS: a hyper-heuristic training set selection method for imbalanced data sets, Iran Journal of Computer Science1(2) (2018), 109–128.
41.
Garc’ıaS.ZhangZ.-L.AltalhiA.AlshomraniS. and HerreraF., Dynamic ensemble selection for multi-class imbalanced datasets, Information Sciences445 (2018), 22–37.
42.
FengW.HuangW. and RenJ., Class imbalance ensemble learning based on the margin theory, Applied Sciences8(5) (2018), 815.
43.
MullickS.S.DattaS. and DasS., Adaptive learning-based k-nearest neighbor classifiers with resilience to class imbalance, IEEE Transactions on Neural Networks and Learning Systems (accepted) (2018).
44.
CadenasJ.M.GarridoM.C.Mart’ınezR.MuñozE. and BonissoneP.P., A fuzzy k-nearest neighbor classifier to deal with imperfect data, Soft Computing22(10) (2018), 3313–3330.
45.
ZhangS.LiX.ZongM.ZhuX. and WangR., Efficient kNN classification with different numbers of nearest neighbors, IEEE Transactions on Neural Networks and Learning Systems29(5) (2018), 1774–1785.
46.
ZhaoX.ZhangJ. and QinX., kNN-DP: handling data skewness in kNN joins using MapReduce, IEEE Transactions on Parallel and Distributed Systems29(3) (2018), 600–613.
47.
ZhangX.LiY.KotagiriR.WuL.TariZ. and CherietM., kRNN: k rare-class nearest neighbour classification, Pattern Recognition62 (2017), 33–44.
48.
LinW.-J. and ChenJ.J., Class-imbalanced classifiers for high-dimensional data, Briefings in Bioinformatics14(1) (2012), 13–26.
49.
SunY.WongA.K. and KamelM.S., Classification of imbalanced data: a review, International Journal of Pattern Recognition and Artificial Intelligence23(4) (2009), 687–719.
50.
GalarM.FernandezA.BarrenecheaE.BustinceH. and HerreraF., A review on ensembles for the class imbalance problem: Bagging-, boosting-, and hybrid-based approaches, IEEE Transactions on Systems, Man, and Cybernetics, Part C (Applications and Reviews)42(4) (2012), 463–484.
51.
HaixiangG.YijingL.ShangJ.MingyunG.YuanyueH. and BingG., Learning from class-imbalanced data: review of methods and applications, Expert Systems with Applications73 (2017), 220–239.
52.
StefanowskiJ. and WilkS., Combining rough sets and rule based classifiers for handling imbalanced data, Fundamenta Informaticae72(1–3) (2006).
53.
NapieralaK. and StefanowskiJ., Post-processing of BRACID rules induced from imbalanced data, Fundamenta Informaticae148(1–2) (2016), 51–64.
54.
CoverT. and HartP., Nearest neighbor pattern classification, IEEE Transactions on Information Theory13(1) (1967), 21–27.
55.
HellmanM.E., The nearest neighbor classification rule with a reject option, IEEE Transactions on Systems Science and Cybernetics6(3) (1970), 179–185.
56.
FukunagaK. and HostetlerL., K-nearest-neighbor bayes-risk estimation, IEEE Transactions on Information Theory21(3) (1975), 285–293.
57.
DudaniS.A., The distance-weighted k-nearest-neighbor rule, IEEE Transactions on Systems, Man, and Cybernetics6(4) (1976), 325–327.
58.
BaileyT. and JainA.K., A note on distance-weighted k-nearest neighbor rules, IEEE Transactions on Systems, Man, and Cybernetics8(4) (1978), 311–313.
JóówikA., A learning scheme for a fuzzy k-NN rule, Pattern Recognition Letters1(5–6) (1983), 287–289.
61.
KellerJ.M.GrayM.R. and GivensJ.A., A fuzzy k-nearest neighbor algozrithm, IEEE Transactions on Systems, Man, and Cybernetics15(4) (1985), 580–585.
62.
WangJ.NeskovicP. and CooperL.N., Improving nearest neighbor rule with a simple adaptive distance measure, Pattern Recognition Letters28(2) (2007), 207–213.
63.
BasuT. and MurthyC.A., Towards enriching the quality of k-nearest neighbor rule for document classification, International Journal of Machine Learning and Cybernetics5(6) (2014), 897–905.
64.
ZengY.YangY. and ZhaoL., Pseudo nearest neighbor rule for pattern classification, Expert Systems with Applications36(2) (2009), 3587–3595.
65.
Fern’andezA.Del JesusM.J. and HerreraF., Multi-class imbalanced data-sets with linguistic fuzzy rule based classification systems based on pairwise learning, in: Proceeding of International Conference on Information Processing and Management of Uncertainty in Knowledge-Based Systems, Springer, 2010, pp. 89–98.
66.
WangS. and YaoX., Multiclass imbalance problems: Analysis and poten- tial solutions, IEEE Transactions on Systems, Man, and Cybernetics, Part B (Cybernetics)42(4) (2012), 1119–1130.
67.
Alcal’a-FdezJ.Fern’andezA.LuengoJ.DerracJ.Garc’ıaS.S’anchezL. and HerreraF., KEEL data-mining software tool: data set repository, integration of algorithms and experimental analysis framework, Journal of Multiple-Valued Logic and Soft Computing17(2–3) (2011), 255–287.
68.
DheeruD. and Karra TaniskidouE., UCI Machine Learning Repository, 2017. http://archive.ics.uci.edu/ml.
69.
PalS.K. and Dutta MajumderD., Fuzzy sets and decision making approaches in vowel and speaker recognition, IEEE Transactions on Systems, Man, and Cybernetics7(8) (1977), 625–629.
70.
BarandelaR.S’anchezJ.S.Garc’ıaV. and RangelE., Strategies for learning in class imbalance problems, Pattern Recognition36(3) (2003), 849–851.
71.
ClarkK.VendtB.SmithK.FreymannJ.KirbyJ.KoppelP.MooreS.PhillipsS.MaffittD.PringleM. et al., The cancer imaging archive (TCIA): maintaining and operating a public information repository, Journal of Digital Imaging26(6) (2013), 1045–1057.