




Abstract
In this paper, we apply sentiment analysis methods in the context of the first round of the 2017 Chilean elections. The purpose of this work is to estimate the voting intention associated with each candidate in order to contrast this with the results from classical methods (e.g., polls and surveys). The data are collected from Twitter, because of its high usage in Chile and in the sentiment analysis literature. We obtained tweets associated with the three main candidates: Sebastián Piñera (SP), Alejandro Guillier (AG) and Beatriz Sánchez (BS).
For each candidate, we estimated the voting intention and compared it to the traditional methods. To do this, we first acquired the data and labeled the tweets as positive or negative. Afterward, we built a model using machine learning techniques. The classification model had an accuracy of 76.45% using support vector machines, which yielded the best model for our case. Finally, we use a formula to estimate the voting intention from the number of positive and negative tweets for each candidate.
For the last period, we obtained a voting intention of 35.84% for SP, compared to a range of 34–44% according to traditional polls and 36% in the actual elections. For AG we obtained an estimate of 37%, compared with a range of 15.40% to 30.00% for traditional polls and 20.27% in the elections. For BS we obtained an estimate of 27.77%, compared with the range of 8.50% to 11.00% given by traditional polls and an actual result of 22.70% in the elections. These results are promising, in some cases providing an estimate closer to reality than traditional polls. Some differences can be explained due to the fact that some candidates have been omitted, even though they held a significant number of votes.
Introduction
Every four years, around 14 million Chileans are called to vote in the presidential elections. In the last two elections, several candidates have run for the presidency and the Chilean society has a varied opinion regarding the candidates and the actual election process. This poses the following question: how could we analyze the different opinions of citizens with respect to current issues in our society? The traditional answer to this question is using surveys and polls, such as the Chilean opinion polls by the Center of Public Studies (CEP). However, nowadays social networks offer a different perspective for the analysis of public opinion, by using the tools and data provided by these.
In this context, one of the main social networks used today is Twitter, with around 400 million users registered in more than 190 countries. In particular, a large number of Chilean people use Twitter recurrently [33]. Thus, we would like to analyze if the opinions expressed by active users on this platform could actually be representative enough for Chilean society as a whole with respect to the 2017 Chilean elections.
In order to do this, it is necessary to obtain data in the form of a set of tweets for each one of the candidates analyzed. These tweets must be either in favor or against a candidate, and in our case study we have manually labeled them as such. Tweets that could not be considered negative or positive were discarded. This data is then converted into a voting intention estimate for each candidate. Afterward, the previous results must be compared with traditional methods such as opinion polls and surveys and against the actual results of the elections. Depending on the results, this could imply that Twitter effectively reflects the general opinion of the populace in terms of voting intention, thus allowing us to automatically extract this information in the future for further applications.
In order to collect the various tweets, we use the Twitter Application Programming Interface (API). This API allows us to extract tweets from a range of dates. Thus, we extract tweets from the last two months of the elections period before the first round, in batches of two weeks. This data is analyzed using a Python program alongside machine learning and natural language processing libraries, such as scikit-learn and nltk. In order to do this we require a training data set and a testing data set, where the training set must be previously labeled so that the machine learning models to learn from these examples. Once the results have been obtained, we analyze the results and compare them with traditional methods.
The contributions of our work are twofold: first, we propose a formula to find the voting intention in terms of probabilities, this formula has been designed in this work and hasn’t been published before; second, we analyze a new Twitter data set that has been collected exclusively for this work. It should also be noted that this data set is in Spanish, while most works in sentiment analysis are in English.
The rest of this paper is organized as follows. In Section 2 we focus on related work and background information. In Section 3 we give a detailed view of the materials and methods used in this study. Afterward, in Section 4 we present the results and the corresponding discussion. Finally, in Section 5 we close the article with the main conclusions of our study.
Related work and background information
Traditional polls
Organizations must often use information in order to carry out their tasks. However, sometimes this is not feasible, for two possible reasons: the information either does not exist or if it exists it is too old. Thus, analyzing the voting intention in political elections requires new data, as this data from previous years may not be reliable. In view of this problem, new information must be acquired, known as primary information. This information must be obtained through qualitative or quantitative methods [13].
In the context of this work, where we seek to estimate the voting intention in the elections, there would traditionally be several ways to obtain this information: meetings with citizens able to vote, focus groups, interviews with sizable groups, house-by-house polling, telephone polling, and other survey methods [13].
Given the previous considerations, it must be noted that all these tasks require a non-trivial amount of resources in order to obtain a decent amount of trustworthy information to estimate the voting intention of the populace. Thus, considering these observations, it would be desirable to see if social networks could provide an adequate estimation of voting intention, in order to either partially replace or supplement the information given by traditional methods.
Sentiment analysis
Ever since the beginning of the 21st Century, we can notice a significant increase in the usage of the internet and its associated tools. In this context, there is now a massive use of social networks and personal blogs. These pages had a significant increase in traffic and usage in the last decade, where each of the registered users among the different platforms present in the market can now express their sentiments, emotions, opinions, activities, and friendships, among other elements. With these advances, it is now possible to learn the opinion of people about a determined product, entity or a piece of news just by browsing these platforms.
According to studies done in the United States, people use the internet to obtain information and opinions from their own community, external groups, and organizations, as well as sharing their own opinion and arguing about it [24]. In this manner, we can appreciate that the opinions presented on the internet are an important and significant part of the virtual life of people.
For the purpose of this work, we will use Twitter as our source of data. Currently, Twitter is one of the most used micro-blogging platforms. This has made Twitter a good source of information to perform market and social studies. From a sentiment analysis perspective, there are some important characteristics of Twitter that must be highlighted:
Short text: Since the number of characters is limited to 280 (originally only 140), the texts can be considered to be a single sentence or a simple grammatical construct. However, this also causes some of the harder challenges, since character limitations lead to modifications to standard written language. Hashtags: Twitter is used through a variety of media, including SMS and phone applications. Given this flexibility and the character limitations mentioned previously, the usage of hashtags has become popular on Twitter, being one of the main characteristics of the tweets themselves, since on average there are one or two hashtags per tweet.
Sentiment analysis is a field that uses techniques from natural language processing, text analysis and machine learning methods in order to classify subjective elements of a text [19]. For example, we can use sentiment analysis to determine if a given text contains a positive opinion or a negative opinion on some topic. These techniques have been in use for around 15 years and since its inception, they have been used in market intelligence [18], box office prediction for feature films [20], consumer satisfaction evaluation [27], among others [19, 26].
When implementing sentiment analysis algorithms for classification on Twitter, there are several challenges that must be overcome in order to obtain good results [22], in particular:
It is required to carefully filter the different queries so that the retrieved information is as close as possible to the sought results. This is particularly important due to having a limited set of tweets on which to operate. This filtering could be affected by the specific domain that we are interested in, information about our desired search results and the help of a domain expert can be used to refine the queries. In our case we simply require finding Tweets about the candidates, so the queries are relatively simple. We must manually determine the polarity of each tweet by assigning labels (positive or negative). This is a time-consuming process that is prone to error, thus it must be done very carefully. This, in turn, allows us to train the machine learning model. The data annotation phase in machine learning problems is usually one of the most time consuming ones given that if no previous model or data set exists, it won’t be possible to automate this easily. The labeling of the results is subjective, since different people will perceive sentiment in a text in different ways, to reduce potential inconsistency problems we independently labeled the data and then merged the results, analyzing conflicting labels in a case-by-case manner. It is necessary to determine if the message contained in each tweet is actually an opinion associated with a person, otherwise it does not contribute to the purpose of our study. While in general this could require filtering institutions and organization who might have mentioned the candidates (this could be automated by having a list of Twitter handles associated with such organizations). However, for the purposes of estimating the voting intention, it might be a good idea to leave the tweets that are not directly coming from a person, because intuitively tweets made by institutions and organizations could be correlated with the public perception of the candidate. Thus, for purposes of our work, we did not filter these results. We must recognize patterns that do not provide additional or useful information, such as idiomatic expressions, orthographic mistakes, typos, abbreviations and letter repetitions. Furthermore, it could be necessary to remove some of these patterns in order to obtain a better machine learning model. Some of these challenges were handled in the data pre-processing step and relatively simple to correct (e.g., letter repetitions), while others would require a higher investment in terms of pre-processing and could distort the original message if handled incorrectly (e.g., orthographic mistakes and typos).
The idea of applying sentiment analysis on Twitter for political purposes is not new, as is evidenced by several papers on the topic [37, 8, 12, 9, 31]. We present a general overview of the literature on this topic.
The work of Paltoglou et al. [21] compares various classification methods and sentiment analysis techniques in different social networks (Digg, MySpace, and Twitter). From this research we take three important points, there are several methods that could be applied to analyze Twitter data (e.g., lexical-based methods and machine learning methods) that have different advantages and disadvantages. On the other hand, SVM and Naive Bayes have an acceptable performance, obtaining over 70% accuracy in their study. Finally, it should be noted that among the analyzed social networks, Twitter provided the best results, which makes it a solid platform on which to use methods proposed in [35].
On the other hand, in the work of Sarlan et al. [32], the authors study the possibility of using social networks in sentiment analysis through a lexical method. In particular, they use Twitter. The authors provide an overview of the state of the art, indicating that several works use SVM and artificial neural networks in their analyses.
In other research, there are comparisons among different methods, such as in [6]. In this work, the methods SVM and SentiStrength (a classifier based on dictionaries) are compared, exposing advantages and disadvantages of each one for classification tasks. Their case study was performed mainly on Twitter data, and in general, most results are around 75% accuracy for both classifiers.
In the work described by Rosa et al. [29] they provide a proposal of hybrid methods that combine SVM and convolutional neural networks (CNN), where the hybrid method obtains the best results. In particular, the authors obtain an accuracy of 61.7% with SVM, 64.1% with CNN and 64.7% with the hybrid method. Furthermore, the authors describe the difficulties that classical classification methods face when applied on neutral tweets, which cause accuracy to be negatively affected. In this context, this further justifies our exclusion of neutral tweets in this work.
Singh and Singh [34] present a thorough literature review on the topic of election prediction using Twitter. They approach two research questions: first, they seek to determine if any technique or model is efficient enough to predict the election outcome for any country just from tweets; second, they seek to determine the major challenges of these predictions. They conclude that while methods that count positive tweets gave the maximum number of correct predictions, they still failed to produce a 100% success rate. Now, achieving a 100% success rate with predictions is unrealistic in practical and statistical terms, but maximizing this success rate is a more realistic goal. In this sense, it makes sense that our method also takes into account positive tweets (and by logical extension, negative tweets).
It should be noted that all the studies shown in the review by Singh and Singh have a high number of tweets in their data sets, ranging from 10 thousand to 400 million [34], contrast this with our study which has, after filtering, only around 1 thousand tweets. In this context, we can mention the study by Budiharto and Meiliana [11], which showed a system to predict elections results from Twitter data using sentiment analysis. Their system was implemented using the TextBlob library which allowed them to find the polarity of the tweets. Their work focused on the Indonesian presidential election and their data set only consisted of 350 tweets, of which 250 were used for training and 100 for testing. In comparison, this is less than half our number of tweets.
Furthermore, it should be noted that there are some works that showcase the shortcomings of attempting to predict elections and politics with Twitter. In particular, Gayo et al. [14] expose different problems associated with this line of work on Twitter. They also provide an exhaustive literature review. From this analysis, they warn about the inherent bias in the population that uses Twitter, and that they are not necessarily representative of the general populace and its opinions do not necessarily reflect the realities of society. In this context, the author recommends using robust classifiers in order to ameliorate these shortcomings, especially considering the amount of humor and sarcasm in the tweets, which are hard to detect for machines. While this is the case, for purposes of our case study, we believe that classical SVM and NB should provide a good enough performance in order to illustrate our proposal. Furthermore, given that we do not have extensive amounts of data, we have refrained from using deep learning models, such as recurrent or convolutional neural networks.
On the other hand, it should be noted that there are some limitations to using Twitter alone to predict elections, so traditional methods should also be used. Thus, by taking all results in conjunction, a more holistic view of the elections and voting intention could be obtained. A similar view can be found in the work of Tsakalidis et al. [36], where the authors used Twitter sentiment analysis to predict the results from three elections in the European Union in the year 2014. They monitored political discussions on Twitter and performed an analysis of the different political parties over time. They also aggregated information from opinion polls in order to provide a baseline for their method. Based on this information they attempted to predict the results from the elections, publishing their predictions before the elections ended for one of the countries. They obtained low error rates, further reinforcing the idea that Twitter is adequate for the purposes of predicting elections when applied in conjunction with traditional information.
Finally, our main contribution in this context corresponds to the development of the Voting Intention Estimate formula and its application to the analysis of the 2017 Chilean elections. The Voting Intention Estimate formula presented in this paper provides a novel way to obtain predictions for elections based on Twitter data. Furthermore, the formula also has the important property of being a Probability Distribution, which could be interpreted as the chance of winning for each candidate. The use of this formula is illustrated in detail using a data set of tweets related to the 2017 Chilean elections.
Materials and methods
Tools and libraries
In the implementation of our analysis, we required several tools and libraries. These libraries were used for data extraction as well as data analysis. In the case of extraction, we used JavaScript with its standard libraries in order to make simple queries to various tools established on the Internet. On the other hand, for data analysis, we used the Python programming language with various libraries such as NLTK, Scikit-learn, Pymoji and libraries to read files in Comma-Separated Values (CSV) format. Furthermore, for the extraction of data from social networks, we used the interface provided by Twitter, performing several queries that we answered with sets of tweets for each user.
Data extraction
Data organization
We first summarize the total number of tweets obtained for each candidate. We also include the number of tweets that were deleted due to repetition (we kept one example of each of the repeated tweets). Also, we include the tweets that were deleted after the pre-processing steps because they were either empty or contained irrelevant content for our analysis. Finally, we include the actual number of valid tweets out of all the collected tweets. This is all shown in Fig. 1.
Summary of the retrieved tweets before and after the cleansing process.
The Twitter API is the main tool used for the extraction of tweets, it was used in conjunction with JavaScript. This is done through queries and filters based on date ranges. We used three similar queries, one for each candidate. They were made similar in order to minimize the variation in terms of kind of content. The queries themselves are shown here (in Spanish):
Sebastián Piñera: (@sebastianpinera OR Pinera) (#VotoAVoto OR #Elecciones2017Chile OR elecciones 2017 OR #Elecciones2017chile OR #TiemposMejores) Alejandro Guillier: (@guillier OR Guillier) (#VotoAVoto OR #Elecciones2017Chile OR elecciones 2017 OR Chile OR #Elecciones2017chile OR Alejandro) Beatriz Sánchez: (@BeaSanchezYTu OR #BeatrizSanchez OR BeatrizSanchez)
Since Twitter only returns a maximum of 100 tweets in each request, it was also necessary to separate our two-week period in sub-periods in order to be able to extract a more well-distributed sample. Each period was separated in the following manner:
Two-week period 1 (September):
01 to 04, 05 to 09, 10 to 13, and 14 to 15. Two-week period 2 (September):
16 to 19, 20 to 24, 25 to 28, and 29 to 30. Two-week period 3 (October):
01 to 04, 05 to 09, 10 to 13, and 14 to 15- Two-week period 4 (October):
16 to 19, 20 to 24, 25 to 28, and 29 to 31.
This separation was only done for purposes of retrieving the tweets, the analysis was done at the level of two-week periods. After creating the script, we used a cronjob in order to execute the script repeatedly over time in order to comply with the limit of queries for each time period imposed on the Twitter API.
After the initial download of data using the Twitter API, it is necessary to store and organize all the retrieved tweets. This was done by the Twitter API using the JSON (JavaScript Object Notation) format [1], which contained additional information that we deemed unnecessary, such as the users that posted the tweet. However, since we only required the contents of the tweet, we filtered the required data and created a CSV file that contained only the text of each tweet, thus our data set is now anonymous.
For each candidate and two-week period, after filtering the tweets according to the procedure detailed on the next section, we obtained a CSV file with the tweets in one column and their labels (0 for negative and 1 for positive) in another column. We performed this process for each candidate, obtaining a total of twelve files (3 candidates and 4 two-week periods for each candidate).
Basic pre-processing
In order to clean the text before training our model, we apply some pre-processing steps. In particular, among the methods that are usually used for pre-processing in sentiment analysis, we can find stop words removal, which deletes words that do not provide additional information to the message. These words are usually articles, prepositions and connectors [17]. To do this a list of stop words is used, for example, the stop words dictionary given by the scikit-learn library in Python [23]. In this library, there is a fairly large dictionary of words that do not help the analysis, these words are usually considered without accents because these are usually removed beforehand or outright not considered [10].
Secondly, we apply stemming on the text. Stemming refers to the process of reducing words to their root. This method is used because there are different words that come from the same root and have a similar meaning for the purposes of the analysis to be performed. To perform this task there are several methods, in this work we have used the Snowball method [10].
Considerations for social networks
Considering that our work focuses on Twitter sentiment analysis, it is necessary to have certain considerations with the management of some elements that exist within this platform. In this section, some elements particular to Twitter are explained. We also deal with how to approach these elements from a pre-processing standpoint.
Emoticons and Emojis: One of the key points of sentiment analysis on Twitter is the use of emoticons and emojis (ideograms or special characters) in tweets [21, 16]. Emoticons are a way of expressing emotions that are usually merged with natural language. These texts usually have a greater contribution in the context of sentiment analysis. Recently, emojis used more frequently within electronic messages or web platforms have been implemented within the UTF-8 encoding. They are considered as a replacement for classical emoticons. These emoticons and emojis are used to be able to perform a better training by associating these emojis with a positive or negative orientation. Hashtags: Within most tweets, there are certain special text fragments known as hashtags that help in some way to detect the polarity of the messages. These usually contain additional information and could be associated with a stronger feeling, so that they are useful for detecting positive and negative emotions. Some examples can be seen in Table 1.
Hashtag examples for this case study (in Spanish)
After the pre-processing stage it is necessary to choose some representation for each one of the texts. One of the simplest approaches is the bag of words approach. From this approach, a dictionary must be built based on all the words collected and these are associated with a vector of words. By grouping all the resulting vectors, a matrix is obtained that defines a numerical representation of the input data [38].
In sentiment analysis, one possible key factor to determine polarity is the presence and frequency of the words within each text [22]. In this way, it is possible to obtain better results in sentiment analysis using this information. In the case of Twitter, there is a problem that the texts are short and the frequency of certain keywords can be affected, which further complicates the analysis. However, for the purposes of this report, we consider a simple model, since a more complex model is not required for our application. In particular, we apply TF-IDF as our text representation [25].
TD-IDF (Term Frequency – Inverse Document Frequency) is a numerical representation of how relevant a word of a document is within a collection, and it is used as a weighting factor in text mining. It is based on the frequency of specific terms weighted by the relative importance given by the inverse document frequency [19, 25, 15].
Pre-processing steps summary
The raw data collected from Twitter must be processed. In particular, there are several elements that do not help the analysis such as punctuation, some hashtags, and others. These must be removed from each tweet. To perform this cleaning phase, we implement a pre-processing script in Python based on the previously discussed elements, this completely automates this part of the process and does not require human intervention. We use Python because it has several libraries to standardize text, therefore for this process the following steps were followed:
The text format is decoded from UTF-8. All URLs are removed. Words with accents and special characters are modified to their canonical form. All digits in the text are deleted. All the letters in the text are converted to lowercase. Special characters are deleted (/#"$;._-). Users are removed from the text. Repeated letters are removed from the text leaving only 2 letters (e.g. hoooola – hoola). Exclamation marks are replaced with Question marks are replaced with Empty words and stop words are deleted. Stemming is applied to each tweet.
After cleaning the tweets, it is possible to notice the elimination of several elements described above. For illustrative purposes, we present a list of examples of the original tweets and their clean counterparts, alongside their classification as positive or negative in Table 2.
Example of original tweets and their clean counterparts. The classification label is also presented
It should be noted that the choices of pre-processing steps are a design decision and could be considered subjective. Our list of normalizations is based on typical pre-processing steps for tweets, but there could be different approaches to this. However, once the pre-processing design is fixed, there are no more subjective elements in its execution, because it is a fully automated process with no human input.
Model construction
For the classification process, we applied Support Vector Machines and Naive Bayes, which we briefly describe below:
Naive Bayes: This classifier is based on the theorem of Bayes from probability theory. It assumes that all attributes in the data are conditionally independent from each other given the class. Even though this assumption is not necessarily correct or achieved in practice, the results obtained from this method usually generate a good enough model [19]. In particular, words in a document (or words in a Tweet in our case) are not independent between them, but a decent classifier can still be built using NB, even if the assumption is broken. Support Vector Machines: This method has a strong mathematical basis and it also has one of the best performances when applied to text documents [19]. Support vector machines are linear classifiers that work by finding the optimal hyperplane that separates the classes given the training data. This hyperplane is obtained by solving an optimization problem, the solution to this optimization problem leads to the concept of support vectors. Non-linear classification problems can be approached using kernels to transform the input space into a different representation that can be handled by the linear SVM.
Since the purpose of our work is to show the process and viability of estimating the voting intention using our proposal, we avoided more advanced classifiers, such as deep learning methods. There are multiple techniques that could be used, such as LSTM and recursive neural network variants for classification, as well as neural word embeddings for representation [39]. While there are many other options for classic supervised learning algorithms in the literature, we opted to use NB and SVM classifiers due to the fact that several previous works on Twitter sentiment analysis make use of them [21, 26, 34]. The classifiers were implemented in Python 2.7 with the library scikit-learn [23].
For the purposes of training and validation, we separated each one of our data sets (one for each candidate) into 60% for training and 40% for testing. Then we merged all the training sets to obtain the full training dataset with data from all three candidates. The classifiers were trained on this full training data set.
For SVM there are several different parameters that can be modified in order to tune the performance of the classifier on a given data set. In particular, we consider different variations of the kernel (radial-basis functions (RBF), linear and polynomial), gamma and
In order to find an adequate parametrization for SVM, we performed a grid search over the hyperparameter space with our full training data set and tested it on the corresponding full testing data set, using the following combinations of parameters:
RBF kernel with various values for Linear kernel with various values for Second order polynomial kernel with the various values for
Using cross-validation methods as implemented in the scikit-learn library it is possible to carry out the corresponding tests required to find the adequate parametrization [23]. We found that the best performance was obtained with a linear kernel with a
In order to choose our classifier from among NB and various possible parametrizations of SVM, we require specific metrics to evaluate the performance on our data set. For this work, we have used standard metrics from the machine learning literature such as accuracy, precision, recall and the
Once we had the best performing classifier, we used this model to obtain our estimate of voting intention using our testing data sets for each candidate.
Voting intention estimation
In order to fulfill our main objective of estimating the voting intention of people, it is necessary to devise a conversion method from raw tweets into voting intention for each one of the candidates. In order to do this, we propose a formula that uses both positive and negative tweets in its definition. Thus, we present the Voting Intention Eq. (3.5) for the estimation of vote intention, where we assume that we have at least one tweet in order to avoid division by zero. It should be noted that this formula hasn’t been published before and is a new contribution designed to estimate voting intention in this work.
In general terms, for each candidate, this formula takes the total number of positive tweets of a candidate and then adds the dissidence against the other candidates that can be inferred from the number of opposing tweets, weighted by the number of other candidates. This is then divided by the total number of tweets. This is done for each time period in order to evaluate the evolution over time.
This formula generates a number from zero to one, which can then be converted into a percentage. It should be noted that if we sum the results for all the candidates, the formula will always add up to one (i.e., a hundred percent of the votes).
The terms used in Eq. (3.5) are defined as follows:
In particular, for each one of the candidates that we studied, we can obtain a specific formula. For Sebastián Piñera we have Eq. (2), for Beatriz Sánchez we have Eq. (3) and for Alejandro Guillier we have Eq. (4).
Sebastián Piñera:
Beatriz Sánchez:
Alejandro Guillier:
In this manner, we can now express percentage values that represent the voting intention for each one of the established periods. In order to provide some mathematical foundation to our proposal, we will prove Theorem 1 which guarantees what we believe to be basic requirements for a formula that estimates voting intention.
.
The Voting Intention Eq. (3.5) satisfies the following properties:
Non-negativity: Values sum to one:
Proof..
For part (i), we only need to concern ourselves with the numerator, since the denominator is always positive and non-zero. For all
For part (ii), consider first that by definition
.
The Voting Intention Formula defines a probability distribution for candidates (which can be encoded by integers) during each time period.
Proof..
This follows directly from Theorem 1. ∎
The following section details the obtained results after applying sentiment analysis techniques, reporting the different metrics for each classifier. We also present the evolution of public opinion for each candidate over time, using the number of positive tweets as an initial estimation of this. Afterward, we present our voting intention estimation for each candidate. It should be noted that the most important estimate for voting intention is the last one (corresponding to the last two weeks of October), since this period is the closest one to the elections date. Finally, we close this section with the corresponding discussions.
Classification
The initial dataset contained 9,600 tweets after performing the queries with the Twitter API. However, as shown above, after various filtering and pre-processing steps we ended up with a more limited amount of data, in particular, we have a total amount of tweets of 947 after cleansing. We applied machine learning methods (NB and SVM) to this filtered dataset, with the considerations described in previous chapters, in particular, we separated the data set in 60% training and 40% testing. The results after testing our model in the test set is given by Table 3.
Evaluation metrics for the global test set
Evaluation metrics for the global test set
As shown in Table 3, SVM obtains the best results in our experiments. Thus, we now will show the results of the best model on the testing set fragments for each candidate, presenting both the number of predicted and actual positive tweets, as well as the voting intention estimate. The general results for classification for each candidate are shown in Table 4.
Performance evaluation of the models for each candidate and period
Candidate Sebastián Piñera
For the candidate Sebastián Piñera we collected 3,200 tweets and after all the pre-processing steps we obtained a total of 239 tweets divided over four two-week periods. The evolution of public opinion over time, as given by our SVM model and in terms of positive tweets, is shown in Fig. 2.
Actual percentage of positive tweets vs the predicted percentage of positive tweets for SP with our best SVM model.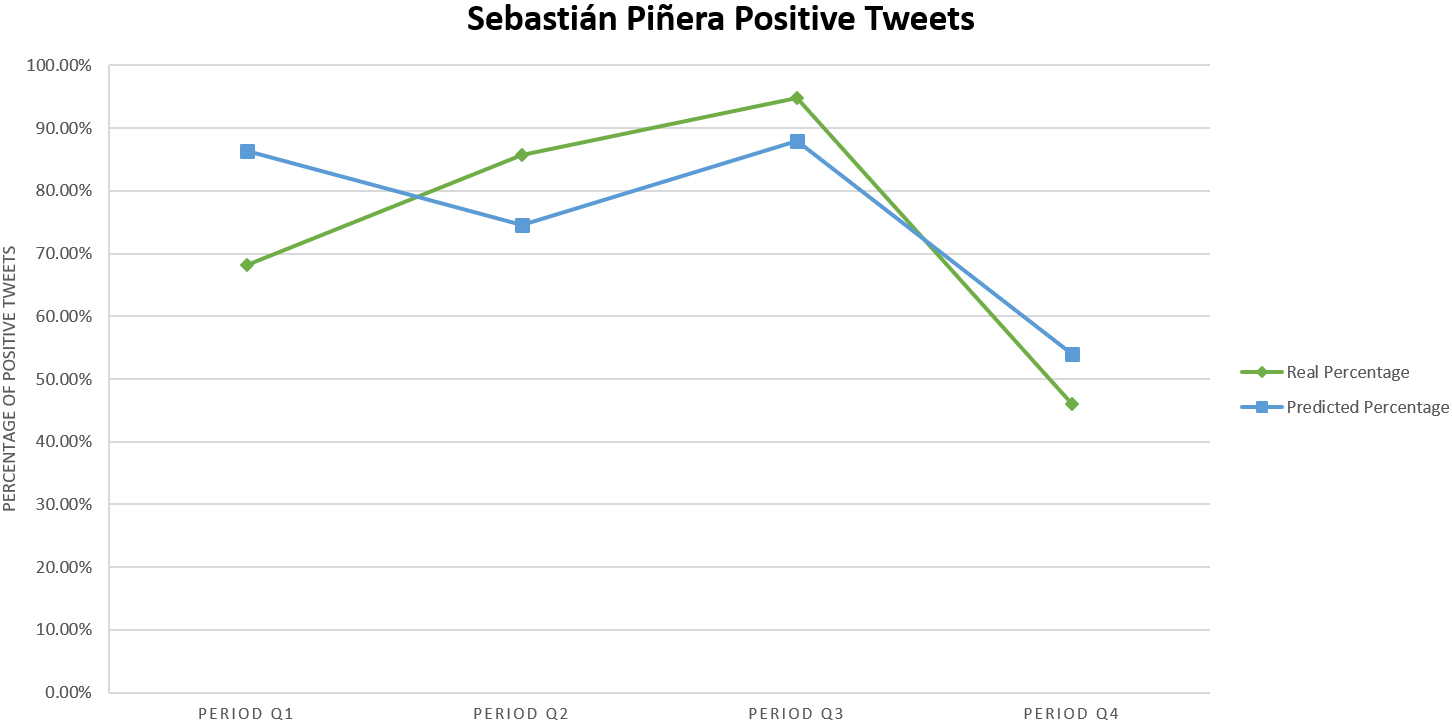
Candidate Beatriz Sánchez
For the candidate Beatriz Sánchez we collected 3,200 tweets and after all the pre-processing steps we obtained a total of 407 tweets divided over four two-week periods. The evolution of public opinion over time, as given by our SVM model and in terms of positive tweets, is shown in Fig. 3.
Actual percentage of positive tweets vs the predicted percentage of positive tweets for BS with our best SVM model.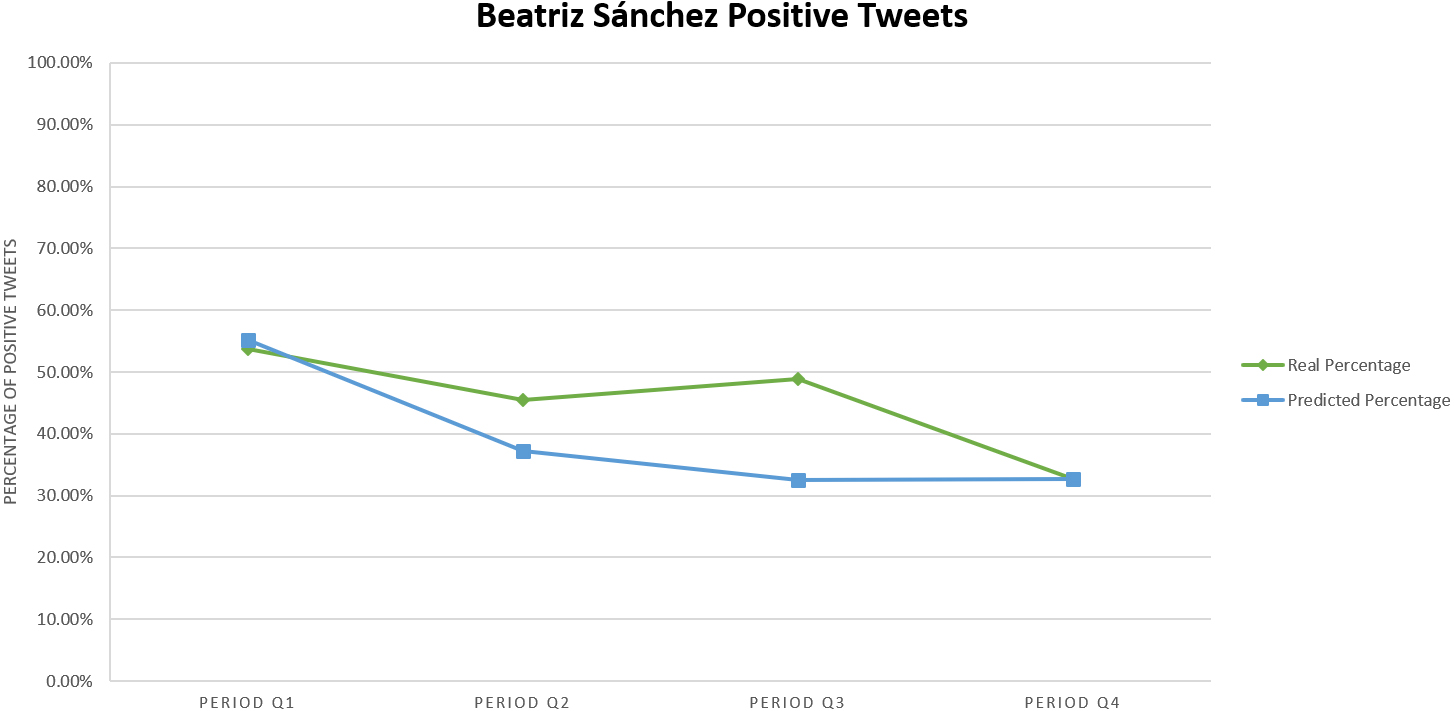
Candidate Alejandro Guillier
For the candidate Alejandro Guillier we collected 3,200 tweets and after all the pre-processing steps we obtained a total of 301 tweets divided over four two-week periods. The evolution of the public opinion over time, as given by our SVM model and in terms of positive tweets, is shown in Fig. 4.
Actual percentage of positive tweets vs the predicted percentage of positive tweets for AG with our best SVM model.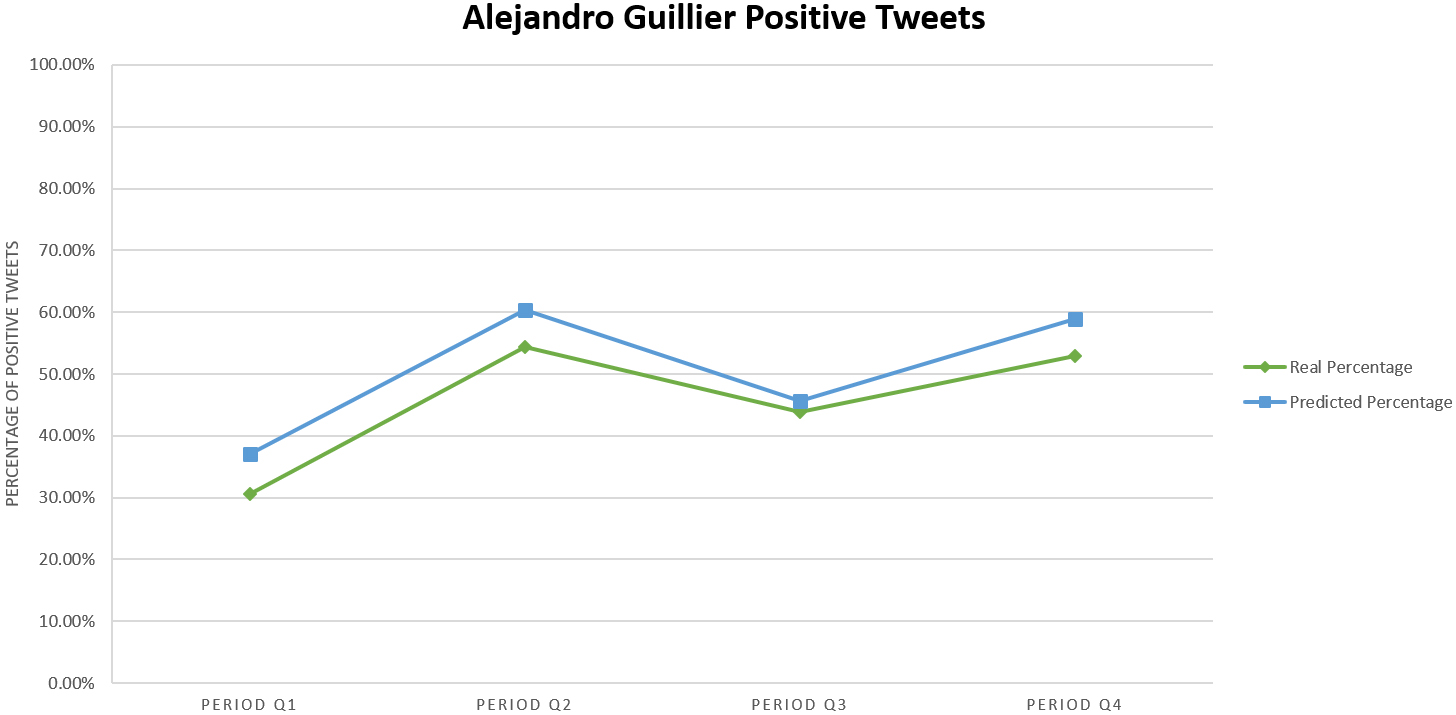
After analyzing the polarity of the tweets with sentiment analysis, we can now apply the trained machine learning model and Eq. (3.5) to predict the voting intention for each candidate on each time period. These results are shown in Table 5. Figure 5 shows the evolution of the distribution of the voting intention according to our estimates.
Voting intention evolution over time for each candidate.
In Table 6 we show the results from our prediction for the last period (the closest one to the elections), the prediction from three important polls and surveys and the actual election results.
As mentioned above, between the two classification methods, SVM showed the best results in terms of prediction capabilities for tweet orientation. This is in line with the results from the literature [19], however, it should be noted that it could be possible to obtain better results using a more powerful classifier.
With respect to the candidate, it can be seen that the number of positive tweets for Beatriz Sánchez tend to diminish over time, which could indicate that popular support fell over time, at least on Twitter, and possibly enough to see a similar result in the actual elections. On the other hand, the number of tweets associated with Sebastián Piñera was relatively low compared with the other candidates. This could be caused by the various filters that were applied, which deleted a considerable amount of repeated or empty tweets.
Another observation that can be made, is that the percentage of positive tweets associated with Alejandro Guillier and Sebastián Piñera was relatively balanced in the last period of evaluation (last two weeks of October). These similar results could indicate a potential tie with respect to the public opinion. It makes sense considering that these candidates were the ones that made it to the second round of the elections.
From another angle, we can also compare the plots of positive tweets over time, which show that there exists some sort of inverse relationship between the number of positive tweets for these two candidates. Until they reach a balanced point in the last period. In some way, it would seem that the support of each candidate on Twitter alternates approximately every 15 days.
With respect to the conversion from tweet polarity to voting intention, we found that our proposal gave results that could be considered relatively close to the actual results in contrast with traditional methods. Our proposal shows potential, however, as mentioned in our literature review, it still suffers from certain limitations, such as the inherent bias of Twitter demographics. However, these results show that with more fine-tuning and perhaps better classifiers and data, we could obtain a good estimate for the elections, which could supplement the information provided by traditional polls and surveys.
In the context of the elections, the most important period of our analysis is the last one (Q4, the last two weeks of October), since it is the closest one to the actual elections date.
In this last period, we obtained a voting intention of 35.84% for Sebastián Piñera, compared with a range from 34.50% to 44.00% according to traditional polls and an actual 36.64% in the elections. In this case, we can see that the results of our proposal adjust well to the reality, at least in comparison with traditional polls, which seemed to overestimate the voting intention associated with this candidate.
For Alejandro Guillier we obtained a voting intention of 36.89%, compared with a range from 15.40% to 30.00% given by traditional methods and an actual 20.27% in the elections. In this case, we can see that our proposed method overestimates the voting intention for this candidate, both with respect to traditional polls and the real results. The difference in these results could be due to the fact that we have not considered some of the other candidates that are close in the political spectrum to Alejandro Guillier, such as Carolina Goic.
For Beatriz Sánchez, we obtained a voting intention estimate of 27.77%, compared with a range from 8.50% to 11.00% for traditional methods and an actual 22.70% in the elections. In this case, the method is closer to the actual result than traditional polls, however, it overestimated the voting intention. Again, this could be due to the fact that we did not include other candidates that were close to Beatriz Sánchez in the political spectrum, which is composed of several other factions opposed to the other two candidates. However, the main point of interest is this difference of results with respect to traditional polls. This difference could be due to the fact that more traditional methods overestimate the voting intention of traditional candidates (i.e., the “Chile Vamos” (Sebastián Piñera) and “Nueva Mayoría” (Alejandro Guillier) coalitions), which makes sense in the actual electoral context, especially considering the votes for the candidate in the fourth place José Antonio Kast (which we did not include in this analysis), who obtained more votes than what was initially projected, in the same way as Beatriz Sánchez. This aligns with the tendency of the last two elections, in which the classical bipartisan model seems to be breaking after two decades since the return to democracy, being slowly repudiated by the population [28, 7].
Given all the previous analyses, the results are seen as promising by giving closer estimates to the reality of elections compared to traditional polls in some cases. As mentioned above, some discrepancies could be explained by the fact that some candidates were excluded from the analysis, even though they held a relatively important number of votes. Finally, it should be noted that the proposed approach is agnostic to the language of the tweets, in fact, it could be used in other elections with any language as long as enough data is available to train the classifiers.
It should also be noted that if we had a larger data set, scalability would not be an issue with our approach. In fact, given a fixed number of candidates, a fixed number of periods (or a single period if we wish to forecast the election just before it happens), and a trained classifier for the tweets that predicts in constant time, the voting intention formula can be computed in linear time with respect to the number of tweets. This is because all we have to do to compute the voting intention is obtain the total number of positive and negative tweets for each candidate for each time period, this can be done in one linear scan of the data. Thus, our approach would be easily applicable in contexts with more data, assuming we had a classifier available.
Finally, it should be noted that while our work focused on Twitter, the Voting Intention formula can be used for any election in any social network platform, no necessarily Twitter, that allows searching user publications for mentions of the candidates. All that is required is a set of negative and positive for each candidate.
Conclusions
During the last years, several studies have been carried out in the area of sentiment analysis on the internet. In particular, in the last five years, more studies have been carried out on social networks such as Facebook and Twitter. In this article, the application of sentiment analysis techniques in the context of the Chilean elections of 2017 has been presented, using classic classification techniques from machine learning (NB and SVM). From the analysis of results, it has been found that it is possible to use social networks and sentiment analysis to determine the electoral tendencies with an adequate level of precision. Through this, it is possible to measure public opinion according to the tweets of presidential candidates using opinion mining.
With respect to the analyzed data, it is worth noting that the period with the most interaction on Twitter was from October 15 to October 31, corresponding to the last period analyzed (that is, the period closest to the date of the first electoral round).
Regarding the obtained results, it should be noted that the SVM classification method presented better results in comparison with the Naive Bayes method. Although, for the candidates, it should be noted that the number of tweets of Beatriz Sánchez is significantly higher than that of the other candidates for the presidency, although this might be due to the differences in the query that we used. On the other hand, the number of tweets of Sebastián Piñera is significantly lower than that of the rest of the candidates, since several exact repetitions (or other similar anomalies) were found that were filtered in each case.
On the other hand, using the formula proposed in Eq. (3.5), it can be seen that this generates estimates close to the actual results of the elections even in the closest cases obtained by traditional surveys for the 2017 elections. It should be noted that future work could improve this approach, using more advanced algorithms so that the classification is more accurate.
The candidate Alejandro Guillier obtained higher predictions than the actual results in the elections, while Beatriz Sánchez also obtained higher predictions, closer to the actual results of the elections, both of these could be explained by the candidates excluded from the investigation. With respect to this point and regarding future work, there is an intention to broaden the spectrum of candidates to study the voting intention accurately.
Regarding the potential limitations of this work, it should be borne in mind that there is a possibility of biases in the labeling process of tweets, since the textual classification depends on the person in charge of this task and their psychological aspects and political opinion. Furthermore, it would be important to include a spam detection pre-processing step in addition to the ones that we have already included, as this could improve the model performance. However, this would require more data. Also, it should be noted that the model and its predictive capabilities could be improved by acquiring more data. Thus, for all these reasons, it is necessary to take these limitations and improvement opportunities into account when trying to generalize or apply these results.
Footnotes
Acknowledgments
This work was partially funded by the CONICYT PCFHA/DOCTORADO EXTRANJERO BECAS CHILE/2019 – 72200105.