
Abstract
Credit card fraud is the new financial fraud crime accompanied by the gradual development of the economy which causes billions of dollars of losses every year. Credit card fraud case not only seriously violated the cardholder benefits and financial institutions, but also undermined the credit management order. However, fraudsters keep exploring new crime strategies constantly which exacerbates the crime rate of fraud. Thus, a predictive model for credit card fraud detection is essential to minimize its losses. By distinguishing between fraud and non-fraud, machine learning is one of the most efficient solutions for detecting fraud. Support vector machines have proven to be a novel algorithm with excellent performance. Nevertheless, the performance of SVM depends largely on the correct choice of model parameters (C and g), which could cause that the false positive was very high if the kernel function type and parameter cannot be selected properly. In this paper, based on the real transaction data of the credit card business, firstly, it will find the optimal kernel function suitable for the data set. Secondly, this paper will propose the method of optimizing the support vector machine parameters by the cuckoo search algorithm, genetic algorithm and particle swarm optimization algorithm. Last but not least, the Linear kernel function was found to be the best kernel function with an accuracy rate of 91.56%. Furthermore, the Radial basis function is used to optimize the kernel function, which can improve the accuracy from 42.86% to the highest accuracy rate of 98.05%. Compared with CS-SVM and GA-SVM, PSO-SVM has the best overall performance.
Introduction
The e-commerce has grown by leaps and bounds into a remarkably successful communications medium a visible impact on the daily lives of people in many areas such as business, working, and amusement. However, at the same time, all kinds of credit card fraud cases are increasing which brings bad faith to cardholders and makes a great loss to bank [7]. According to Robertson [6], global credit card fraud losses increased from $7.6 billion in 2010 to $21.81 billion in 2015. By 2020, global credit card fraud losses are expected to reach $31.67 billion. In addition, credit card fraud is related to organized crime, terrorist activities, and drug trafficking which poses a threat to the society [4].
With the development of fraud detection technology, fraudsters are improving the concealment of fraud and avoiding being discovered constantly. Therefore, credit card fraud detection methods need to be continuously innovated to improve the accuracy of fraud detection [18]. Credit card fraud detection methods are divided into two categories: supervised and unsupervised. In the supervised fraud detection method, models are estimated based on samples of fraud and legitimate transactions, and new transactions are classified as fraudulent or legal. In unsupervised fraud detection, outliers or unusual transactions are identified as potential fraudulent transaction cases. Both methods of fraud detection can predict the likelihood of fraud in any given transaction [21, 24]. In practice, credit card fraud identification model is actively used [22]. Most credit card fraud behavior recognition models focus on case-based reasoning [20], neural network [31], random forest [23], logistic regression [12], as well as support vector machine [26]. The focus of these studies is on the use of machine learning models to identify data that aggregates the performance of fraud predictions in every transaction. Diverse machine learning methods have great differences in recognition effects for different data sets.
Support Vector Machine (SVM) is a supervised machine learning algorithm for data classification problems. It is widely used in many fields, such as image recognition [25], credit evaluation [5] as well as public safety [16]. Compared to other classifiers, SVM can solve linear and nonlinear binary classification problems, which finds a hyperplane that distinguishes the input data in the support vector. The kernel function of the support vector machine and its parameters have a particularly important influence on the support vector space and classification effect in the calculation process. For different types of data sets, diverse kernel functions have different performance. We select four common kernel functions for comparative study. Almost all artificial intelligence algorithms inevitably require careful tuning of parameters. Optimal parameters have become an important factor hindering the improvement of algorithm performance. In order to improve processing efficiency, in recent years, some experts have proposed methods for automatically optimizing parameters, such as machine learning. In the SVM, the parameters of the kernel function directly affect the classification effect. We have selected a variety of meta heuristic algorithms to adjust the SVM parameters. Among them, three kinds of Cuckoo Search (CS) algorithms, Genetic Algorithms (GA) and Particle Swarm Optimization (PSO) algorithms with better performance are compared to select the most. An optimization solution for this data set. In this paper, we provide two contributions: first is to solve the problem of credit card fraud identification in high-dimensional, multi-noise data. Second is to find the optimal support vector machine to improve the accuracy of identifying credit card fraud through different optimization schemes.
The rest of the paper is organized as follows. The second section summarizes the related work based the research on the SVM. The third section describes four kinds of data mining technology used in this study. The fourth section discusses three improved support vector machine algorithms and their basic implementation process. The fifth section explores the experimental setup and performance measures which used in this comparative study. The last section demonstrates the results and relative issues of further research.
Related work
As discussed in the “Introduction” section, many SVM speed optimization techniques have been proposed, most of which solve optimization problems through different methods, including: instance selection, parameter optimization and feature selection [1]. In this paper, we choose parameter optimization. Specifically, we can consider the process of parameter adjustment as the maximization of the black box function, the parameters of the model as the independent variables of the function, and the generalization ability of the model as the dependent variable of the function. The maximum value of the function is obtained by an optimization method, thereby obtaining a set of optimal parameters [8]. We choose natural heuristic algorithms to optimize the parameters. Some existing natural heuristic technologies are mainly focused on: evolutionary algorithms (EA) [31], ant colony optimization (ACO) [17] and artificial immune system (AIS) [15]. We choose particle swarm optimization algorithms, cuckoo search algorithms, and genetic algorithms to optimize support vector machines. We summarize the advantages of these methods in processing credit card fraud data and discuss their limitations, and try to find the best algorithm to improve the classification performance of support vector machines.
Materials and methods
Support vector machine
SVM is an effective machine learning tool for pattern classification and regression that minimizes both prediction error and model complexity [23]. The SVM is based on formalized classification boundaries that are separated by points with different labels, thereby maximizing the boundaries of the closest data points. The classification boundaries defined by the hyperplane will result in different support vectors.
The support vector machine was originally proposed to study the linear separability problem, assuming a training set of size
At this time, the classification interval is
It is worth mentioning that if the majority of samples in the data set are linearly separable, only a few samples (possibly abnormal points) lead to the failure to find the optimal classification hyperplane. For such cases, the usual practice is introduced non-negative slack variables
In Eq. (3),
In the Eq. (4),
Therefore, for most samples
In the case of nonlinear classification problems, the support vector machine maps the samples to a high-dimensional space H by the kernel function
Four common kernel functions
Cuckoo Search algorithm (CS)
The Cuckoo Search algorithm is a new optimization algorithm proposed by scholars Yang and Deb from University of Cambridge in 2009 [28]. The natural process of the cuckoo nesting parasitization is simulated, the parameters of the problem to be solved are compiled into a nest, and multiple nests constitute a population. Individuals in the population update the population by selecting the bird’s nest by Levy flight and discarding the bird’s nest with a certain probability. After several iterations, until the optimal solution is obtained. To simplify the description of the new CS, we now use the following four idealization rules [27]:
Each cuckoo bird lays an egg standing for a design solution at a time, and dumps its egg in the nest randomly chosen from hosts.
The best nests with high quality eggs (better solution) will be passed to the next generation.
The number of available host nests is limited to n, and a host bird can recognize the egg of cuckoo bird with a probability
In this case, it can either throw the egg away or abandon the nest in order to build a completely new nest in a new location.
The path and location update formula for the cuckoo nest is as follows:
In Eq. (7),
In Eq. (8), stepsize represents the step size produced by Levy flight,
In 1995, Kennedy and Eberhart proposed the PSO method [13], a bionic algorithm that simulates birds looking for food. This is a global search algorithm for searching for optimal values of historical and social information particles that exist between each other. The algorithm has many advantages, such as fast convergence, simple concept, and so on. PSO techniques have been used to solve the problem of model selection problem support vector machines [14], where each set of SVM parameters is trained as particles.
In the PSO algorithm, each particle represents a possible solution and has an adaptation value determined by the optimized function, and all particles form a population (Swarm). The particles in the space jointly determine the flight direction and speed according to their flight experience and population experience, in order to find the optimal solution. Assuming that the solution is solved in the D-dimensional search space, the population consists of
The velocity vector and position vector of the i-th particle in space at time
Equations (10) and (11) respectively describe the motion of the particle in each dimension space. In each evolution, each particle updates itself by tracking two local optimal solutions, one being the optimal solution (pBest) found by the particle itself.
In the Eq. (3.2.2),
The Genetic Algorithm is a computational model that simulates the natural evolution of Darwin’s biological evolution and the evolutionary process of genetic mechanisms. It uses evolutionary populations of selection, crossover, and mutation mechanisms [11, 29]. It is one of the powerful tools for getting the optimal kernel function parameters.
Population initialization
Since the genetic algorithm cannot directly deal with the parameters of the problem space, it is necessary to express the feasible solution of the required problem into a chromosome or an individual of the genetic space by coding.
Fitness function
The fitness function is a criterion for distinguishing the quality of individuals in a group. It is the only basis for natural selection and is transformed by the objective function.
Choose the operation
The selection operation selects a good individual from the old group with a certain probability to form a new population to breed to obtain the next generation of individuals. The probability that an individual is selected is related to the fitness value. The higher the individual fitness value, the greater the probability of being selected. The genetic algorithm selection operation has many methods such as roulette method and tournament method. In this case, the roulette method is selected, that is, the selection strategy based on the fitness ratio, and the probability that the individual
Where
Crossover operation
Crossover operation refers to randomly selecting two individuals from the population, and inheriting the excellent characteristics of the parent string to the sub-string through the exchange combination of the two chromosomes, thereby generating a new excellent individual. Since the individual uses real number coding, the crossover operation uses the real number intersection method, and the crossover operation method of the kth chromosome
Where
Mutation operation
The main purpose of the mutation operation is to maintain population diversity. The mutation operation randomly selects an individual from the population and selects one point in the individual to mutate to produce a better individual. The operation method of mutating the j-th gene
Where
The crossover probability
Optimization principle.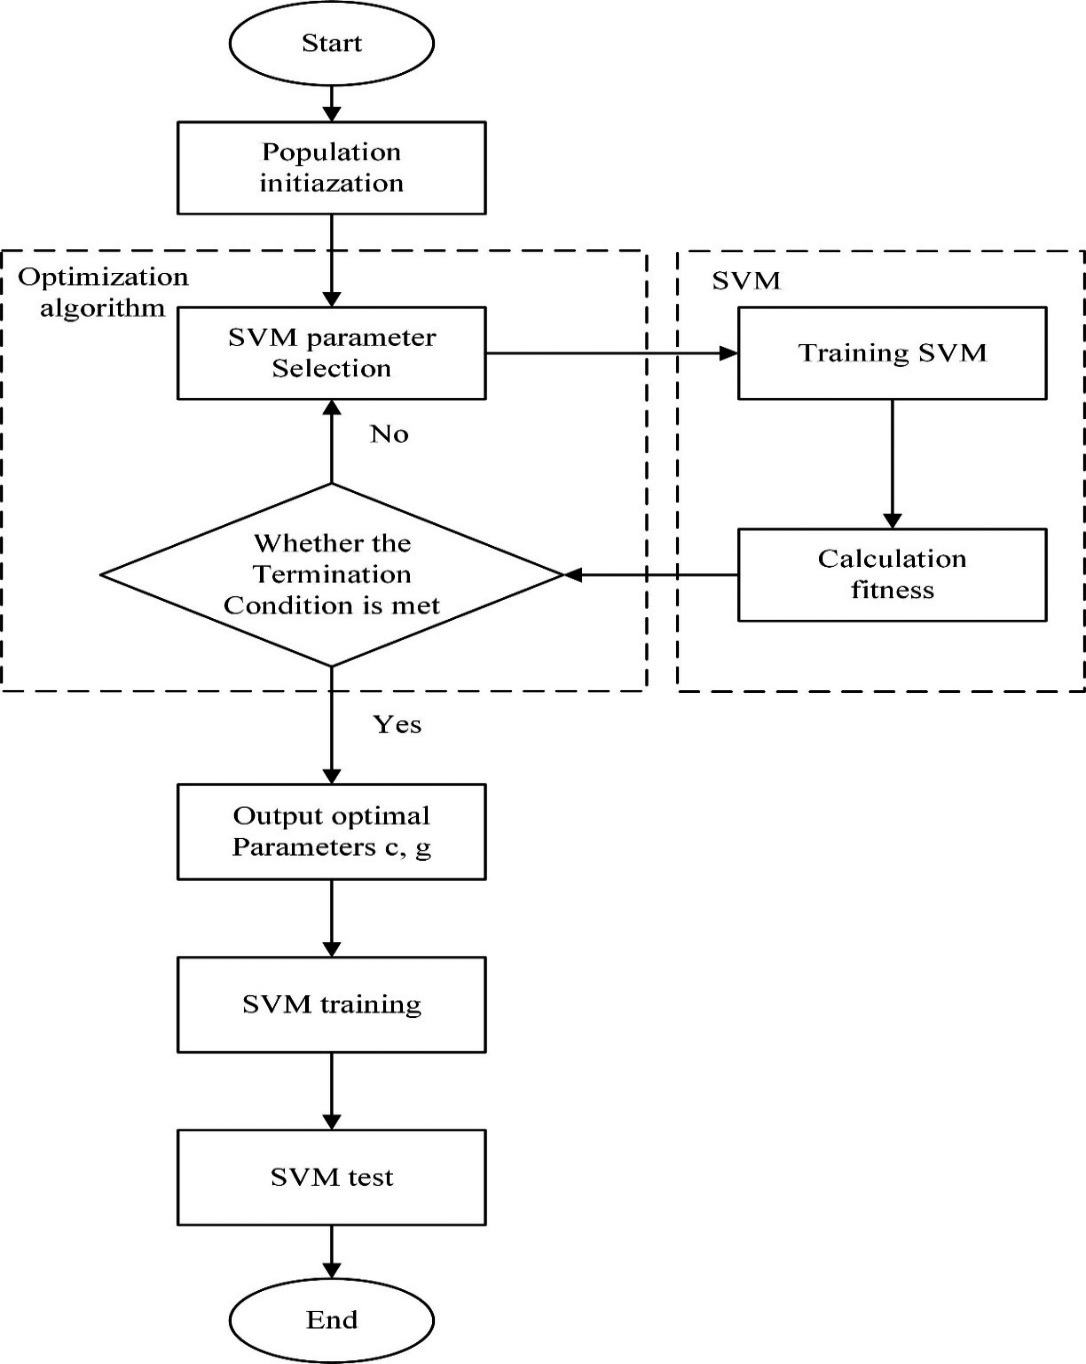
In order to build an effective SVM model, the parameters of the parameters (C and g) need to be pre-selected [19] The determination of parameter C requires a trade-off between training error and complexity. If the C value is larger, the prediction accuracy of the training samples will be higher. Nevertheless, this could cause the overtraining problems. C is the penalty coefficient, which can be understood as the weight of the preference of the two indicators (interval size, classification accuracy) in the optimization direction, that is, the tolerance of the error. The higher the C, the more the tolerance is not tolerated and the over-fitting is easy; the smaller the C, the easier it is to fit, the C is too large or too small, and the generalization ability is worse. g is a parameter that comes with the RBF function as a kernel function. Implicitly determines the distribution of data after mapping to a new feature space. The larger the g value, the fewer support vectors The smaller the g value, the more support vectors. The number of support vectors affects the speed of training and prediction. Therefore, the parameters (C and g) have a great impact on the efficiency and generalization of the SVM model. At present, the selected parameters are lack of mature theoretical guidance, mainly based on experience. Grid search technology is the most commonly used method of searching for parameters, but grid search technology wastes time and does not work well. Therefore, we choose three optimization algorithms, CS, GA, and PSO, to find the optimal parameters of the SVM model. The optimization schematic is shown in Fig. 1.
Preparing data for models
Organizing the data set, there are 514 sets of data, each of which has 30 attributes. Since these data are collected in the law enforcement department in China, they have certain privacy. It can be observed that it is a unbalanced data set. These 30 attributes are represented by V1, V2, …, V30 respectively. Randomly scrambled data, and then 70% of the data were selected as training sets, a total of 360, 30% as test sets, a total of 154. In order to verify the scientific nature of the above model and the effectiveness of the algorithm, the programs of CS-SVM algorithm, GA-SVM algorithm and PSO-SVM algorithm were written by MATLAB R2017, and solved on the same computer. Experimental environment: Windows 10: Inter (R) Core (TM), i5-5200U CPU, 2.20 GHz, 4 GB of memory. Table 2 is model parameters.
Model parameters
Model parameters
Evaluation metrics include accuracy, precision, recall and F-Measure. The confusion matrix is an indicator of the results of the evaluation, which is part of the model evaluation. The confusion matrix is shown in the below [1].
The confusion matrix consists of the following measures:
True Positive (TP): A test result that detects the condition correctly when the condition is present. True Negative (TN): A test result that does not detect the condition when the condition is absent. False Positive (FP): A test result that detects the condition when the condition is absent. False Negative (FN): A test result that does not detect the condition when the condition is present.
The various evaluation measures are defined as follows:
Accuracy: It is the number of correct predictions made divided by the total number of predictions made.
Precision: It is the number of positive predictions divided by the total number of positive class values predicted.
Recall: It is the number of positive predictions divided by the number of positive class values in the test data.
F-Measure: The F-Measure conveys the balance between the precision and the recall.
ROC curve: Receiver operating characteristic curve, referred to as ROC curve, is the horizontal axis of False positive rate, the probability of hitting the vertical axis, and the curve drawn by the tester under different stimulation conditions due to different judgment criteria. AUC represents the area under the ROC curve, between 0.5 and 1. For a perfect classifier, the value of AUC should be 1. AUC as a numerical value to visually evaluate the quality of the classifier. The larger the AUC value, the better the classification effect. If the AUC value is larger, the classification effect will be better.
Four kernel functions are tested respectively, and then the classification accuracy and ROC curve are compared to find the most suitable kernel function. Figure 2a is the classification accuracy corresponding to the four kernel functions, and Fig. 2b is the ROC curve corresponding to the kernel function in Fig. 2a. It can be observed that the Linear kernel function has the highest correct rate of 91.56%, the AUC value is 0.98718, and the closest among the four kernel functions is 1. Therefore, the performance of the Linear kernel function is the best.
The classification accuracy and ROC curve corresponding to the four kernel functions.
The CS, GA, and PSO algorithms are selected for the four kernel functions to optimize the operation, and the classification accuracy of the four kernel functions is compared. The classification function of the kernel function is effective, and it is not necessarily the best performance after optimization. For instance, the classification accuracy of the Linear kernel function before optimization is 91.56%. After optimization, the correct rate could raise to 93.51%. The correct classification rate of Radial basis function before optimization is 42.86%, and the correct rate becomes 98.05% after optimization. It is the optimal value after optimization of four kernel functions, and the classification accuracy rate is increased by 129%. The performance comparison of different types of kernel functions after optimization is shown in Table 3.
Comparison of different types of kernel functions after optimization
Comparison of different types of kernel functions after optimization
Optimization algorithm evaluation data
Fitness curve.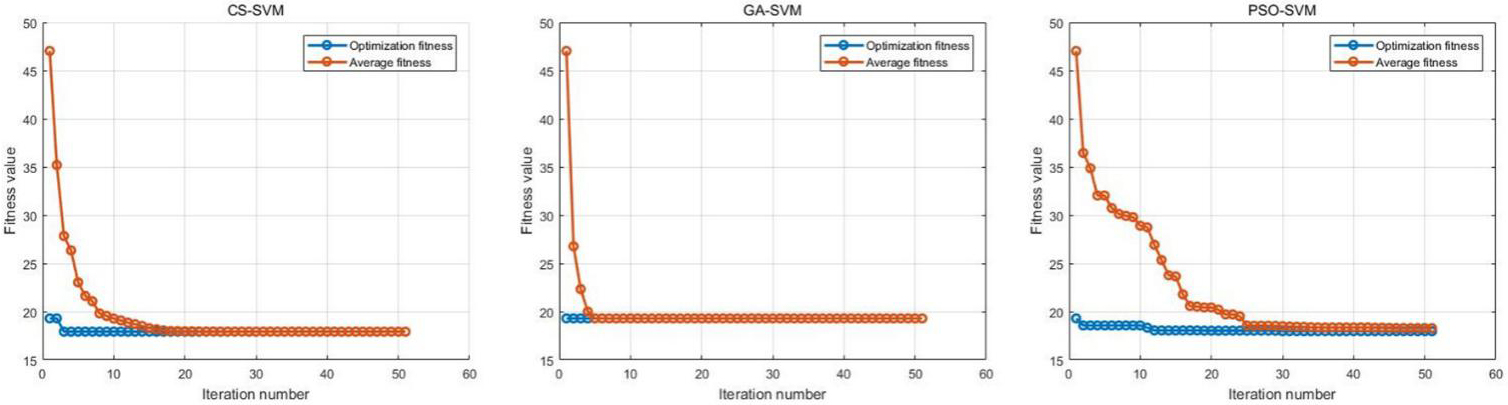
Fitness function comparison.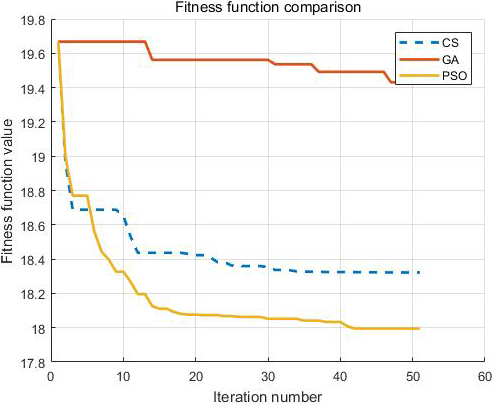
According to the optimization conclusions of different kernel functions in Table 3, the Radial basis function is selected as the kernel function, and the classification performance of the three optimization algorithms is evaluated in detail. Figure 3 presents the Fitness curve for different optimization algorithms. Figure 4 is the fitness function comparison. GA-SVM can find the best fitness in the 5th generation, CS-SVM can find the best fitness in the 15th generation, and PSO-SVM can find the best fitness in the 25th generation. But comparing the best fitness of the three optimization algorithms, we can find that PSO-SVM is the best of the three optimization algorithms.
Table 4 and Fig. 5 are Optimization algorithm evaluation data. The accuracy of CS-SVM, GA-SVM, and PSO-SVM algorithms is the same, both are 98.05%. In Precision, CS-SVM is the same as PSO-SVM, both are 100%, and GA-SVM is 98%. In terms of Recall, CS-SVM is the same as PSO-SVM, both of which are 94.12% and GA-SVM is 96.08%. In terms of ROC curve, the AUC value of CS-SVM is 0.9969, the AUC value of GA-SVM is 0.996, and the AUC value of PSO-SVM is 0.9967. The AUC values of the three optimization algorithms are very close which indicates that the performance of the three optimization algorithms is very close. However, there are conspicuous differences in terms of runtime comparison. The CS-SVM is 45.6 seconds, the GA-SVM is 22.8 seconds, and the PSO-SVM is 20.6 seconds. It can be found that the PSO-SVM has a particularly potent effect in operation. Considering comprehensively, PSO-SVM is the best algorithm for classification efficiency.
Optimization algorithm evaluation.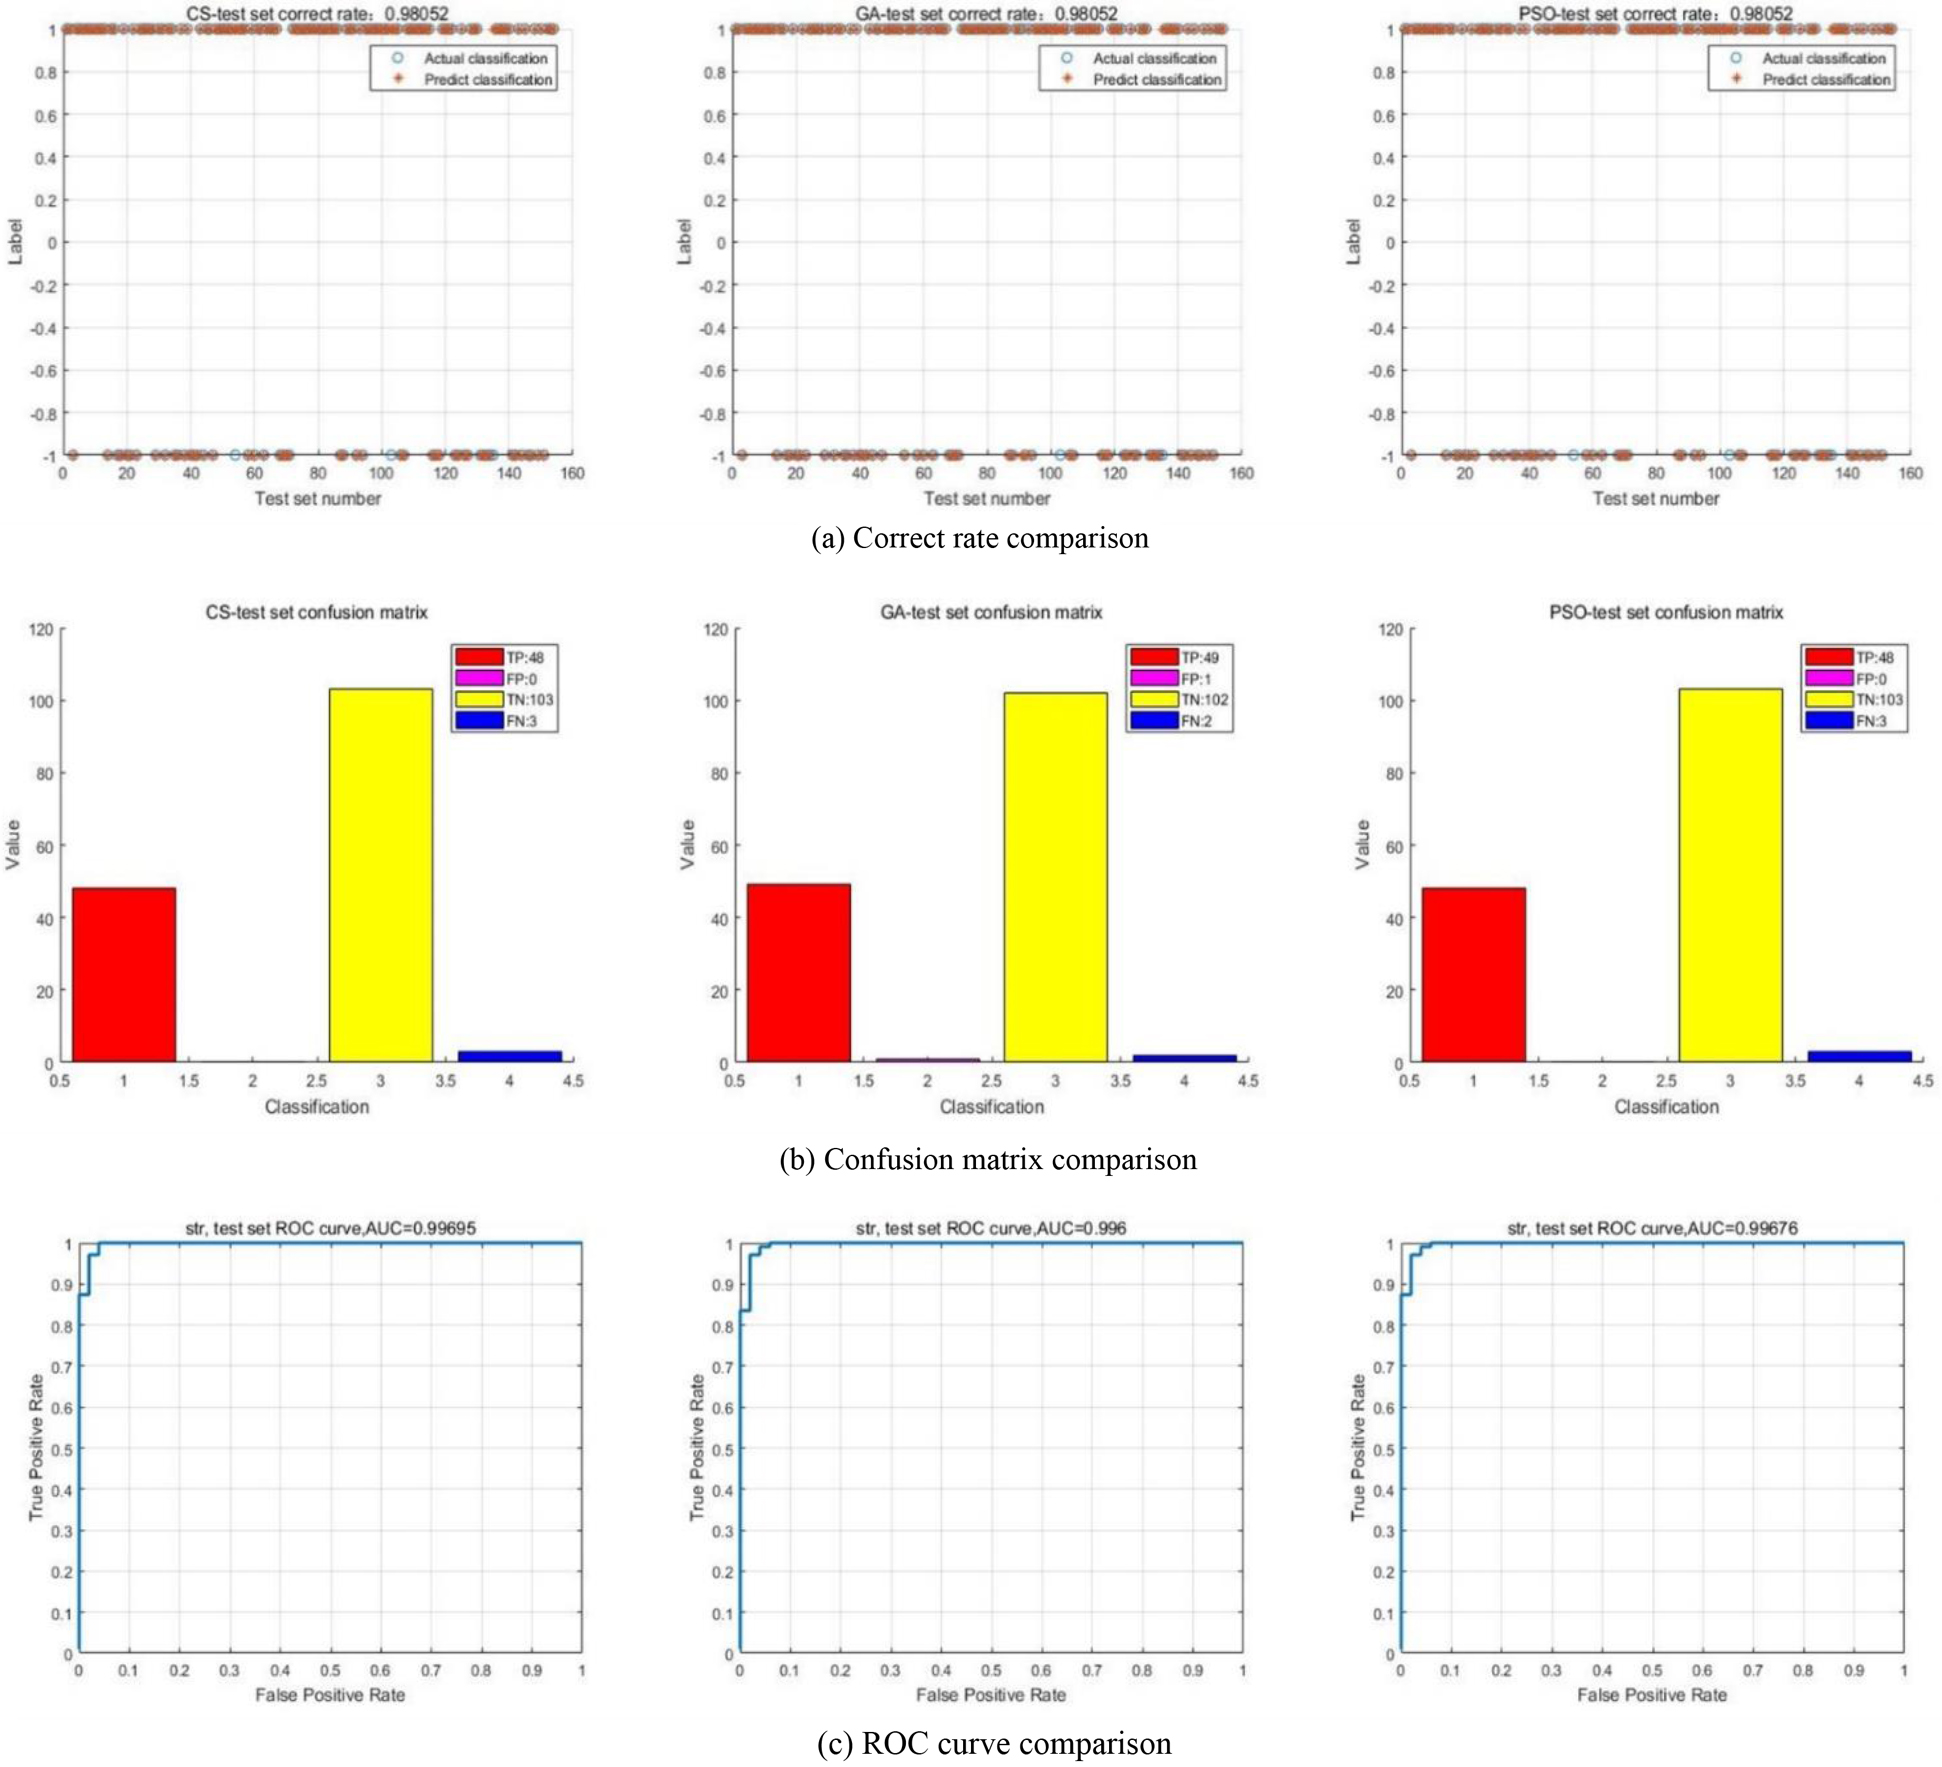
In this paper, we take the real transaction data of credit card business as an example, firstly find the best kernel function suitable for transaction data, and then apply the cuckoo search algorithm, genetic algorithm and particle swarm optimization algorithm to optimize the parameters of support vector machine. Finally, the Linear kernel function is found to be the best kernel function with an accuracy rate of 91.56%. The optimization algorithm is used to optimize the accuracy rate of 93.51%, which is not the highest accuracy. However, the Radial basis function is used to optimize the kernel function, which can improve the accuracy from 42.86% to the highest accuracy rate of 98.05%. Compared with CS-SVM and GA-SVM, PSO-SVM has the highest accuracy, the highest accuracy and the shortest running time. Thus, PSO-SVM demonstrates the best performance.
Data with different sources or different structures requires a kernel function corresponding to it, and finding the optimal kernel function is the first step. Sometimes we just need to find a kernel function that meets our requirements without having to continually optimize. If the kernel function you chose cannot meet your requirements, you can look for different optimization algorithms to optimize, such as CS, GA, PSO and so on. Through comparative research, PSO-SVM is the optimal algorithm for this data set. In the future, we will continue to look for new algorithms to optimize SVM and continuously improve the classification performance of SVM.
Footnotes
Acknowledgments
This work is supported by the National Key R&D Program of China (No. 2020YFC1522603), National Natural Science Foundation of China (71904194) and Beijing Advanced Discipline Construction Project of National Security Science, People’s Public Security University of China.