
Abstract
Sales forecasting is an important part of e-commerce and is critical to smart business decisions. The traditional forecasting methods mainly focus on building a forecasting model, training the model through historical data, and then using it to forecast future sales. Such methods are feasible and effective for the products with rich historical data while they are not performing as well for the newly listed products with little or no historical data. In this paper, with the idea of collaborative filtering, a similarity-based sales forecasting (S-SF) method is proposed. The implementation framework of S-SF includes three modules in order. The similarity module is responsible for generating top-k similar products of a given new product. We calculate the similarity based on two data types: time series data of sales and text data such as product attributes. In the learning module, we propose an attention-based ConvLSTM model which we called AttConvLSTM, and optimize its loss function with the convex function information entropy. Then AttConvLSTM is integrated with Facebook Prophet model to forecast top-k similar products sales based on their historical data. The prediction results of all top-k similar products will be fused in the forecasting module through operations of alignment and scaling to forecast the target products sales. The experimental results show that the proposed S-SF method can simultaneously adapt to the sales forecasting of mature products and new products, which shows excellent diversity, and the forecasting idea based on similar products improves the accuracy of sales forecasting.
Introduction
Sales forecasting is critical to efficient sales management and business resource allocation. Reducing inventory, coordinating employee schedules, purchasing stocks, and evaluating sales teams all require accurate sales forecasting [1, 2]. Most of the methods used for sales forecasting are based on time series forecasting, which forecast the future based on existing historical sales data [3, 4]. Many early statistical-based models such as ARIMA were used for predictive tasks based on large amounts of historical data and achieved good performance [5]. The Facebook Prophet model supports non-linear fitting of time series models of different granularities, and special impact factors can be added to the model to make predictions more flexible [6]. With the popularity of deep learning, deep learning-based models can forecast the future more accurately and the accuracy of the models is also greatly dependent on big data [7, 8].
There is a case that some new products with short time to market have very little historical data. Models suitable for big data are not necessarily suitable for small data. Generally, there are two ways to deal with the problem of insufficient historical data. One is to consider more features such as product attributes to help forecast [9]. When we build forecasting models, in addition to time series data, there are many non-sequential data to be considered such as product attributes and retailer attributes. However, it is difficult to build a forecasting model that takes into account both sequential data and non-sequential data. Another way is to use more complex models so as to get good diversity [8]. Inspired by the collaborative filtering approach of recommender systems, we believe that similar products will show similar characteristics in sales trends. Therefore, we can use the sales trends of similar products to forecast the target product [10].
In this paper, we propose a sales forecasting method for both mature and new products, using a product similarity-based strategy and an integrated approach of two learning models, which can help enterprises to scientifically and reasonably forecast long-term and short-term product sales. It is worth mentioning that we consider multimodal data, time series and text data, blend these data, and make predictions based on sales of similar products. The specific innovations are as follows.
The similarity-based sales forecasting (S-SF) method proposed in this paper is different from the mode of traditional forecasting, which is based on historical data of the product itself. S-SF utilizes the predicted values from multiple similar products to fit the sales of the target product. This method can help address the cold-start problems in new products forecasting tasks. We measure product similarity from several different perspectives, taking into account time-series data of sales and text data of products and retailers. These auxiliary data will make forecasting more reliable. The top-k similarity products will pass through the learning module, and the processing results will provide information for the final prediction. We extend the convolutional LSTM network (ConvLSTM) by adding an attention mechanism and optimize the loss function with convex function information entropy. The new proposed attention-based ConvLSTM model (AttConvLSTM) is then integrated with Prophet to provide better diversity. This also demonstrates the advantages of the integration of statistical learning model and deep learning model. We make fine-grained predictions by mapping the sales forecasting of different retailers of top-k products to the corresponding values of the target product through alignment and scaling operations. And finally, these values will be merged to generate an overall prediction for the target product.
The structure of the paper is as follows. We introduce the related work in Section 2. Section 3 presents the framework for similarity-based sales forecasting method and the similarity calculation strategy. In Section 4 we propose an improved ConvLSTM model and integrate it with Prophet model to improve the overall diversity. Section 5 shows the experimental results and evaluate our work. We summarize the work in Section 6.
From traditional statistical analysis methods to machine learning methods, as well as extensively studied deep learning methods, can all be used for sales forecasting. We explain the relevant research work from two aspects.
Similarity-based sales forecasting method
In this section, we first formulate the time series forecasting problem and similarity-based forecasting problem. Then we present the framework of the proposed S-SF method and discuss the details of the framework.
Problem formulation
The formal description of time series forecasting can be expressed as follows. Given a series of fully observed time series signals {
where the parameter vector will be learned in the training process.
Due to the different time-to-market of different products, it is hard to use the above method to forecast sales for some new products. Inspired by the idea of collaborative filtering, we propose a similarity-based sales forecasting method S-SF, i.e., the sales of the current product are fitted according to the sales of similar products. How to measure similarity has become the primary task.
Suppose
To forecast the sales of a product
Then, we forecast each retailers sale of product
The final step is to calculate the forecasted value of product
Figure 1 shows the framework of S-SF method. It is made up of three modules: similarity module, learning module, and forecasting module. The similarity module mainly deals with two types of calculations, time series similarity calculation and text similarity calculation. The calculation results are combined to generate top-k similar products, which will be taken as the input to the second module. In the learning module, an improved ConvLSTM model is built, and Prophet model is integrated into it to perform prediction operations for k similar products. Finally, in the forecasting module, alignment and scaling processing are performed according to the prediction results of similar products.
Figure 1 shows the framework of S-SF method. It is made up of three modules: similarity module, learning module, and forecasting module. The similarity module mainly deals with two types of calculations, time series similarity calculation and text similarity calculation. The calculation results are combined to generate top-k similar products, which will be taken as the input to the second module. In the learning module, an improved ConvLSTM model is built, and Prophet model is integrated into it to perform prediction operations for k similar products. Finally, in the forecasting module, alignment and scaling processing are performed according to the prediction results of similar products.
We consider the similarity between products in three ways. The first is about the sales trend, which is a comparison of time series data. The second is about the sales of different retailers and the third is about the attributes of products. Among them, the latter two are non-sequential data comparisons. After comparing multiple types of similarity, we will select the most similar products and then use machine learning to forecast for these similar products. Finally, the forecasting value of the product will be determined by these similar products. Method S-SF addresses the problem of sales forecasting for two different product categories. The first category of products has a long sales time and rich historical data. Generally, mature products are those that have more than 1 year of sales data, and are still in sale in recent months. The second category of products has a short sales time and a small amount of sales data. In this paper, new products are those that are sold in the market for less than 1 year. For new products, they have less sales data, poor market stability, and are extremely difficult to forecast. Due to different forecasting backgrounds, an integrated machine learning model is considered in this paper.
Framework of S-SF. It consists of three modules: similarity module, learning module, and forecasting module. The red box represents the target product to be forecasted.
Time series data are ubiquitous in our everyday life. In order to perform similarity comparison of time series data more effectively, the first step is denoising and normalization. After preprocessing, the similarity calculation of time series data will be more accurate. The following step 1) and step 2) will introduce the preprocessing strategy.
Denoising. Denoising is one of the key steps in the preprocessing of time series data. In order to make the similarity comparison result more reliable, the time series data participating in the comparison is usually required that their mean and variance do not change significantly within a certain period of time. According to the definition of standard deviation, 99.7% of values distributed within 3 standard deviations from the mean. We treat the values as noising that exceed 3 times of standard deviation, i.e.,
An example of exception value processing. The x-axis represents time and the y-axis represents sales. There are two blue markers, which are outliers and are replaced. Normalization. The sales trends for each product are different. Sales of some products will continue to grow, sales of some products will suddenly drop, and others will remain stable. For product
where Similarity calculation. In natural science, Pearson correlation coefficient is widely used to measure the degree of correlation between two variables, including time series variables, with values between

For products
The larger
If two products are sold by the same retailer, their sales trends will be similar. Here
For products
Attributes can be used to accurately describe the basics of a product and are one of the main indicators for measuring product similarity. It is also a non-sequence similarity calculation. Since product attributes such as brand and label are textual representations, there is no way to normalize them directly, so we convert the form of text into one hot coding to form a multidimensional vector. The Pearson similarity calculation method is still used here.
Through the above three kinds of similarity calculations, we get three similarity values,
where
An improved ConvLSTM model
ConvLSTM is a variant of LSTM. The main advantage is that more information can be extracted by turning the weight calculation in LSTM into a convolution operation. Here we make further adjustments to ConvLSTM, including adding more data to the input, adding attention mechanism, and modifying the loss function. We call the new model AttConvLSTM, attention mechanism based ConvLSTM.
Add periodic historical data to the input A large number of experiments have proved that ConvLSTM performs better than LSTM in time series prediction tasks. If only simple features are used as input to the model, it is also difficult for ConvLSTM to fit the varying time series data. A better way is to use more useful features. Here we extract additional features from the dataset to help the model fit better and achieve better predictions. Akaike information criterion (AIC) is a measure of the goodness of fit of statistical models, proposed by Japanese statistician Akaike in 1974 [20]. It is built on the concept of entropy and provides a standard for weighing the complexity of the estimated model and the goodness of the fitted data. AIC is defined as
where For time series forecasting, a critical but uncertain question is how much data to use as a cycle. When choosing the best model from a set of alternative models, we usually choose the model with the smallest AIC. Therefore, we calculated AIC values for ConvLSTM with periods from 1 to 50 for the dataset in the experiment. Some of the results are shown in Table 1. It can be seen from Table 1 that AIC of period 13 is the lowest, i.e., the model reaches the optimal state at period 13. The AIC values are also very low at period 26, 39, and 52. This shows that 13 is a very good cycle value. Actually, value 13 coincides with the length of a quarter, that is, sales data is cyclical every quarter. Based on AIC analysis, we use the data from the previous cycle as the second feature input of ConvLSTM, and these extra features help to better train the model. An instance of AIC statistics. The unit of period is a week, 7 days
Add attention mechanism
ConvLSTM has a better memory effect than RNN when dealing with longer time series, but there is still a lot of space for improvement in the effective screening of information. Fortunately, the attention mechanism can help preserve the intermediate results of ConvLSTM. We use self-attention model to learn and associate it with the output of ConvLSTM model for information screening purposes. This can greatly improve the learning effect of the model, so as to achieve the purpose of improving the accuracy of prediction. The ConvLSTM structure after adding attention mechanism is shown in Fig. 3.
The architecture of AttConvLSTM model where the yellow box represents the convolution operation and the blue box is the standard attention module.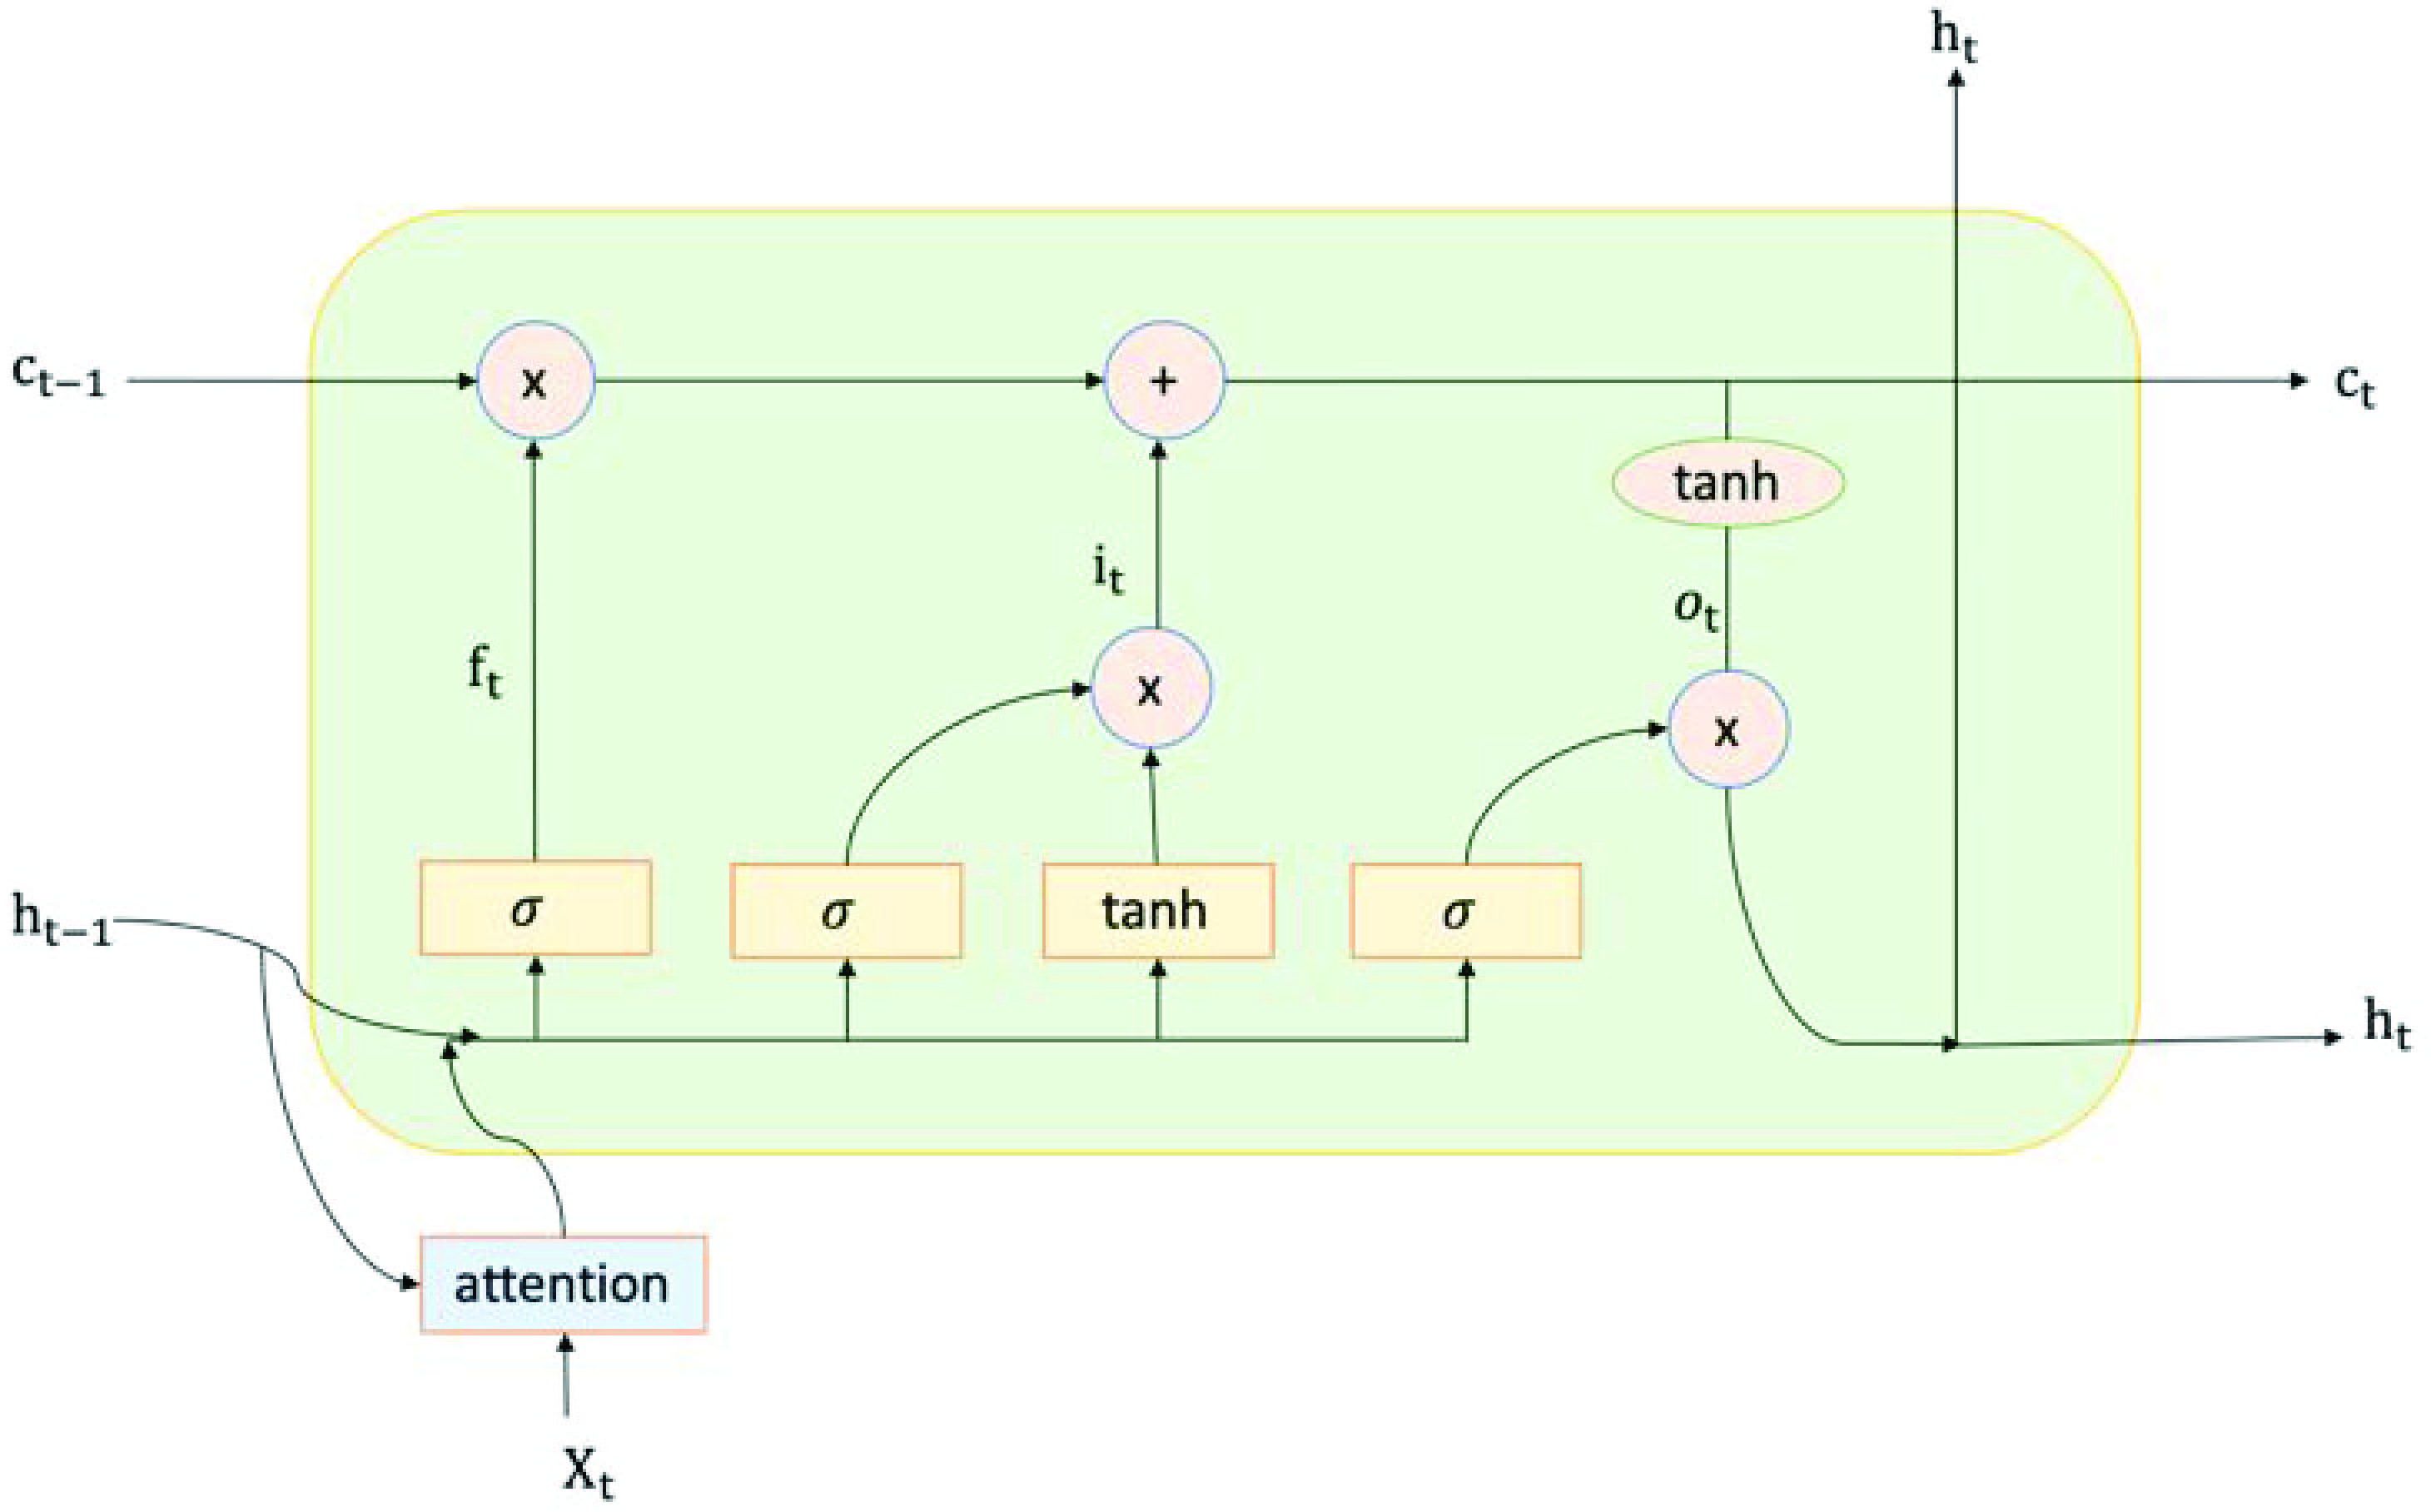
Modify the loss function
The loss function of ConvLSTM typically uses the mean squared error (MSE). However, MSE is not a convex function and has higher requirements on the amount of data and the number of iterations, so it does not help the model to fit quickly if the amount of data is not sufficient. Here we propose to use the convex function information entropy to optimize the loss function. Information entropy is defined as:
where
where
Research and our implementation show that a model cannot cope with multiple situations when faced with the time series forecasting problem. In the forecasting task, the following issues need to be considered. 1) The observation value is a piece of historical data given in hourly, daily, weekly, or monthly manner. 2) The periodic scale is not fixed. For example, a week includes seven days, one month contains 30 days, and one year contains 12 months. 3) There are some known important holidays, such as various legal holidays or traditional festivals. 4) There may be missing values or outliers in the data. 5) Trends are usually nonlinear changes that may reach natural limits.
Facebook Prophet is a model for forecasting time series data. It is based on a self-additive model that is used to fit non-linear trends of data such as year, week, season, and vacation. It is extremely robust to missing values, trend transitions, and a large number of outliers. For daily periodic data with at least one year of historical data, Prophet performs very well. Holiday information can also be added to Prophet to help the model eliminate outliers at the time of fitting, resulting in more accurate predictions. In addition to the holiday days, special dates can also be added, such as China’s Double 11 and 618 Shopping Festivals. The forecasting value at time t is expressed as:
where
Prophet uses L-BGFS to optimize and find the largest posteriori estimate of each parameter.
The prediction results obtained from AttConvLSTM and Prophet models are denoted as
It is possible to get multiple similar products through the first module, so the next step is to align and scale the predictions of several similar products to get the final prediction results. Figure 4 shows the process flow forecasting module.
For the alignment operation, there are three different situations to consider here. For each
If the sales retailer of the target product If the sales retailer of the target product If the sales retailer of the target product appears in multiple similar products, we use the average forecasted value of similar products. Next is the scaling operation. Although the forecasted value is obtained, the overall sales volume of each product is different, which will be adjusted as a weight. So, we need to add weights when calculating
The final sales forecasting value is
Process flow of forecasting. The main difference from the traditional forecasting method is that the data granularity is finer, and each retailers sales of the product is forecasted independently.
Experiment environment
ARIMA [5]: Autoregressive integrated moving average model. In the model of ARIMA (p, d, q), AR is “autoregressive”, p is the number of autoregressive terms, MA is the “sliding average”, q is the moving average number, and d is the number of differences to make the sequence more stable. SARIMA [14]: Seasonal autoregressive integrated moving average model. It is suitable for data with seasonal periodic changes. STL [21]: Seasonal-trend decomposition procedure based on loess. It is a common algorithm in time series decomposition, where loess is a robust regression algorithm. RNN [2, 7]: It is a type of neural network for processing sequence data and has shown great power in many tasks. LSTM [6]: Long short-term memory. It is a time recurrent neural network suitable for processing and forecasting important events with relatively long intervals and delays in time series. ConvLSTM [8]: Convolutional LSTM network. It is a variant of LSTM and replaces the fully connected layer in LSTM model with a convolutional layer. Prophet [6]: A model proposed by Facebook for forecasting time series data. It shows good performance for periodic time series data. MEAN: Average value model. Especially when forecasting new products, we can only use simple models instead of complex models because there is not enough historical data for reference. MA: Moving average. It is widely used because of its simple construction and easy parameter training. AttConvLSTM: A new model proposed in our paper. It is based on ConvLSTM by adding an attention mechanism and using a new loss function. AttConvLSTM+Prophet: An integrated model proposed in our paper. We adopt a simple linear integration approach. S-SF: A forecasting method proposed in our paper. The integrated model AttConvLSTM+Prophet is used and the similarity module is also included in it.
Root mean square error (RMSE):
Mean absolute error (MAE):
Anomalous correlation coefficient (ACC):
where
We have found through experiments that AttConvLSTM performs best when the sales sequence spans more than 1 year. When the sales sequence spans less than 1 year, Facebook prophet performs best. After comprehensive consideration, we use 1 year as the criterion for segmenting mature products and new products. For products with different sales times, different weight settings are used in model integration. The sales forecasting of Retailer
where 0.6 and 0.4 are different weights representing different importance, and time refers to the sales time of product
Table 2 shows the experiment results, where 1) each line shows the results of three metrics and two datasets for a particular model, 2) each column shows the results of different models for a specific metric and a specific dataset, 3) each bold-faced value indicates the best result of a specific metric corresponding to all models, and 4) each underlined value indicates the best result of a specific metric corresponding to all models except two models AttConvLSTM and AttConvLSTM+Prophet, which are proposed by us.
Results summary (in MAE, MSE,and ACC) of all methods on two types of datasets
From the results in Table 2, we can find that regardless of our proposed models AttConvLSTM and AttConvLSTM+Prophet, models ConvLSTM and Prophet perform best. ConvLSTM performs better for long-term time series prediction, and Prophet performs better for short-term time series prediction. The excellent performance of these two models also proves that our previous decision to linearly integrate these two models is reasonable. Obviously, from the results of three metrics, the proposed AttConvLSTM+Prophet model performs best for both datasets. Compared to the best results of the existing models, AttConvLSTM+Prophet can reduce 5.3% on MAE and RSME, and improve 4% on ACC. Furthermore, after adding the attention mechanism, the accuracy of ConvLSTM has been further improved.
The above experiments mainly verify the validity of the proposed model. The similarity module is not included because the similarity module does not directly affect the forecasting model. Next, the role of the similarity module in S-SF method will be mainly discussed.
Firstly, the choice of k value in top-k selection has a great influence on the results of the method, because we do not know how many similar products should be used to achieve the best prediction effect. We do experiments on different k values and find that k
Comparison of S-SF method with other methods. Sim refers to similarity module
Comparison of S-SF method with other methods. Sim refers to similarity module
Table 3 shows a comparison of S-SF method with several other methods, where 1) each line shows the results of three metrics for a particular method, 2) each column shows the results of different methods for a specific metric, 3) each bold-faced value indicates the best result of a specific metric corresponding to all methods, and 4) each underlined value indicates the best result of a specific metric corresponding to all methods except S-SF, which is proposed by us. We can see that S-SF performed best. Compared to Prophet, it can reduce MAE by 52.6%, reduce RMSE by 52.6%, and improve ACC by 128.7%. Moreover, after adding the similarity module, the performance of other models even exceeds Prophet. It can be seen that the forecasting method based on similarity proposed in this paper is effective.
Traditional sales forecasts typically predict a products future sales based on its historical sales trends and its related attributes. In this paper, we propose to use the predicts of similar products to fit the sales of the target product. The proposed method S-SF is especially suitable for newly listed product predictions with a small amount of historical data. For time series forecasting task, ConvLSTM model is suitable for mature products and Prophet model is suitable for new products, so we propose to build a new model AttConvLSTM based on ConvLSTM by adding more periodic data as input, adding attention mechanisms, and modifying the loss function, and then integrate it with Prophet. The experimental results show that S-SF method has higher accuracy and better diversity. Since the idea of sales forecasting based on similar products shows good results in this paper, we will further study the more fine-grained similarity calculation strategy.
Footnotes
Acknowledgments
This research is supported by the National Key R&D program of P. R. China (Grant No. 2017YFC 0907505).