
Abstract
Ovarian cancer is a malignant tumor that poses a serious threat to women’s lives. Computer-aided diagnosis (CAD) systems can classify the type of ovarian tumors, but few of them can provide exactly the location information of ovarian cancer cells. Recently, deep learning technology becomes hot for automatic detection of cancer cells, particularly for detecting their locations. In this work, we propose a novel end-to-end network YOLO-OC (Ovarian cancer) model, which can extract the characteristics of ovarian cancer more efficiently. In our method, deformable convolution is used to enhance the model’s ability to learn geometric deformation in space. Squeeze-and-Excitation (SE) module is proposed to automatically learn the importance of different channel features. Data experiments are conducted on datasets collected from The Affiliated Hospital of Qingdao University Medical College, China. Experimental results show that our YOLO-OC model achieves 91.83%, 85.66% and 73.82% on mean average precision mAP@.5, mAP@.75 and mAP@[.5,.95], respectively, which performs better than Faster R-CNN, SSD and RetinaNet on both accuracy and efficiency.
Introduction
Ovarian cancer is the second most common cause of gynecologic cancer death in women around the world [1]. The ovary is located deeply in the pelvic cavity, and it is difficult to detect the disease in the early stage and the disease develops rapidly. Serous cystadenoma carcinoma is the most common ovarian cancer, accounting for 70% of epithelial ovarian cancer, and its 5-year survival rate is as low as 40% [2]. In addition, common ovarian cancers include endometrioid carcinoma, clear cell carcinoma, and mucinous cystadenoma carcinoma. Diagnosis is the prerequisite for treatment, and timely diagnosis of ovarian cancer type is extremely significant for improving ovarian cancer patients’ survival rate.
Recently, convolutional neural networks (CNNs) have developed rapidly in the fields of image classification, object detection, and semantic segmentation [3, 4, 5]. The task of image classification is to divide the image into a category, which corresponds to the most prominent object on the image with smaller object to be ignored. Since almost all practical images contain multiple objects, it is crude to use such models to assign a single label to an image [6, 7]. In CT images, there are organs and lesions of a certain part of the body. Detecting the positions and types of lesions on CT images exactly is important for disease diagnosis.
So far, many researchers have applied deep learning to medical images [8, 9, 10, 11]. Similarly, there are many researches on the combination of deep learning and ovarian cancer images. Wang et al. explored an SVM-based automatic recognition algorithm for ovarian cancer diagnosis using photoacoustic imaging [12]. It is proposed deep convolutional neural network (DCNN) based on AlexNet to automatically classify different types of ovarian cancer from cytological images achieving accuracy 78.20% [13]. In [14], four mainstream classification models: VGG-16, ResNet-50, DenseNet and GoogleNet (Inception V3) are developed to classify cancer cell subtypes on ovarian ultrasound images, where GoogleNet (Inception V3) ranks first with 92.50% accuracy. After that, an early diagnosis system for ovarian cancer detection with improved deep learning network and cost-sensitive learning is obtained in [15].
Until now, most CAD systems are used for ovarian cancer diagnosis classification, and cannot provide the specific location of the tumor. Furthermore, most of the existing models are trained on ultrasound images, so it is urgent to develop a CAD system to detect ovarian cancer on CT images. It is shown in Fig. 1 the boundary between tumor and non-tumor, where the cancer regions is not clear and the shape of the tumor is irregular. This undoubtedly puts forward higher requirements on the ability of the detection network to extract features.
(a) and (b) are two different types of tumors, in which the red borders are marked by professional radiologist. The boundary between the tumor area and the non-tumor area is not obvious in (a), and the shape of the tumor is irregular in (b).
In the work, we propose a novel YOLO-OC model by improving on the basis of YOLOv3, which can detect location information of ovarian cancer cells on CT images quickly with acceptable accuracy. Specifically, in YOLO-OC, we introduced deformable convolution from [16, 17] to enhance the model’s ability to learn geometric deformation in space. Squeeze-and-Excitation (SE) module [18] is proposed to automatically learn the importance of different channel features. We add SE blocks to the Darknet53 to suppress inaccurate semantic information in low-level features. It is used kmeans++ to generate priori anchor boxes to obtained a higher value to average IOU (Intersection over Union).
Data experiments are conducted on datasets collected from The Affiliated Hospital of Qingdao University Medical College, China. Experimental results show that our YOLO-OC model achieves 91.83%, 85.66% and 73.82% on mean average precision mAP@.5, mAP@.75 and mAP@[.5,.95], respectively, which performs better than Faster R-CNN, SSD and RetinaNet on both accuracy and efficiency.
There are two types of current mainstream object detection algorithms: two-stage method and one-stage method. In two-stage method, it firstly extracts candidate regions from the input image, and then classifies each candidate region. The common two-stage networks are R-CNN series models, including R-CNN, Fast R-CNN, Faster R-CNN, Cascade R-CNN and Dynamic R-CNN. One-stage method is an end-to-end detection network, which doesn’t need to find candidate regions separately, like SSD (Single Shot MultiBox Detector) and YOLO series models [19]. Most of the above-mentioned networks are based on anchor boxes. In recent years, anchor-free method without anchor boxes is also a research highlight of object detection. Its representative networks include CornerNet and CenterNet.
Two-stage detectors
One-stage detection network runs rapidly, while two-stage detection network is with higher accuracy. For example, R-CNN is adopted for selective search to obtain about 2000 regions of interest (ROI) [20]. These regions are converted into fixed-size images and sent to convolutional neural networks, respectively. Fast R-CNN [21] applied CNN to extract the features of the entire image, and created candidate regions on the feature map, which improved the detection speed. In [22], Faster R-CNN adopted the Region Proposal Network (RPN) to generate ROI, which greatly improved the detection speed. Cascade R-CNN used cascade regression as a resampling mechanism to increase the IOU value of proposal by stage, so that the proposals resampled by the previous stage can adapt to the next stage with higher threshold [23]. Dynamic R-CNN not only adjusted the IOU threshold but also Smooth L1 loss parameters according to the sample distribution during training [24].
One-stage detectors
YOLOv3 divided the feature map into
Materials and methods
Materials
Dataset of CT images used in data experiments are collected from The Affiliated Hospital of Qingdao University, China. The study are approved by the ethics committee. All patients are anonymous and personal information has been filtered. After filtering out invalid data, we collected pelvic CT images with manual annotations and corresponding pathological reports for 223 patients. We use a graphical image annotation tool, named LabelImg, to label the CT images according to the manual marking of professional doctors and submitted them for verification. After verification by medical experts, it is obtained more than 5100 CT images of ovarian cancer with lesions. There are five types of image labels, namely endometrioid carcinoma, clear cell carcinoma, mucinous cystadenoma carcinoma, serous cystadenoma carcinoma and others. They are shown in Fig. 2.
Number of data used for training and testing
Number of data used for training and testing
The five types of CT images of ovarian cancer: (a) Endometrioid carcinoma; (b) clear cell carcinoma; (c) mucinous cystadenoma carcinoma; (d) serous cystadenoma carcinoma; (e) others.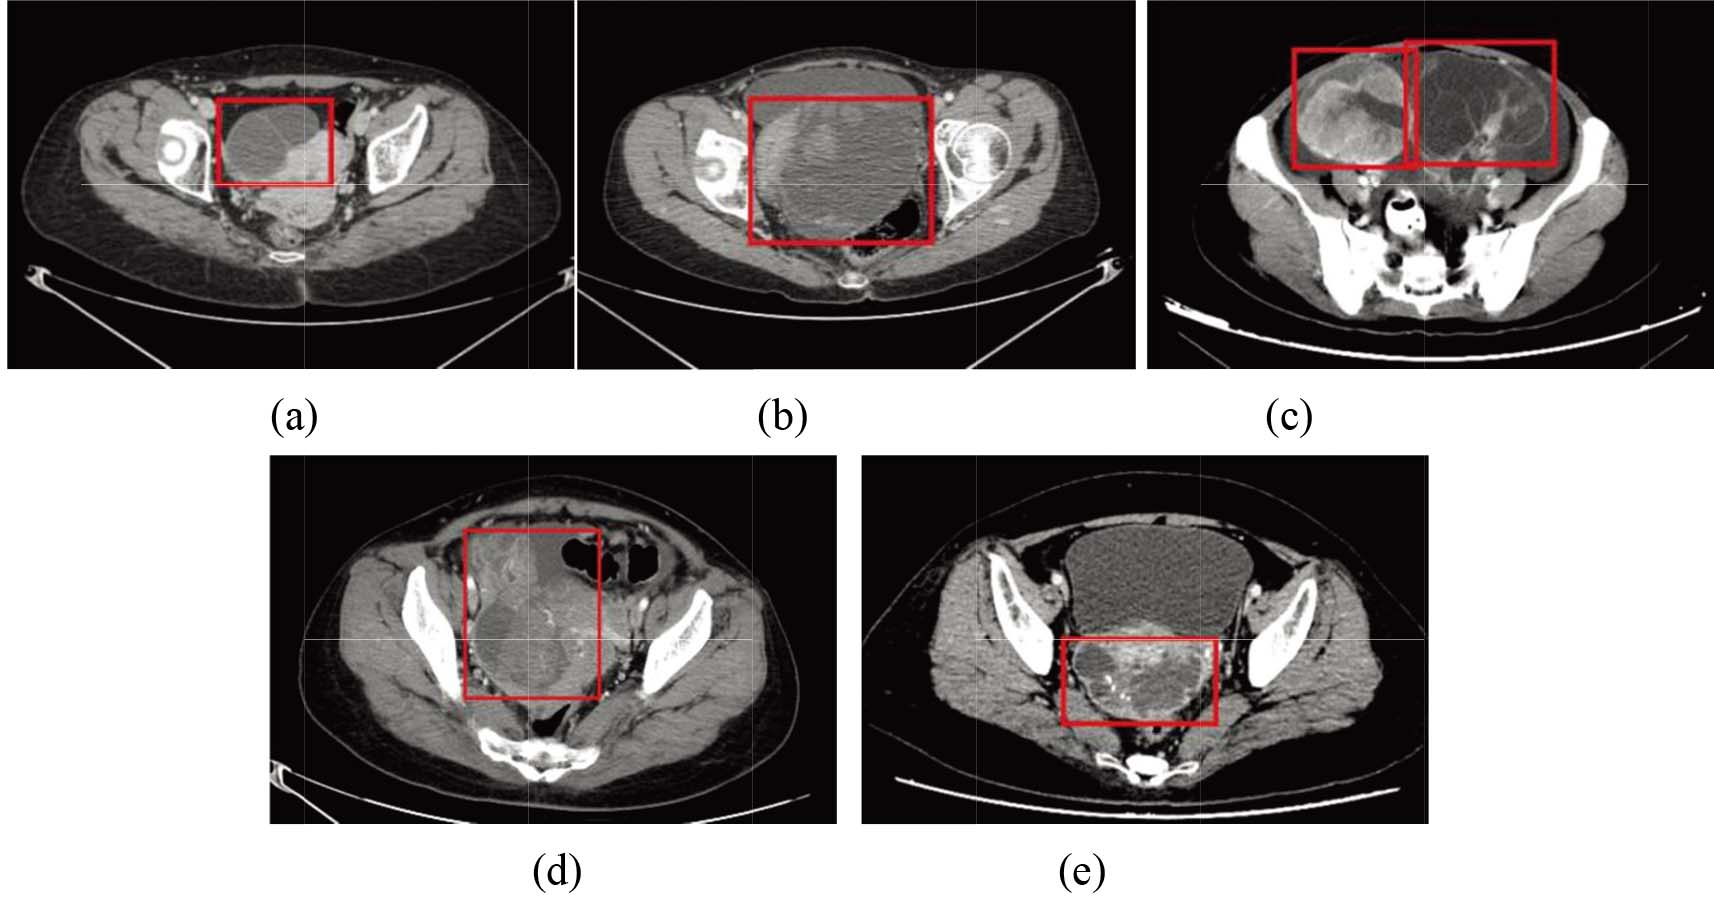
The amount of CT images after data augmentation.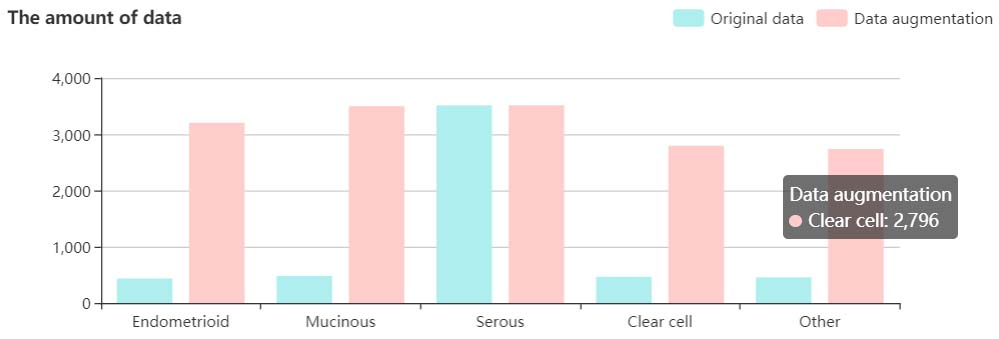
As illustrated in Table 1 and Fig. 3, since the amount of data of serous cystadenoma cancer was much larger than the other four types, we employed the data augmentation method of horizontal rotation and zoom deformation to expand the number of other four types of images (the images obtained using data augmentation are only used for training).
In this section, we introduce the topological architecture of the model, and then the detection process of YOLO-OC with specific improvements including Kmeans++, Deformable Convolution, Attention Mechanism and the SSP Module.
The YOLO-OC network architecture
In this subsection, we propose a novel YOLO-OC model to detect ovarian cancer by characteristics of fuzzy boundary and unobvious features of ovarian tumors. The network architecture of YOLO-OC is shown in Fig. 4.
YOLO-OC network architecture.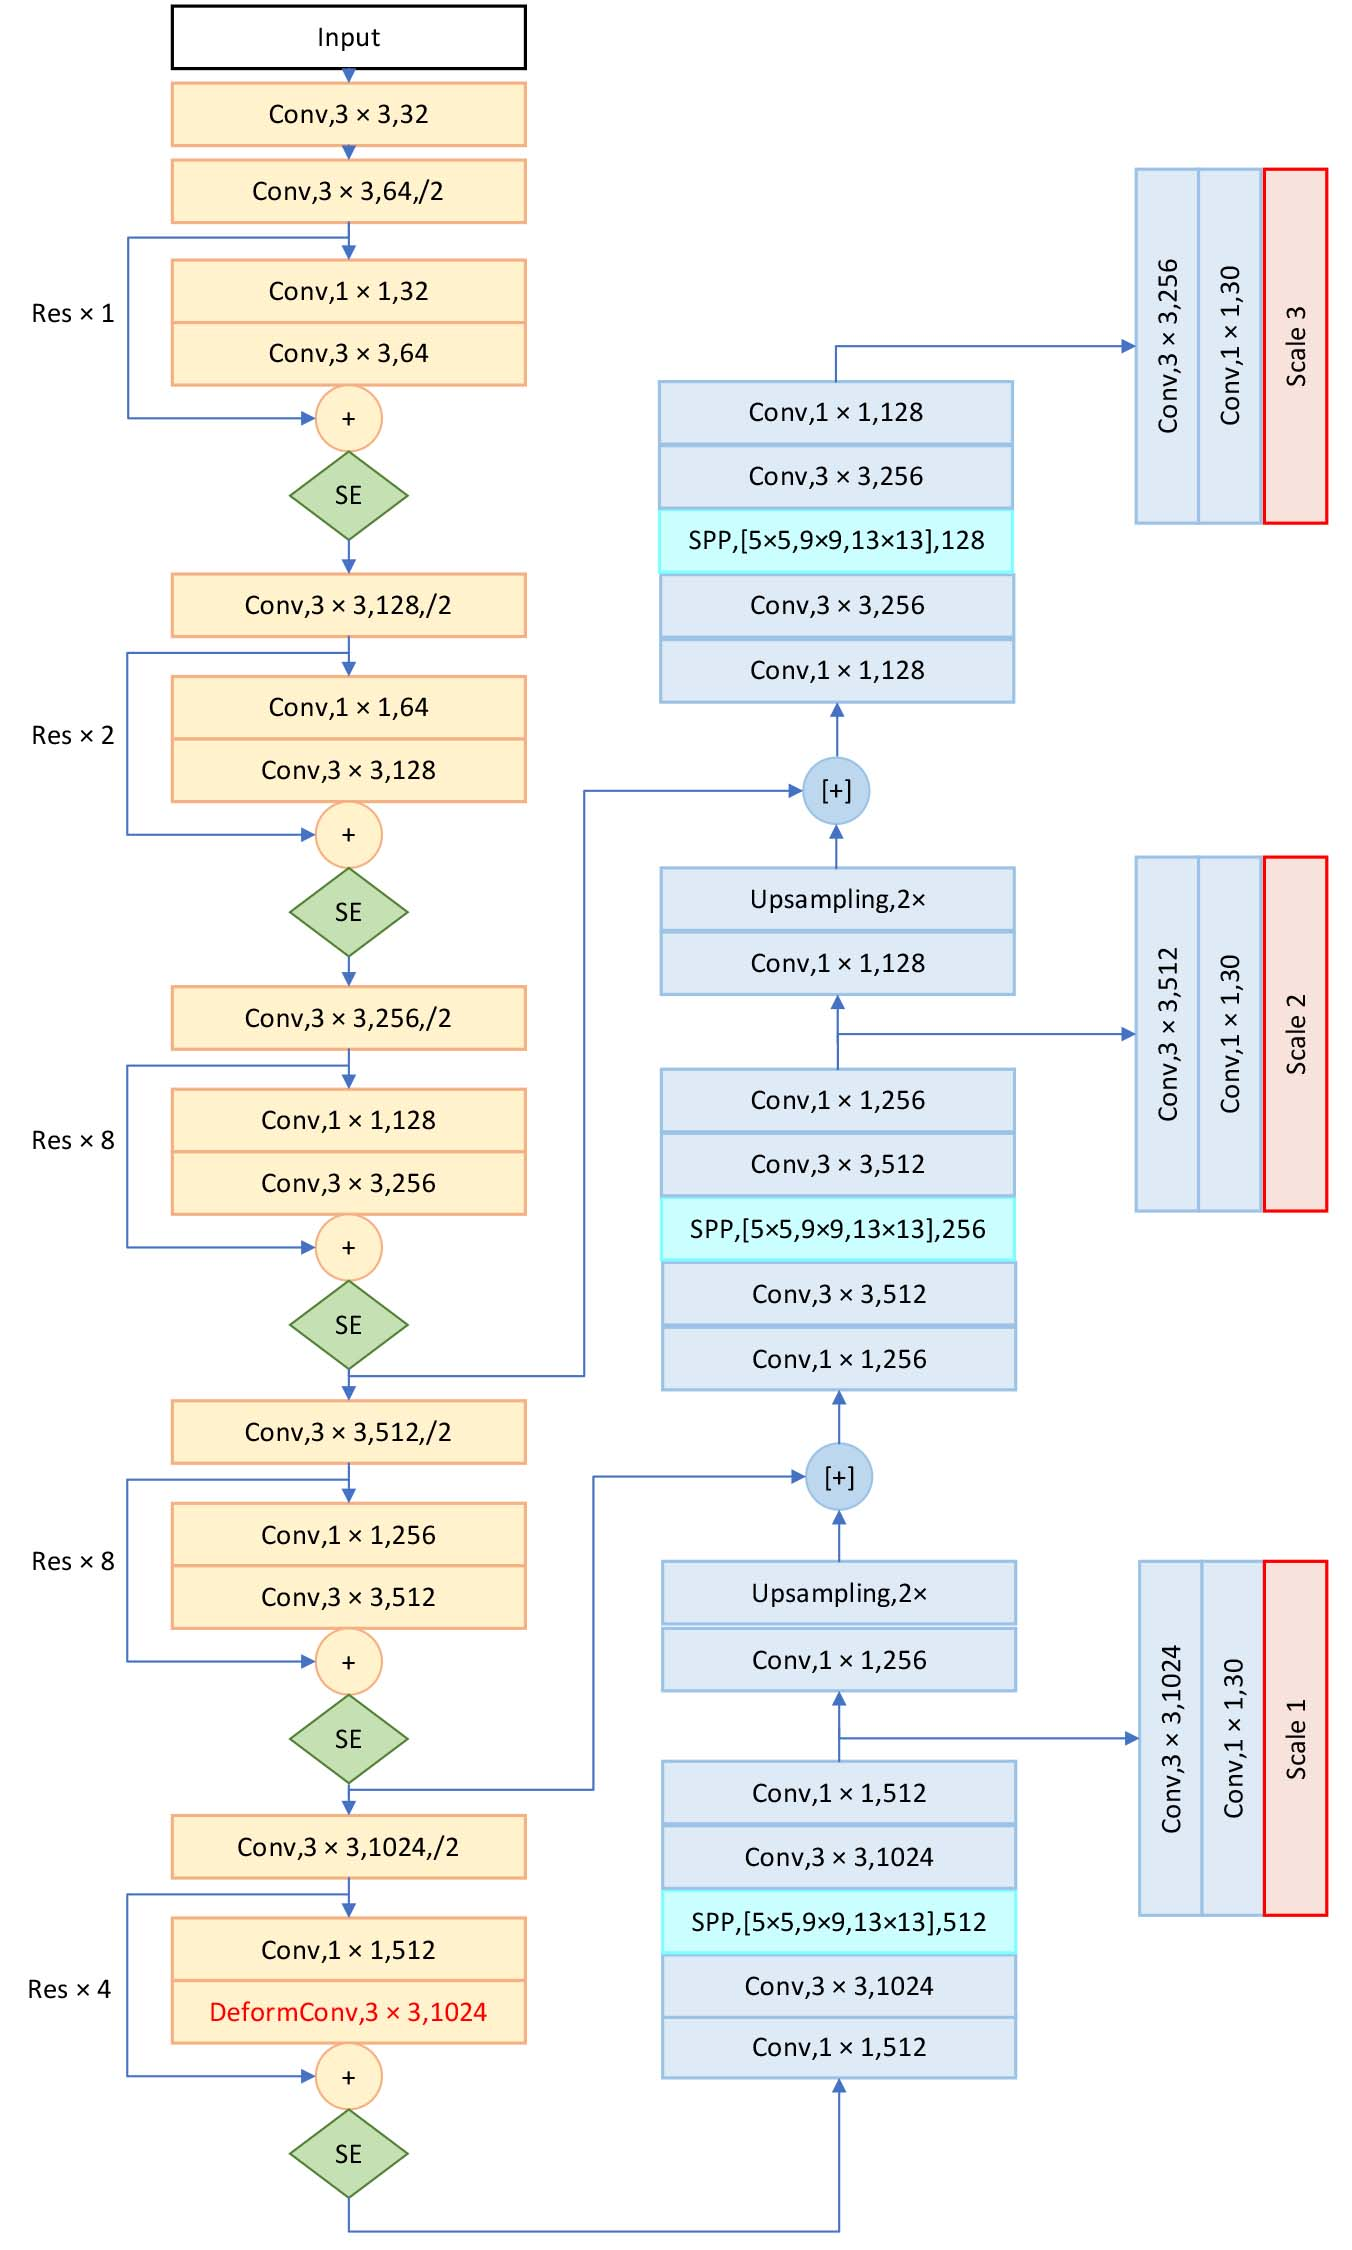
YOLO-OC adopts the improved Darknet53 as the backbone network to extract features. The improvements made by YOLO-OC are as follows.
Introducing deformable convolution in the residual block of the backbone network to increase the flexibility of the convolution operation. Adding attention channels after each short-cut layer to distinguish the importance of feature maps. Introducing SPP modules in front of the three detection ports to promote feature fusion.
In object detection, the low-level feature semantic information is relatively small, but the object location information is accurate, while the high-level feature is just the opposite. YOLO-OC applies Feature Pyramid Networks (FPN) to fuse feature maps of three scales (13
It is shown in Fig. 5 that YOLO-OC first extracts features from the input image through the improved Darknet53 to obtain a feature map of a certain size, such as 13
In YOLO series models, prior anchor box is used to detect the object, which has a significant influence on the positioning accuracy. The default 9 prior anchor boxes of three scales in YOLOv3 are the result of clustering the COCO dataset using the Kmeans algorithm [31]. The defect of Kmeans algorithm is that it randomly initializes the cluster centers. In YOLO-OC, we adopt Kmeans++ algorithm to initialize the clustering center to improve the average Intersection over Union (IOU) of the prior anchor box and ground truth. The process of Kmeans++ algorithm is shown in Table 2.
The process of Kmeans++ algorithm
The process of Kmeans++ algorithm
The detection principle of YOLO-OC model.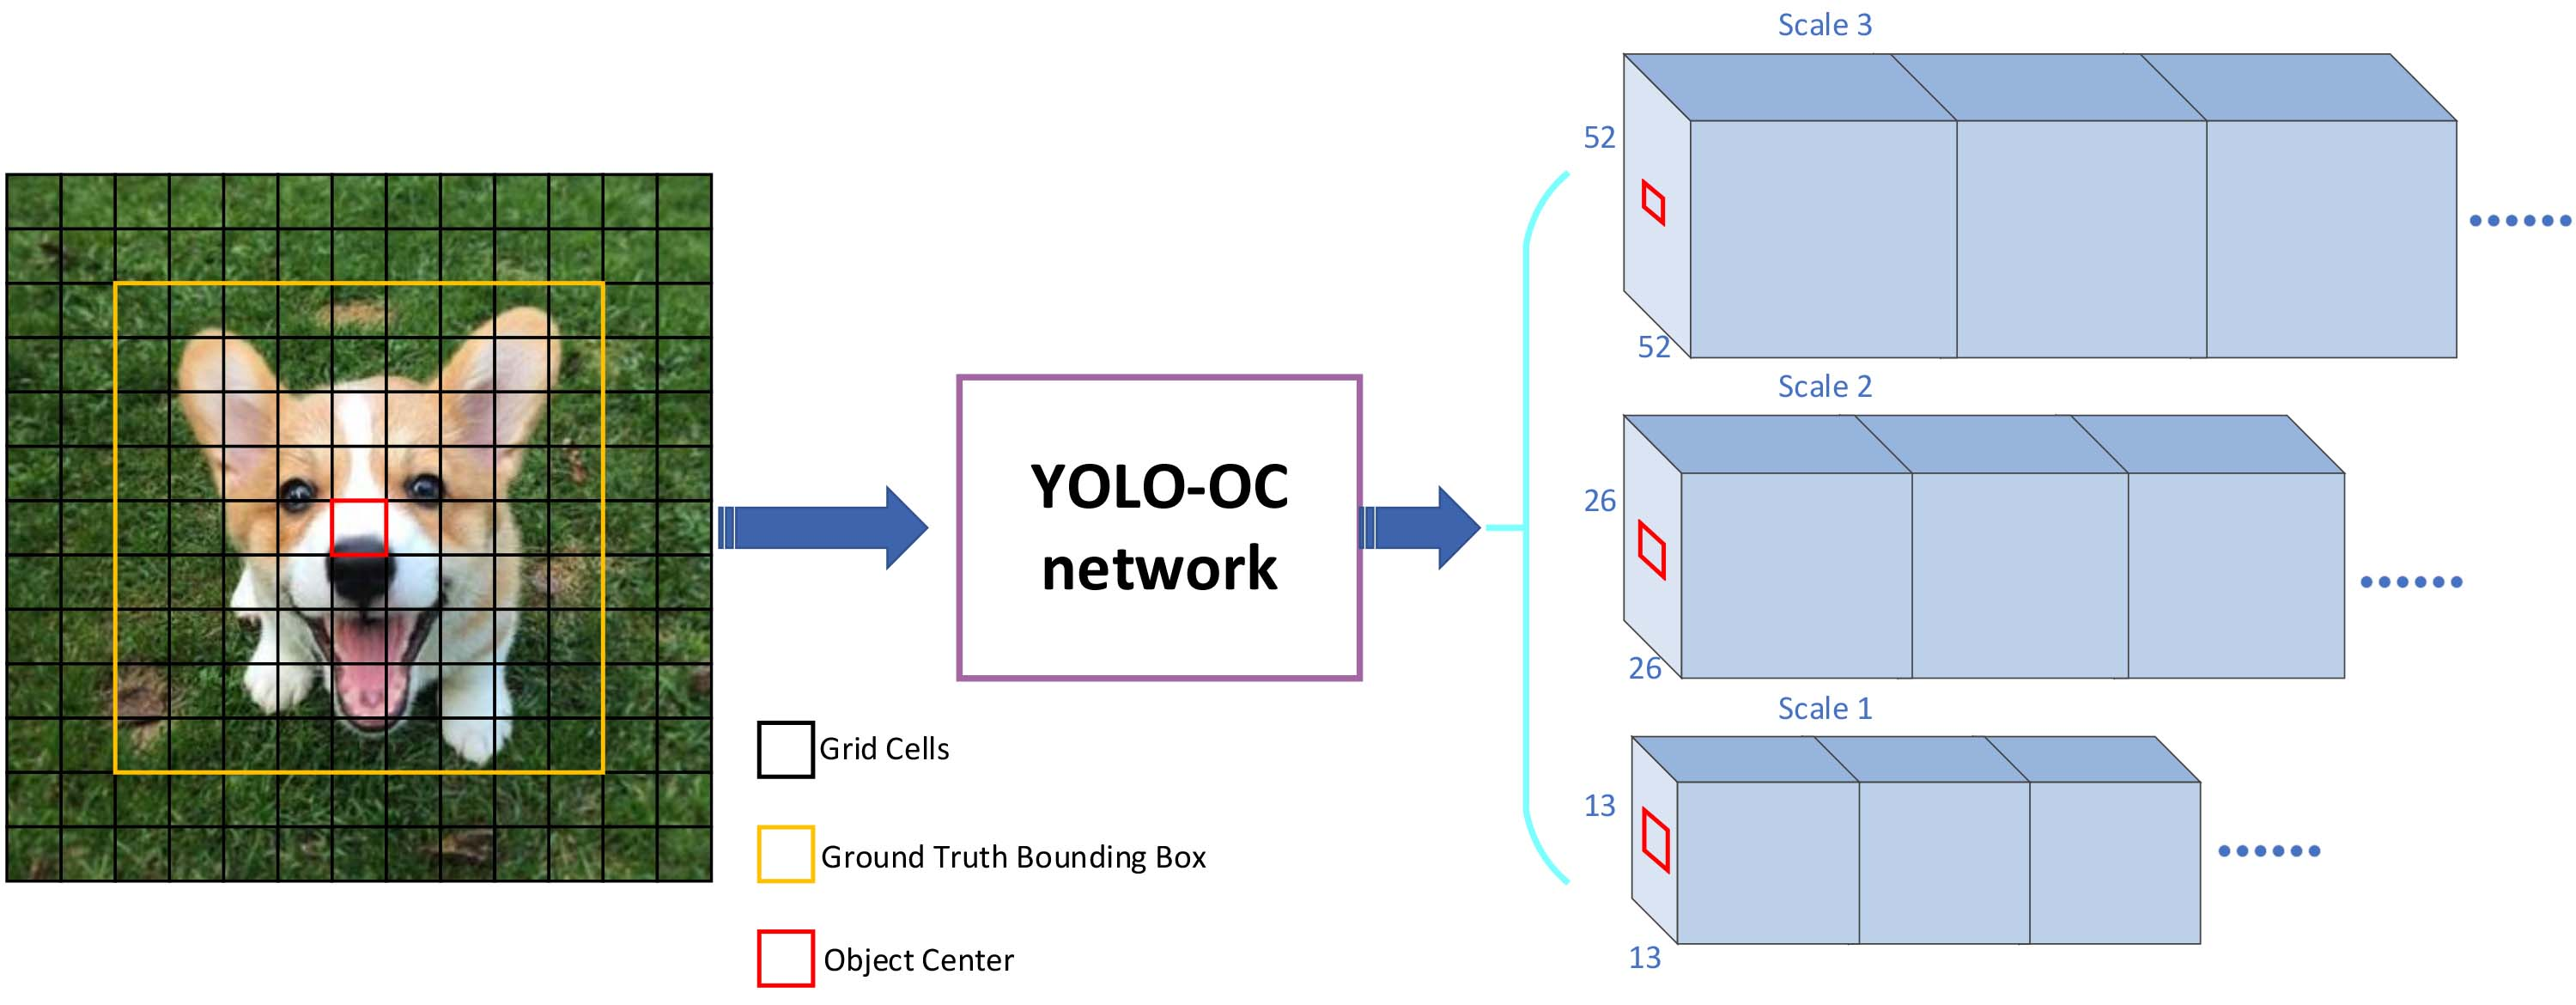
Some ovarian tumors invade other tissues, resulting in irregular shapes. Since the geometric structure of the modules used to construct the convolutional neural network (CNN) is fixed, its geometric transformation modeling capability is essentially limited. This reduces the recognition rate. In Deformable ConvNets v1 (DCNv1), an offset variable is added to each sampling point of the convolution kernel, and the offset variable is learned by the network. As shown in Fig. 6, the convolution kernel with added offset variables is no longer limited to regular sampling. It is shown in Fig. 7 the framework of deformable convolution.
The sampling method of normal convolution and deformable convolution with a convolution kernel size of 3 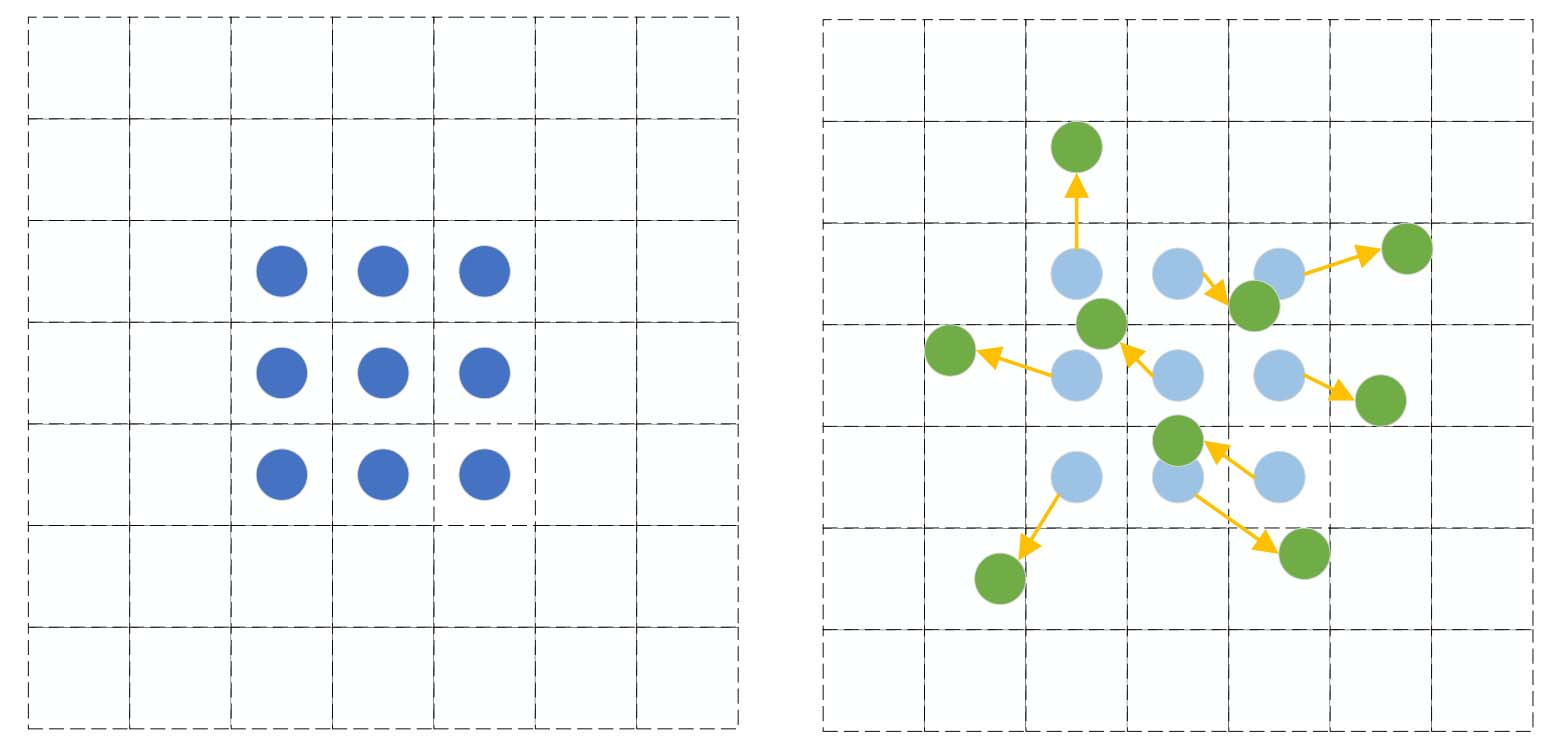
Illustration of deformable convolution.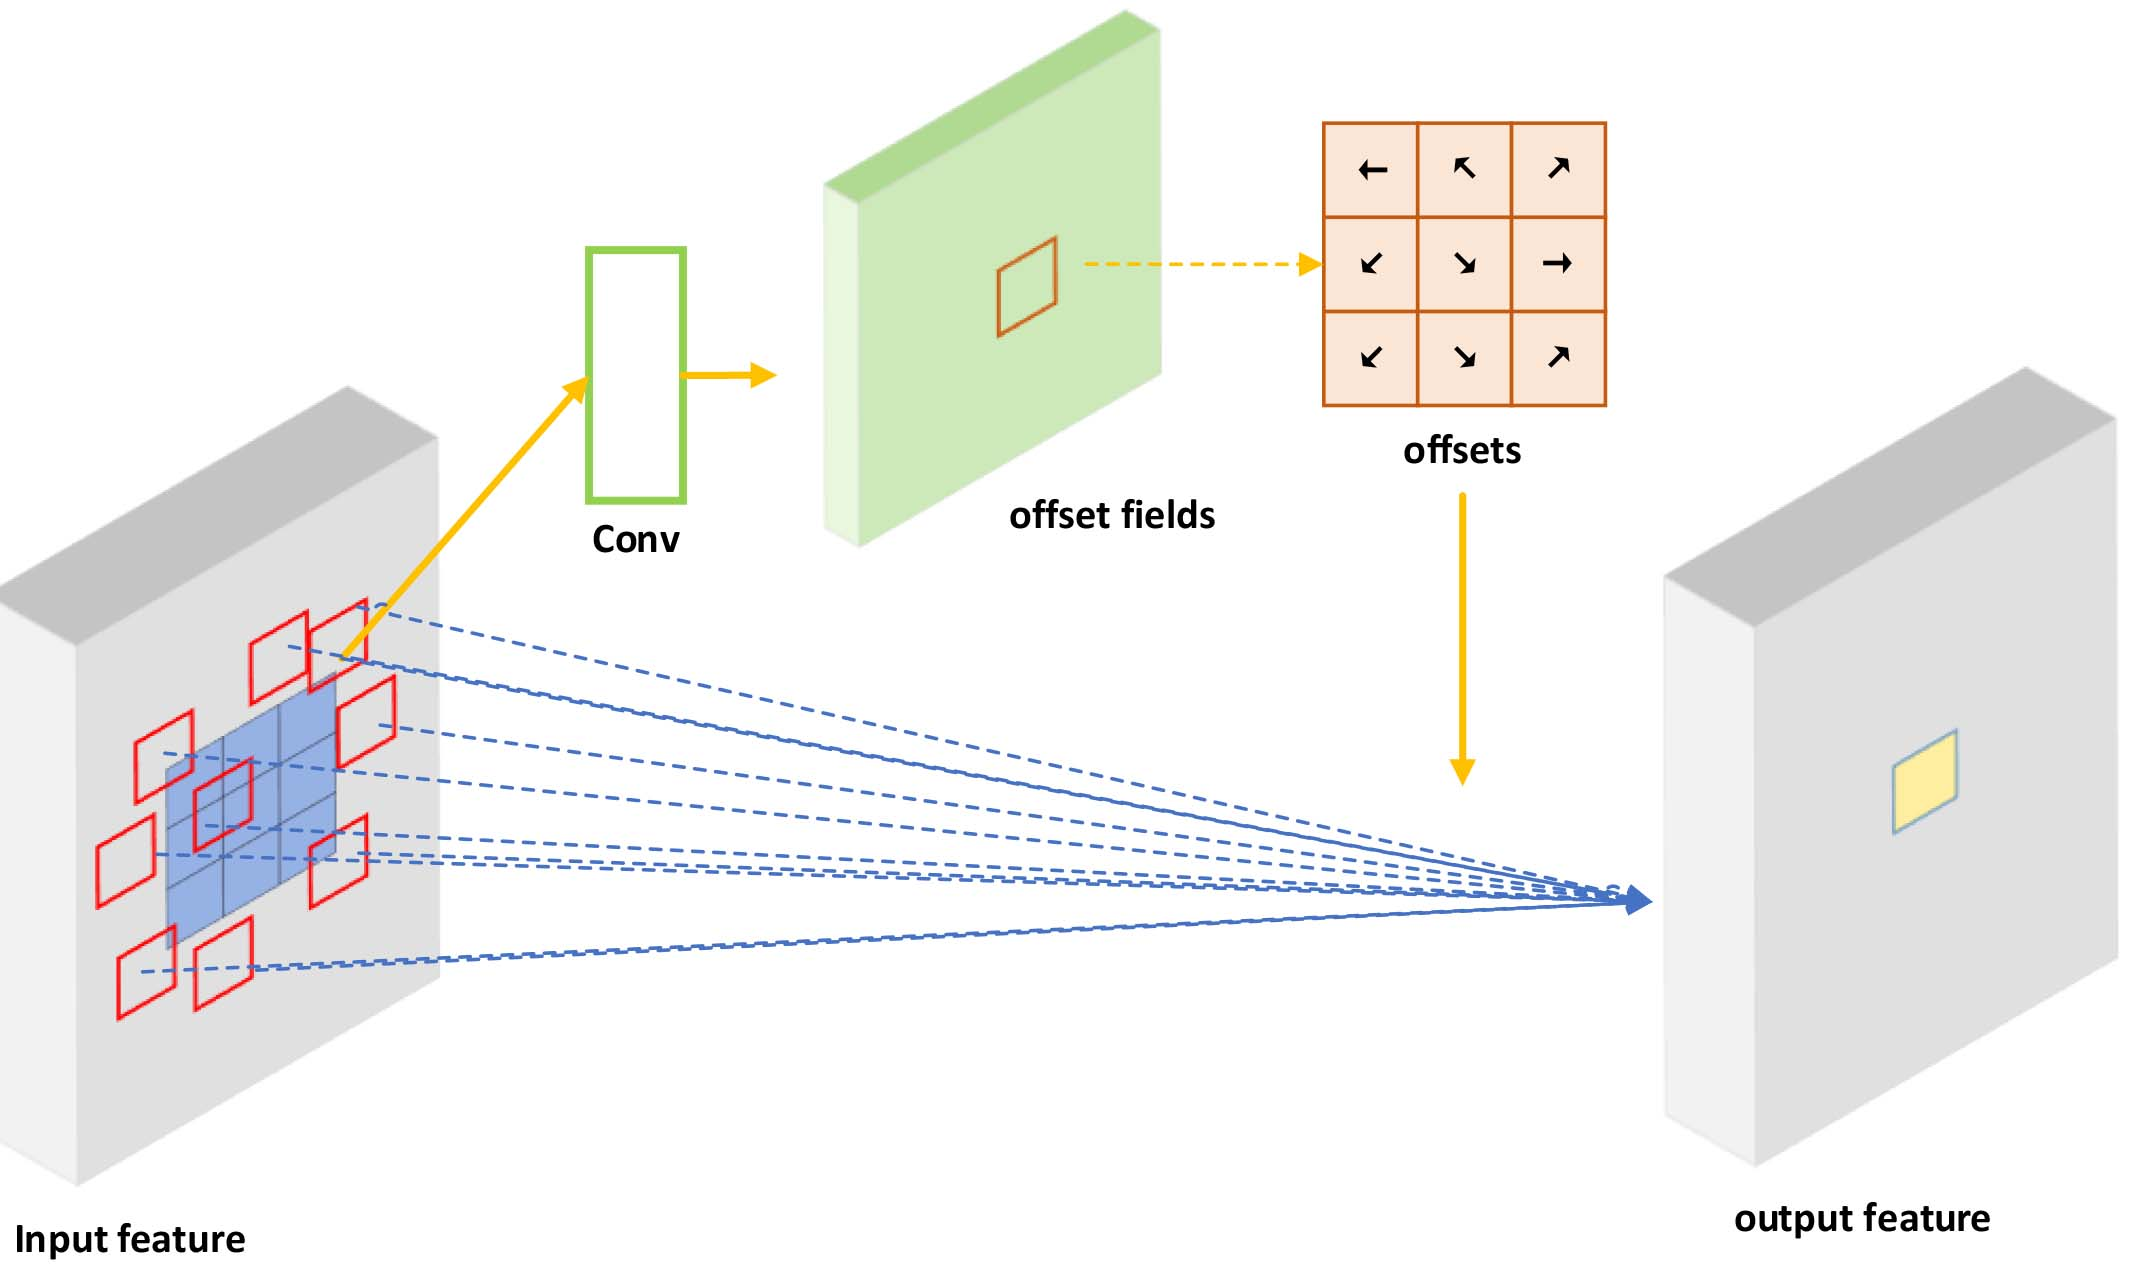
The above convolution is used to output the offset, the length and width of the output are the same as the input feature map, and the dimension is twice the input feature map (the offsets in the x direction and y direction are stored separately).
We define the 3
where
Since
In YOLO-OC, we measure the improvement of network performance by DCNv1 and DCNv2. Experimental results show that DCNv2 brought greater precision improvement. The biggest improvement achieved by DCNv2 over DCNv1 is the addition of weights for each sampling point. It gives the convolution kernel a larger change space. For some unwanted sampling points, the weight can be learned as 0.
where
Squeeze-and-Excitation (SE block) is a channel attention module, which can automatically obtain the importance of each feature channel through learning. We add SE blocks between each residual block of Darknet53 to increase the weight of important feature maps. As shown in Fig. 8, the SE block is composed of Squeeze, Excitation, and Reweight. Squeeze corresponds to global average pooling, which converts the input of H
The process of SE block.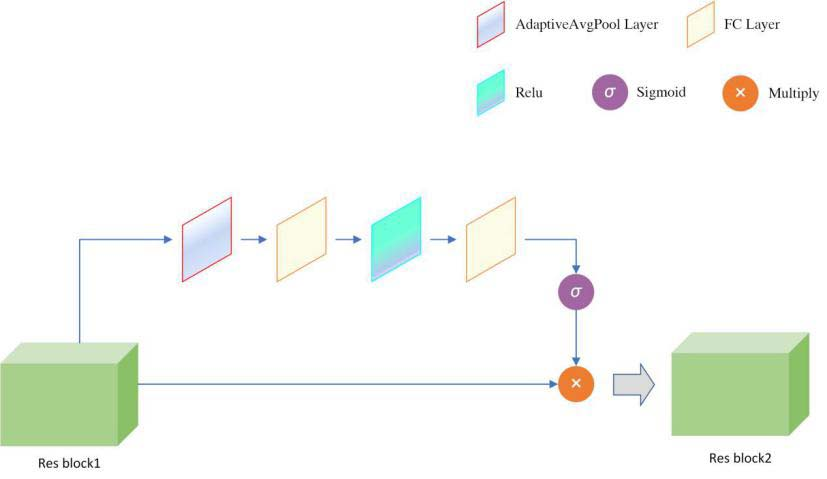
Excitation is similar to the gate mechanism in Recurrent Neural Network (RNN), which generates weights for each feature channel through parameters. Excitation contains two fully connected layers (respectively used for reducing dimensions and ascending dimensions), which is a RELU (Rectified Linear Unit) activation layer and a Sigmoid gate. This design can reduce the amount of calculations and parameters as well as increase the nonlinearity of the module. We regard the weight of the Sigmoid gate output as the importance of each feature channel after feature selection. The weight is multiplied channel by channel to the previous feature to complete the Reweight operation.
YOLO-OC draws lessons from the idea of spatial pyramid pooling to realize the fusion of local features and global features through SPP module. As shown in Fig. 9, SPP module is composed of four parallel branches, which are the maximum pooling of kernel size 1
Internal details of the spatial pyramid pooling module.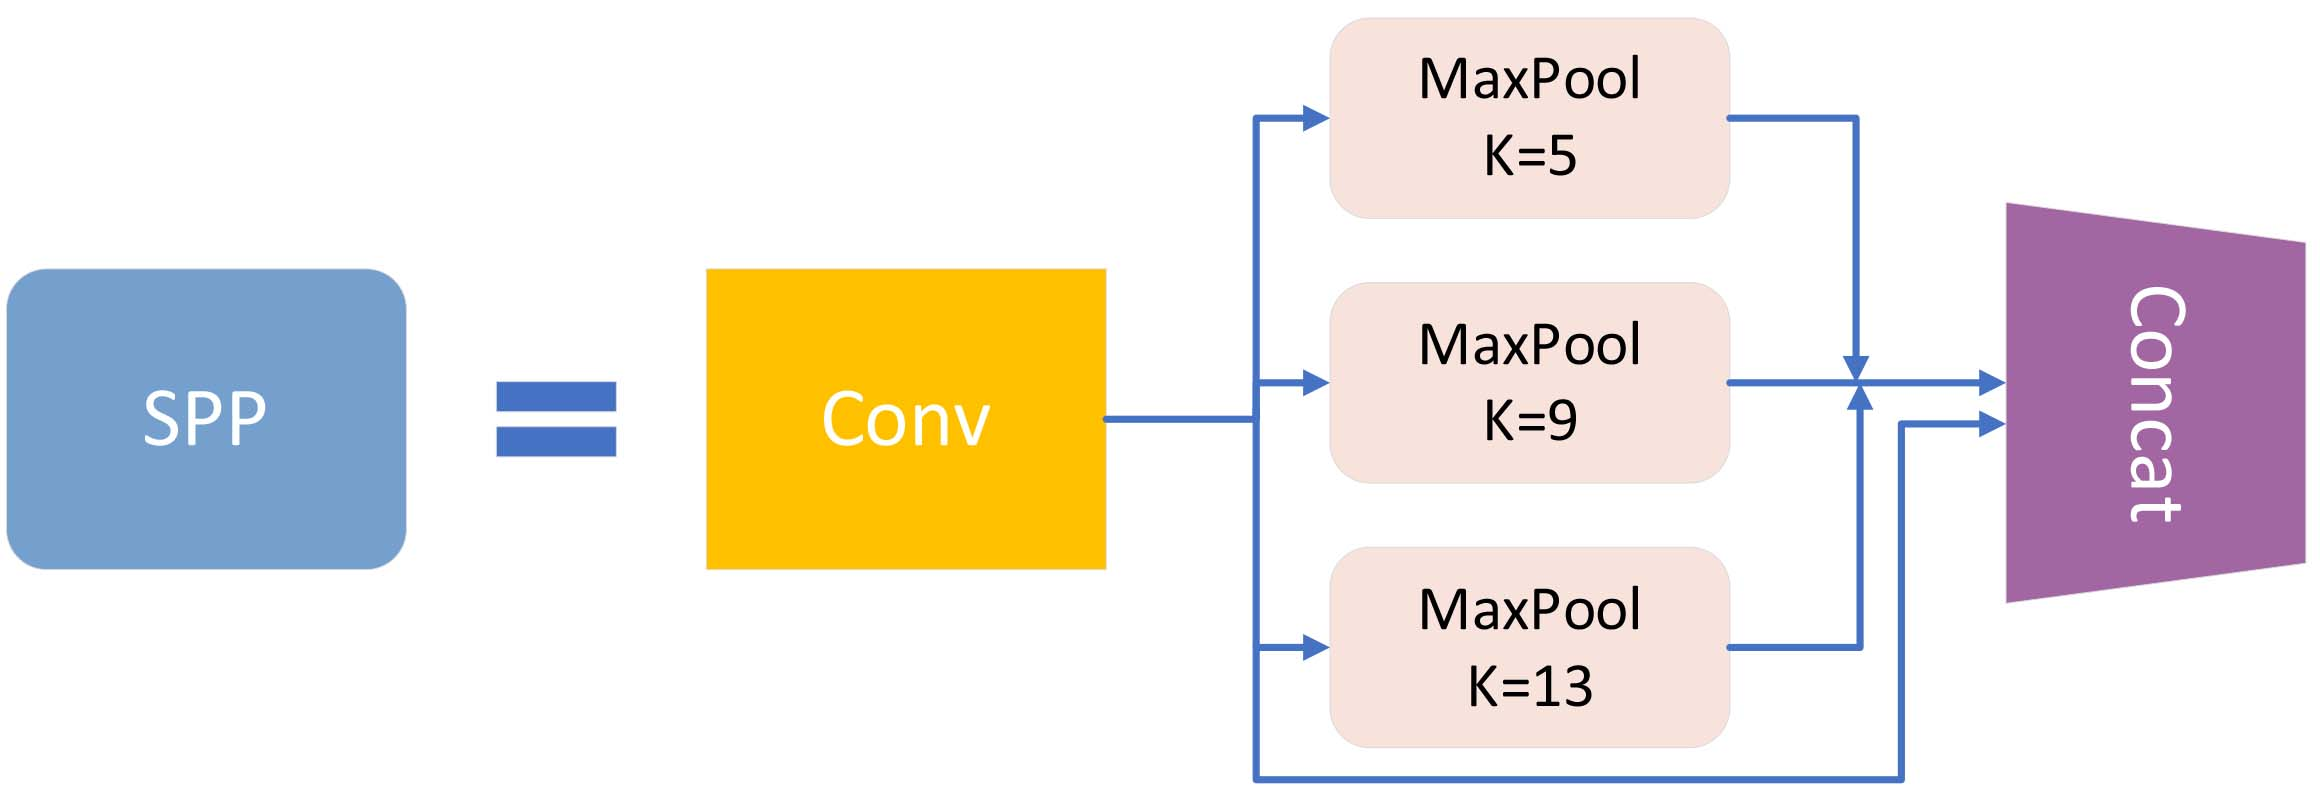
Parameters and evaluation metrics
Data experiments are run on Ubuntu 16.04 OS with 6
The accuracy evaluation indicators of all models are in mAP@.5, mAP@.75 and mAP@[.5,.95]. mAP@.5 and mAP@.75 corresponded to the average detection precision of the IOU threshold of 0.5 and 0.75, respectively. We denoted mAP@[.5,.95] by the average mAP at different IOU thresholds (0.5 to 0.95, step size: 0.05). IOU is defined as the intersection of the detection result and ground truth divided by their union. TP, FP, FN and TN represent true positive, false positive, false negative and true negative respectively. Precision is the ratio of true positives in the identified samples. Recall is the proportion of all positive samples that are correctly identified as positive samples. Changing the recognition threshold will cause the precision and recall values to change, resulting in a P-R curve. AP is the area under the P-R curve. Generally speaking, the better the classifier, the higher the AP value. mAP is the average of AP for multiple categories.
Kmeans++
Choosing the appropriate prior anchor box can speed up the regression of the bounding box during the training process. We employed Kmeans++ to get anchor boxes with a higher average IOU. The comparison experiment was repeated 10 times to obtain the highest results. It is achieved avg-IOU by 82.33%, which is better than the highest one of the original method with avg-IOU 81.87%. The three scale anchor boxes in the experiment are set as {[71,73], [98,109], [118,179]}, {[136,116], [144,151], [173,227]} and {[175,172], [193,132], [249,246]}.
Deformable convolution
Compared with the conventional convolution, deformable convolution has an additional step of calculating the offset, which causes the back propagation speed to slow down. To balance the efficiency and effectiveness, we use 3
Performance comparison between conventional convolution and deformable convolution. ‘G.A. Box’ means ‘Generate Anchor Box’
Performance comparison between conventional convolution and deformable convolution. ‘G.A. Box’ means ‘Generate Anchor Box’
It is shown in Table 4 the improvement in detection performance after adding the SE block and SPP modules. The SE block is added after each shortcut layer of the residual block. SPP1 means to add SPP module only at the first detection port, while SPP3 means to add SPP module at all three detection ports. Attention mechanism and spatial pyramid pooling are two different ways to enhance feature extraction. After joining the SE block, the mAP of the network is increased by 0.75%, and the addition of three SPP modules simultaneously is improved by 1.13%.
Performance improvements brought by SE block and SPP modules
Performance improvements brought by SE block and SPP modules
In Table 5, it demonstrates the impact of using different network improvement strategies on network parameters and detection results. By combining these four strategies, we can improve the mAP value of the detection network. There will be no performance degradation due to module conflicts. The last row of Table 5 is the structure of YOLO-OC. Compared with YOLOv3, which increases the value of mAP by 3.59% under the condition of only increasing the parameter amount by 3.27M. Table 6 illustrates the performance of YOLO-OC and several common object detection networks (Faster R-CNN, SSD and RetinaNet) on our test set.
Impact of improvements on YOLO-OC
Impact of improvements on YOLO-OC
Performance comparison between YOLO-OC and other models
Experimental results show that compared with other networks, the proposed YOLO-OC network achieves the best detection effect on ovarian cancer. The detection results of YOLO-OC are shown in Fig. 10. YOLO-OC can accurately locate and classify different types of ovarian tumors, which indicates that the model proposed in this paper can assist radiologists in making accurate diagnosis.
Examples of YOLO-OC detection effects: (a) Endometrioid carcinoma; (b) mucinous cystadenoma carcinoma; (c) serous cystadenoma carcinoma; (d) clear cell carcinoma.
This study is dedicated to applying deep learning to the accurate detection of ovarian cancer. For this reason, we proposed YOLO-OC on the basis of YOLOv3 to enhance its ability to extract features of ovarian malignant tumors. The ablation experiment verified the effectiveness of the above modules, and comparison experiments with other object detection networks indicated that YOLO-OC had the best detection effect, whose mAP value reached 73.82%.
In future work, it is worthy to investigate the manner to reduce the amount of network parameters and improve the detection speed without losing the detection accuracy. As well, the detection of ovarian cancer will learn from some special methods [32, 33].
Footnotes
Acknowledgments
This work was supported by National Natural Science Foundation of China (Grant Nos. 61873280, 61672033, 61672248, 61972416, 61772376), Taishan Scholarship (tsqn201812029), Major projects of the National Natural Science Foundation of China (Grant No. 41890851), Natural Science Foundation of Shandong Province (No. ZR2019MF012), Fundamental Research Funds for the Central Universities (18CX02152A, 19CX05003A-6).