
Abstract
Addressing the problem of imbalanced data category distribution in real applications and the problem of traditional classifiers tending to ensure the accuracy of the majority class while ignoring the accuracy of the minority class when processing imbalanced data, this paper proposes a method called RBSP-Boosting for imbalanced data classification. First, RBSP-Boosting introduces the Shapley value and calculates the Shapley value for each sample of the dataset through the truncated Monte Carlo method. Moreover, the proposed method removes the noise data according to the Shapley value and undersamples the samples with Shapley values less than zero in the majority class. Then, it takes the Shapley value as the weight of the sample and oversamples the minority class according to the weight. Finally, the new dataset is trained on the classifier through the AdaBoost classifier. Experiments are conducted on nine groups of UCI and KEEL datasets, and RBSP-Boosting is compared with four sampling algorithms: Random-OverSampler, SMOTE, Borderline-SMOTE and SVM-SMOTE. Experimental results show that the RBSP-Boosting method in the three evaluation metrics of AUC, F-score and G-mean, compared with the best performance of the four comparison algorithms, increases by 4.69%, 10.3% and 7.86%, respectively. The proposed method can significantly improve the effect of imbalanced data classification.
Introduction
Classification is a fundamental and important problem in data analysis and processing. It has many applications, such as text classification [1], open set classification [2] and multilabel classification [3]. Imbalanced data classification is one of the hot issues. In an imbalanced dataset, the number of samples in one class is much lower than the number of samples in other classes. In recent years, the problem of imbalanced data classification has become increasingly prominent and has received extensive attention from many researchers [4], and it is common in disease prediction [5], anomaly detection [6] and medical diagnosis [7] fields. For example, disease is often a label for a minority class in malignancy diagnosis. To ensure the maximization of overall prediction accuracy, traditional classification algorithms may predict the presence of malignancy as healthy, delaying patient treatment. Therefore, improving the classification of imbalanced data has become a hot issue in the field of machine learning and medical diagnosis.
Researchers have proposed many methods to solve the problem of imbalanced data classification. Behzad et al. [8] proposed a hybrid method based on the concept of density and clustering that uses K-means to select minority samples for oversampling and deletes the majority samples with low density. Intouch et al. [9] proposed an oversampling technique based on probability distribution, which eliminates noise data through the Z score method and generates new samples according to the probability distribution of each minority sample.
However, the existing studies are all based on the data distribution to generate a balanced dataset but do not consider the real impact of each sample on the classifier. The contribution of each sample to the classifier is different. Both negative and positive effects are possible. Accurately measuring the contribution of each sample to the classifier and sampling based on it can improve the effect of imbalanced data classification. The Shapley value was originally used to solve the problem of the distribution of interests of all parties in the cooperative game. In the field of machine learning, it is used for machine learning interpretability.
In response to the above problems, the paper uses the Shapley value to measure the real contribution of each sample to the classifier and proposes an imbalanced data classification method RBSP-Boosting (resampling based on Shapley-Boosting). First, RBSP-Boosting improves the calculation method of the Shapley value to reduce the complexity. Second, it calculates the Shapley value of each sample to measure the real contribution. Then, the method oversamples the minority samples with large Shapley values and deletes the majority samples with small Shapley values to generate a balanced dataset. It has better performance on AUC, F-score and G-mean than existing classic methods.
The main contributions of this paper are as follows.
Aiming at the problem that the time complexity of the Shapley value calculation method is O (N!), we use the Monte Carlo method to transform it into an expectation problem, and the real-time complexity is reduced to O (TN). To consider the contribution of each data point to the classifier, we apply the Shapley value to the imbalanced data classification for the first time. The Shapley value is used to measure the contribution of each sample and generate a balanced dataset based on it. The performance of the proposed method on AUC, F-score and G-mean is improved.
The rest of the paper is organized as follows: Section 2 introduces the related work of imbalanced data classification, data estimation and Shapley value. Section 3 introduces the RBSP-Boosting method in detail. Section 4 verifies the effect of RBSP-Boosting on real datasets and compares it with the other four methods. Section 5 concludes the paper.
Imbalanced data classification
Currently, the research on the classification of imbalanced data focuses on three areas: data, features and algorithms. Figure 1 shows the generic framework of the imbalanced data classification problem and the problem to be solved in this paper. In the three stages of resampling, feature selection and classifier training, domain experts need to select appropriate algorithms according to domain knowledge and data characteristics.
General framework for imbalanced data classification.
(1) Data level work
The resampling technique is mainly used to generate balanced datasets and transform the imbalanced data classification problem into a balanced data classification problem. Kubat et al. [10] proposed the one-sided selection (OSS) undersampling method based on K-nearest neighbors, which combines the Tomek links and compressed nearest neighbor methods, uses Tomek links to remove noisy samples and majority boundary samples, and uses the compressed nearest neighbor method to remove samples away from the boundary in the majority class, making the sampled samples more valuable for learning. Uzmán-Ponce et al. [11] proposed the DBIG-US algorithm, which combines a two-stage approach to filter noisy data with the DBSCAN clustering algorithm and a graph-based process to solve class imbalance. In addition, researchers have also proposed oversampling methods. The SMOTE [12] method is the most classic oversampling method, which generates new samples by linear interpolation between each minority sample and its K-nearest neighbors, giving the minority class a larger generalization space. Mathew et al. [13] improved on the shortcomings of the SMOTE algorithm and proposed a weighted kernel-based oversampling method WK-SMOTE, which oversamples the minority samples directly in the feature space of the SVM classifier and overcomes the limitation of nonlinear problems.
(2) Feature level work
Feature selection methods are mainly used to select a subset of features from the full feature space. For example, Shahee et al. [14] proposed a distance-based feature selection method ED-Relief, which employs a new distance metric that uses the geometric mean of JF scatter as well as separation between classes to deal with the imbalanced problem between within and between classes, changing the limitations of traditional methods based on interclass imbalance feature selection only. Yang et al. [15] used sampling methods to filter out multiple balanced datasets from imbalanced datasets and then used the ensemble of classifiers trained on the balanced datasets to filter feature subsets.
(3) Algorithmic level work
Commonly used methods are cost-sensitive learning [16] and ensemble learning. For example, Lucas et al. [17] proposed a cost-sensitive adaptive random forest algorithm (CSARF) to alleviate the problem of imbalanced data in a streaming processing environment. Freund et al. [18] proposed one of the most representative boosting integration methods, AdaBoost, which adaptively modifies the sample weights to reduce classification errors. The algorithm uses the entire dataset to train the classifier serially several times, and after each round of training, the sample weights are updated such that the weights of incorrectly classified samples are increased and the weights of correctly classified samples are decreased. Currently, researchers have combined ensemble learning methods with other imbalanced data classification methods to form a series of boosting algorithms based on resampling techniques to improve the classification of imbalanced data, such as CUSBoost [19].
The above work has limitations, such as relying too much on the spatial distance distribution, deleting valid samples to a certain extent, and easily generating noise samples. In response to these shortcomings, this paper introduces the Shapley value and makes improvements. First, the Shapley value is used to represent the weight of the sample during resampling. Second, the Shapley value of each sample is iteratively calculated by the Monte Carlo method, which reduces the time complexity. Moreover, the paper resamples the minority samples and the majority samples by oversampling and undersampling, respectively, and deletes noise data according to the Shapley value of each sample. It not only effectively retains the samples that have a positive impact on the prediction results but also generates effective new samples.
Lloyd Shapley [20] introduced the concept of Shapley value, which is mainly used to solve the problem of benefit distribution among parties in a cooperative game. Shapley value reflects the degree of contribution of each party to the overall goal of cooperation, avoiding egalitarianism in the distribution, more reasonable and fair. It also reflects the process of mutual game of cooperation.
With the development of machine learning technology, the problem of machine learning model interpretability has attracted the attention of scholars. The Shapley value method, as a means of data valuation, is widely used in machine learning model interpretability problems. Researchers use the Shapley value method to calculate the impact of each feature on the model effect as a way to explain the model results. For example, Wang et al. [21] proposed a Shapley flow method to interpret machine learning models based on Shapley values, which considers causal graphs to help understand the flow of importance and the factors that potentially intervene.
In recent years, several studies have used Shapley values to assess the contribution of different data points in a dataset when training a machine learning model. For example, Ghorbani et al. [22] proposed two heuristics to efficiently compute the Shapley values for each sample and demonstrated for the first time that Shapley values can be used to assess the impact of each sample on the effect of a machine learning model. Jia et al. [23] proposed an efficient method to compute Shapley values for samples on a K-nearest neighbor-based machine learning approach. Song et al. [24] defined the contribution index CI of different data providers based on the concept of the Shapley value for the application scenario of federal learning and proposed two effective methods for calculating CI.
It is very important to reasonably evaluate the impact of data. The Shapley value can measure the impact of each data point on the model effect. Therefore, this paper uses the Shapley value to calculate the contribution of each data and proposes an improvement approach for the high complexity of the Shapley value calculation method. At the same time, different sampling strategies are adopted for the dataset according to the Shapley value of each sample, which are undersampling the sample with a low Shapley value in the majority samples and oversampling the sample with a high Shapley value in the minority samples. While effectively deleting noisy data, it not only retains samples that are beneficial to the classifier but also reasonably generates minority samples, which improves the effect of the classifier.
RBSP-Boosting method
Resampling technology is an effective method to deal with imbalanced data, including undersampling and oversampling. However, it is easy to generate noise data or lose some useful data. To compensate for these two shortcomings, this paper proposes the RBSP-Boosting method. By introducing the Shapley value to measure the impact of each sample on the model, it aims to screen out the samples that have a positive and negative impact on the model effect and improve the sampling strategy based on the Shapley value. At the same time, in view of the high complexity of the Shapley value calculation method, this paper proposes an improvement approach. Then, the classification results are obtained and evaluated on the AdaBoost classifier. The flow chart of the RBSP-Boosting method is shown in Fig. 2. Domain experts need to process the initial dataset based on domain knowledge, such as missing values. In addition, they can also determine a more appropriate threshold based on the Shapley value of the data.
Flow chart of RBSP-Boosting.
Calculating the Shapley value
The initial definition formula of Shapley value is:
where
where
According to Eq. (1), calculating the Shapley value requires traversing all subsets containing sample i in the dataset. For a dataset with
where
The Shapley value of the sample is estimated by the Monte Carlo method. First, the proposed method randomly samples the dataset. Second, it scans each data point in the random sample array from the beginning and calculates the marginal contribution of each newly added sample. Then, the method updates the Shapley value of the sample. Repeating the above steps on multiple Monte Carlo permutations until they tend to converge, we can obtain an unbiased Shapley estimate for each data point as follows:
where
The calculation of the Shapley value can be formalized as an expectation problem, as described in Algorithm 1 for details.
For samples with different Shapley values, this paper adopts different resampling strategies to make better use of the samples with strong discriminative properties and eliminate noise data.
The method takes into account the contribution of each sample to the model. It can not only delete the noise samples in the dataset but also select the highly discriminative samples for oversampling, which effectively compensates for the shortcomings of traditional imbalanced data processing methods. More importantly, it solves the shortcomings of oversampling and undersampling at the same time Fig. 3 shows the principle of sampling in this method.
Algorithm description
The main steps of RBSP-Boosting are as follows.
(1) For a given dataset, Algorithm 1 describes how to calculate the Shapley value for each sample.
The sampling principle of this method.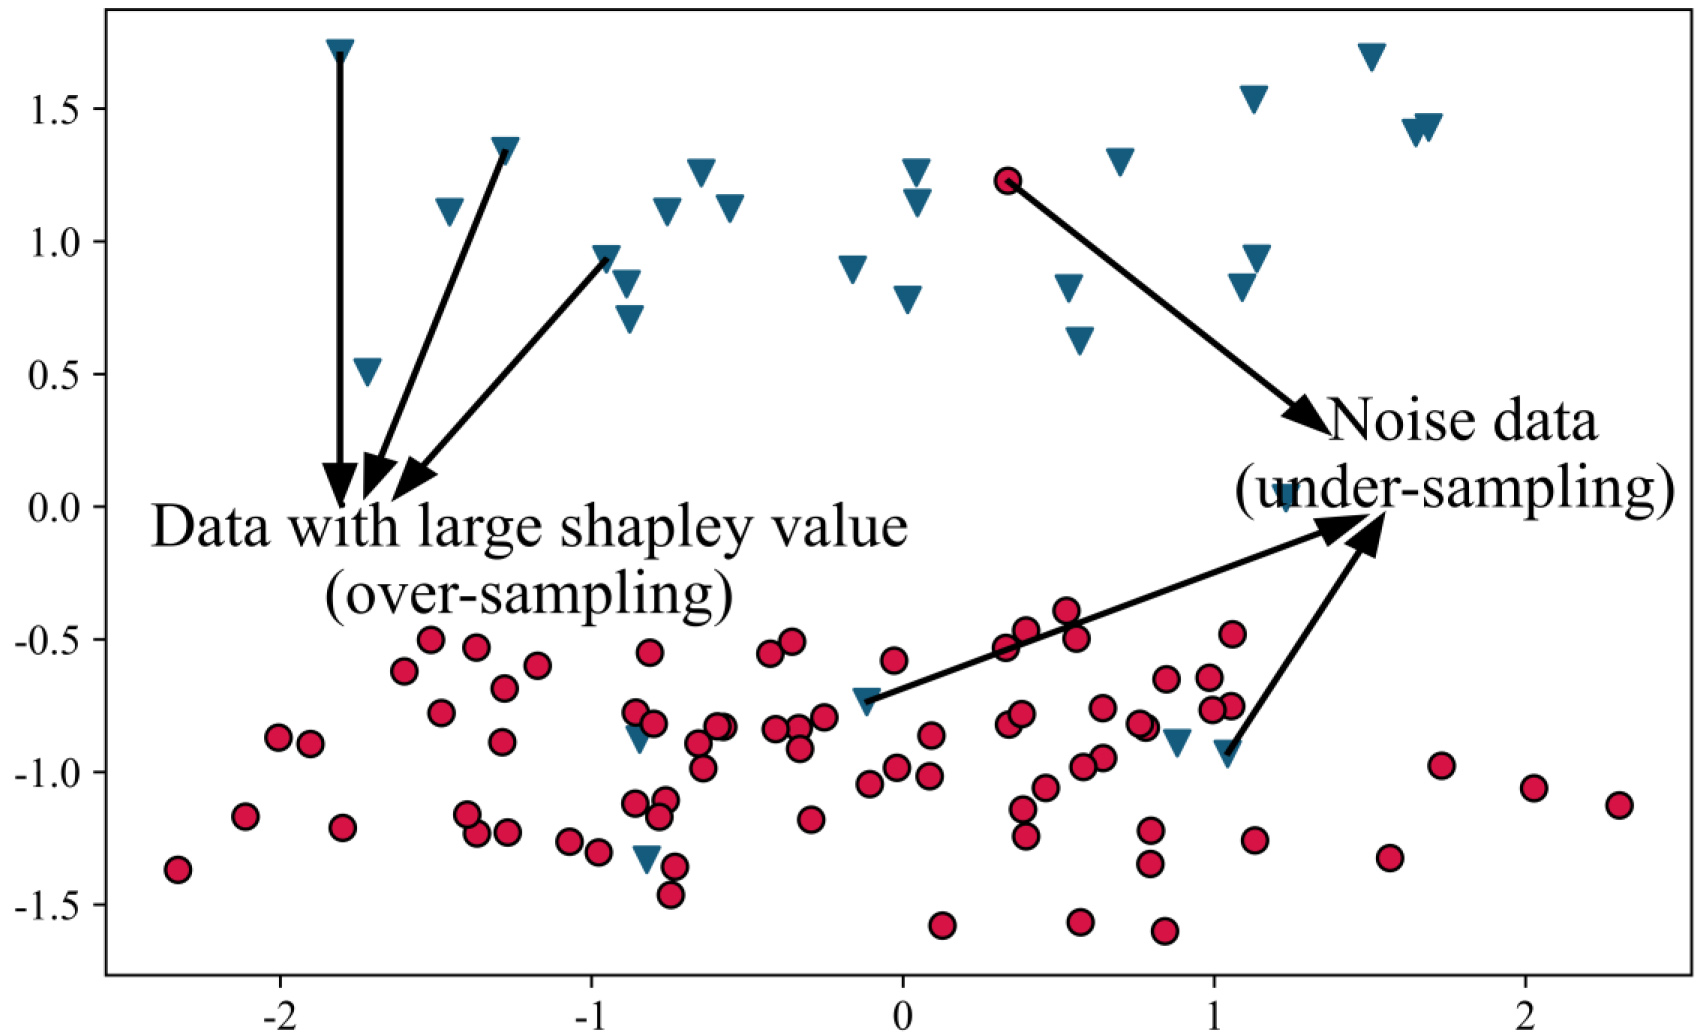
Algorithm 1 improves the method of calculating the Shapley value and reduces the time complexity of the algorithm from
(2) According to the Shapley value of each sample obtained by Algorithm 1, the samples of different Shapley values are oversampled and undersampled. Samples with a small Shapley value or even less than zero in the dataset have a negative impact on the effect of the model, which is noise data. Therefore, Algorithm 2 reduces the number of noise samples by deleting samples with a small Shapley value in the dataset. Second, the samples in the minority class are sorted in descending order of the Shapley value. Shapley value is used as the sampling weight. Then, the number of new samples generated for each data point is determined according to the sampling weight. The smoot algorithm is used for oversampling.
Algorithm 2 describes how to obtain the balanced dataset after processing.
Algorithm 2 introduces the Shapley value to resample the imbalanced dataset, which takes into account the contribution of each sample to the classifier To a certain extent, it solves the problem of loss of some useful data and generating noise data during the sampling process.
(3) Through Algorithm 2, a balanced dataset is obtained. Then, the proposed method imports the AdaBoost classifier in Python for training and prediction and calculates the AUC value, F-score value and G-mean value of the model.
The RBSP-Boosting method improves the complexity of the Shapley value calculation method and uses the Shapley value to measure the contribution of each data point to the classifier. According to the Shapley value of each data point, it adopts different sampling strategies for the majority class and the minority class. While effectively deleting noisy data, it not only retains samples that are beneficial to the model but also reasonably generates minority class samples, which can theoretically improve the effect of imbalanced data classification. Next, the effectiveness and stability of the method are verified through experiments.
Experimental setup
Datasets description
To verify the effectiveness of the proposed method, this paper selects 9 imbalanced datasets from the UCI and KEEL machine learning databases for experiments and analysis. These datasets are all imbalanced datasets. The imbalanced degree of the datasets ranges from 1.87 to 853, with a large span. They are widely used in experiments in related literature [5, 6, 8, 10]. Most of them are medical data, which conform to the medical application scenarios of this paper. Therefore, they verified the effect of the RBSP-Boosting method on datasets with different imbalance degrees Detailed information on the datasets is shown in Table 1. IR is the ratio between the number of samples from the majority and minority classes.
Datasets information
Datasets information
There are two explanations for the dataset. First, the proposed algorithm resamples according to the Shapley value of the sample, and the samples with low Shapley values will be deleted as noise data. Therefore, the noise data do not affect the effect of the algorithm. Second, the algorithm cannot process data with missing values. Domain experts are required to preprocess the dataset
To verify the performance of the RBSP-Boosting method, the paper has been compared with sampling algorithms, including Random-OverSampler, SMOTE, Borderline-SMOTE and SVM-SMOTE. These algorithms are the most advanced and classic imbalance problem learning techniques and are widely used in common imbalanced data processing problems, including medical diagnosis. The same AdaBoost classifier is used to verify the effect of these algorithms. The base classifier of AdaBoost is a support vector machine. Ten independent tenfold cross-validation algorithms are adopted. The main reasons why we use it are as follows. First, the purpose of it is to increase the number of experiments and improve the reliability of the results. Second, it can reduce the influence of accidental factors on the overall experimental results and ensure the accuracy of the experimental results. Third, it is adopted for the five methods, which will not destroy the basic conditions of the control experiment.
The code in this paper is written in Python language. Sampling algorithms including Random-OverSampler, SMOTE, Borderline-SMOTE and SVM-SMOTE use functions in the Python third-party library called imbalanced-learn. The classifier is implemented using the AdaBoost classifier in the Python third-party library called scikit-learn. The experiments are based on the win10 operating system, python3.6 and TensorFlow2.4 learning environment.
Evaluation metric
In the problem of imbalanced data classification, if the model classifies all samples into the majority class, it can obtain a higher accuracy rate. However, the minority class is misclassified, and the effect of the model is not good. Therefore, the accuracy and error rates are not enough to accurately measure the effect of the model. To measure the effect of the model more comprehensively, this paper uses AUC (area under the curve of ROC), F-score and G-mean, commonly used in imbalanced data classification, as the assessment metrics of the model effect. Among them, AUC is the area under the ROC curve, which is widely applied to estimate the accuracy of imbalanced models with all possible scopes of thresholds. The values of the F-score and G-mean are obtained from the confusion matrix. The larger the value, the better the effect of the model. The confusion matrix is shown in Table 2.
Confusion matrix
Confusion matrix
The larger the value of the F-score is, the better the effect of the model. It is defined as follows:
Recall is the recall rate, which is defined as follows:
The precision is the precision rate, which is defined as follows:
When the prediction accuracy of the minority class and the majority class are both high, the value of G-mean is high. It is defined as follows:
AUC, F-score and G-mean consider the classifier’s ability to classify positive and negative samples at the same time. Compared with indicators such as accuracy, they can better reflect the effect of imbalanced data classifiers and are widely used to evaluate the effects of different algorithms on imbalanced data classification.
To eliminate the randomness of the experimental results, this paper uses the tenfold cross-validation method to divide the dataset and conducts ten times tenfold cross-validation. Then, it performs sampling algorithm processing on the divided dataset and finally takes the average value as the result of the experiment. Each time the dataset is divided into a training set and a test set, 90% is used as the training set and 10% is used as the test set.
Tables 3 to 5 show the comparison results of AUC, F-score and G-mean classified by different sampling methods, and the best result is shown in bold black. In the last row of each table, the average scores of the five sampling methods on all datasets are given, and the best scores are indicated in bold black.
AUC value
AUC value
F-score value
G-mean value
Average rank of five methods on nine datasets.
Roc curve of five methods on nine datasets.
Average results of five methods on nine datasets.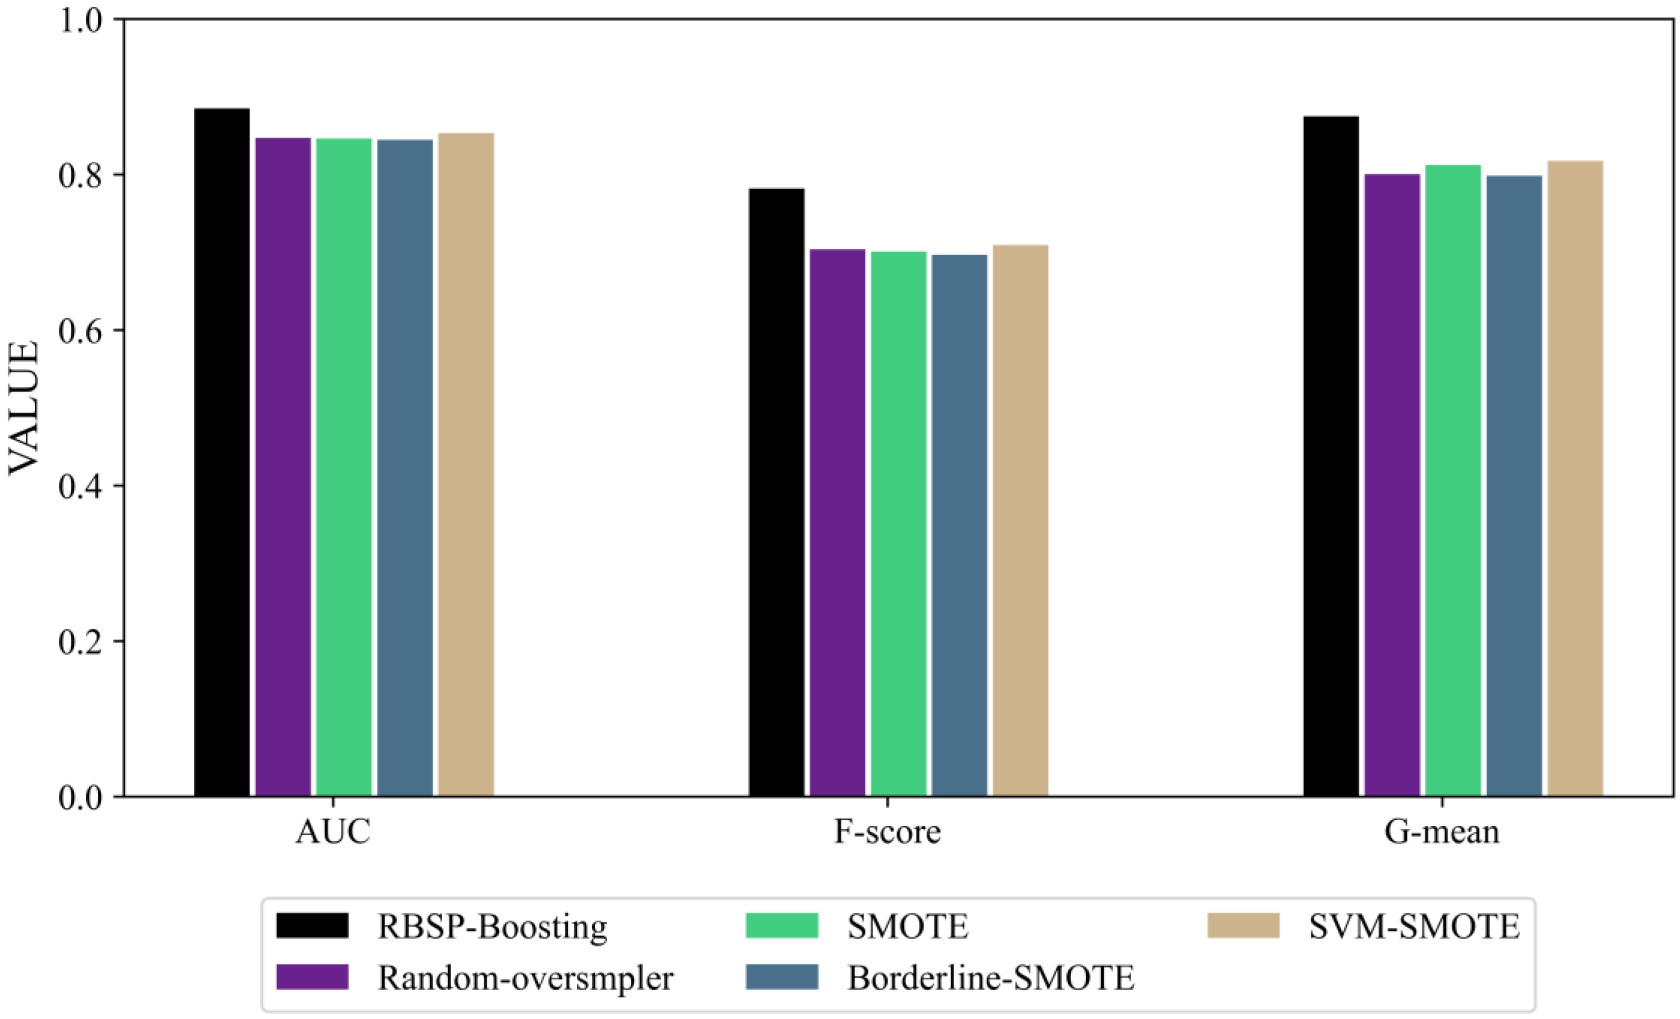
Auc under different iteration times on the nine datasets.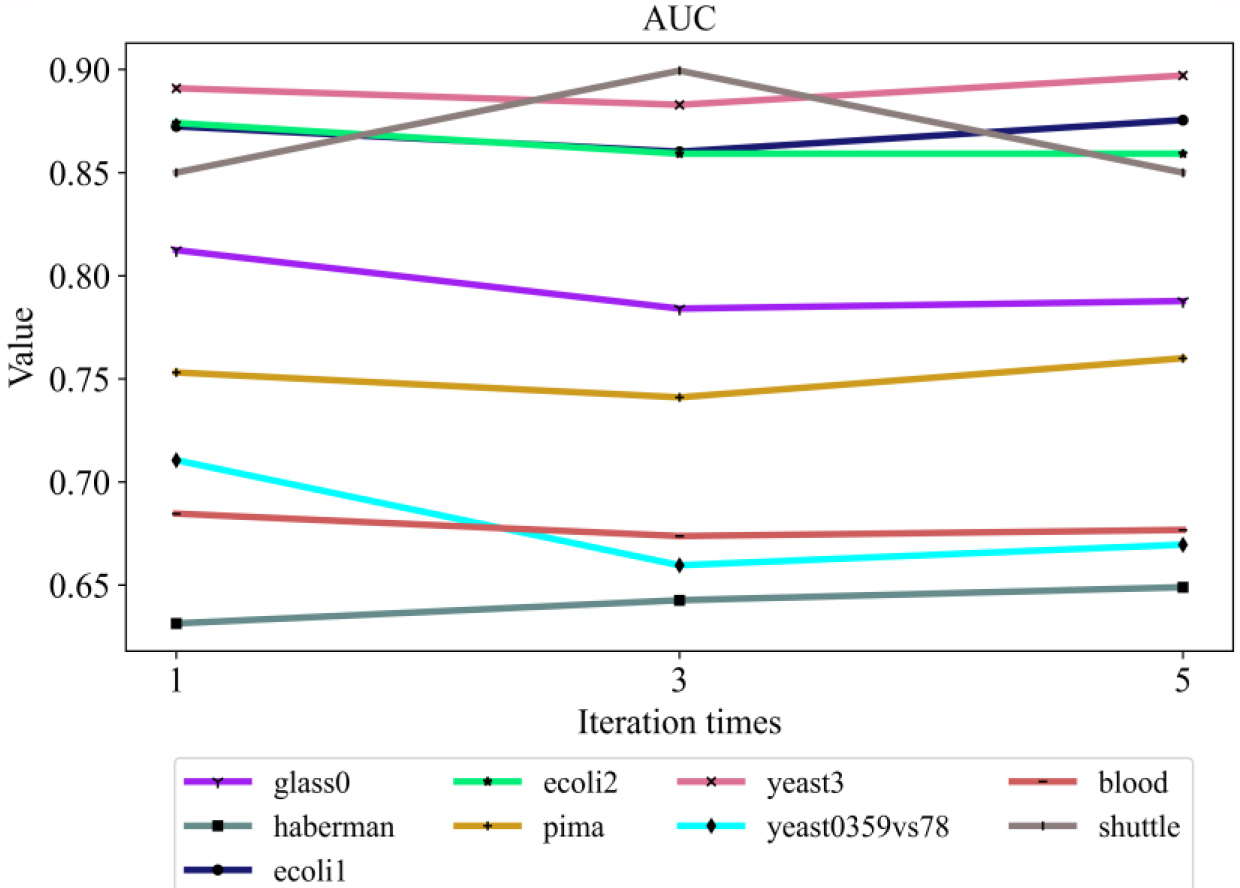
F-score under different iteration times on the nine datasets.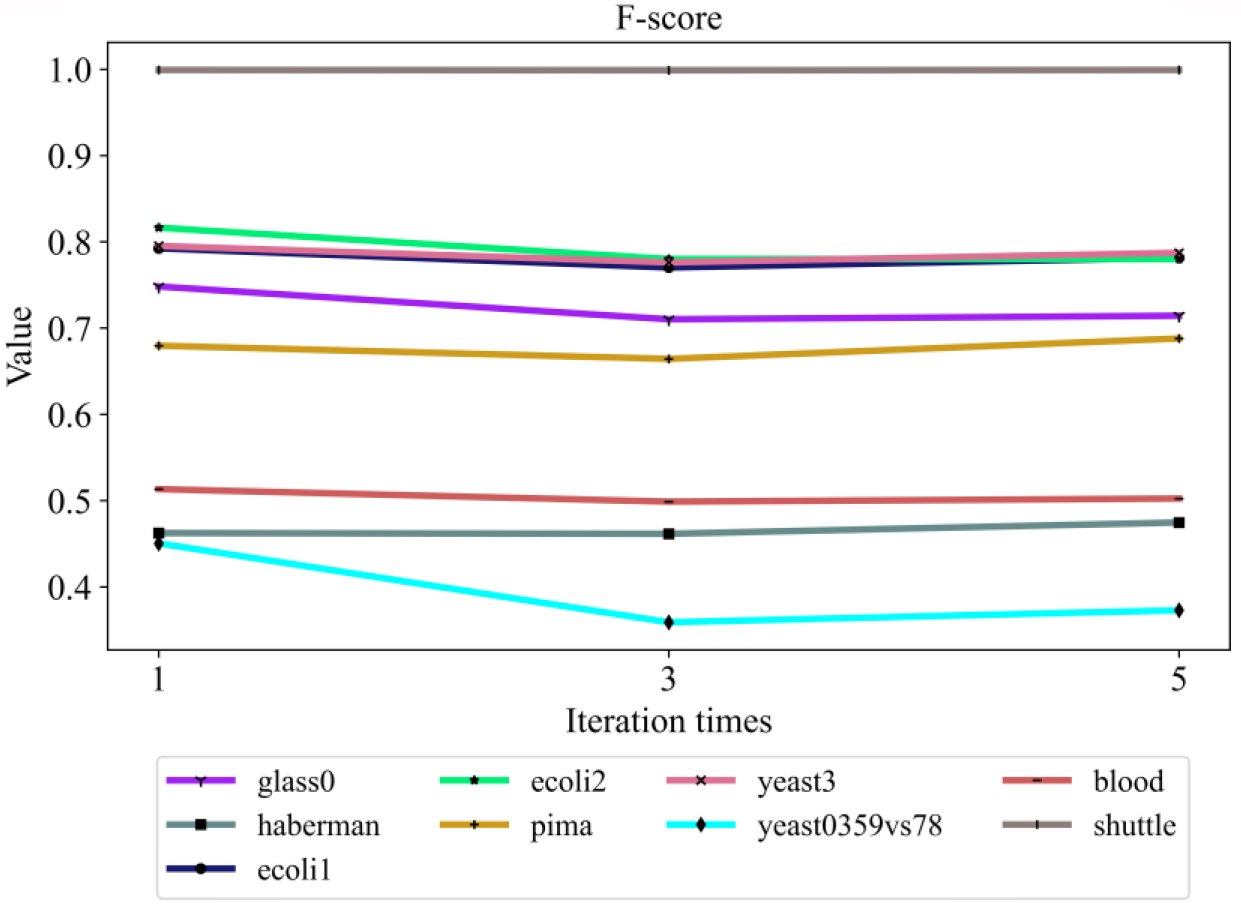
G-mean under different iteration times on the nine datasets.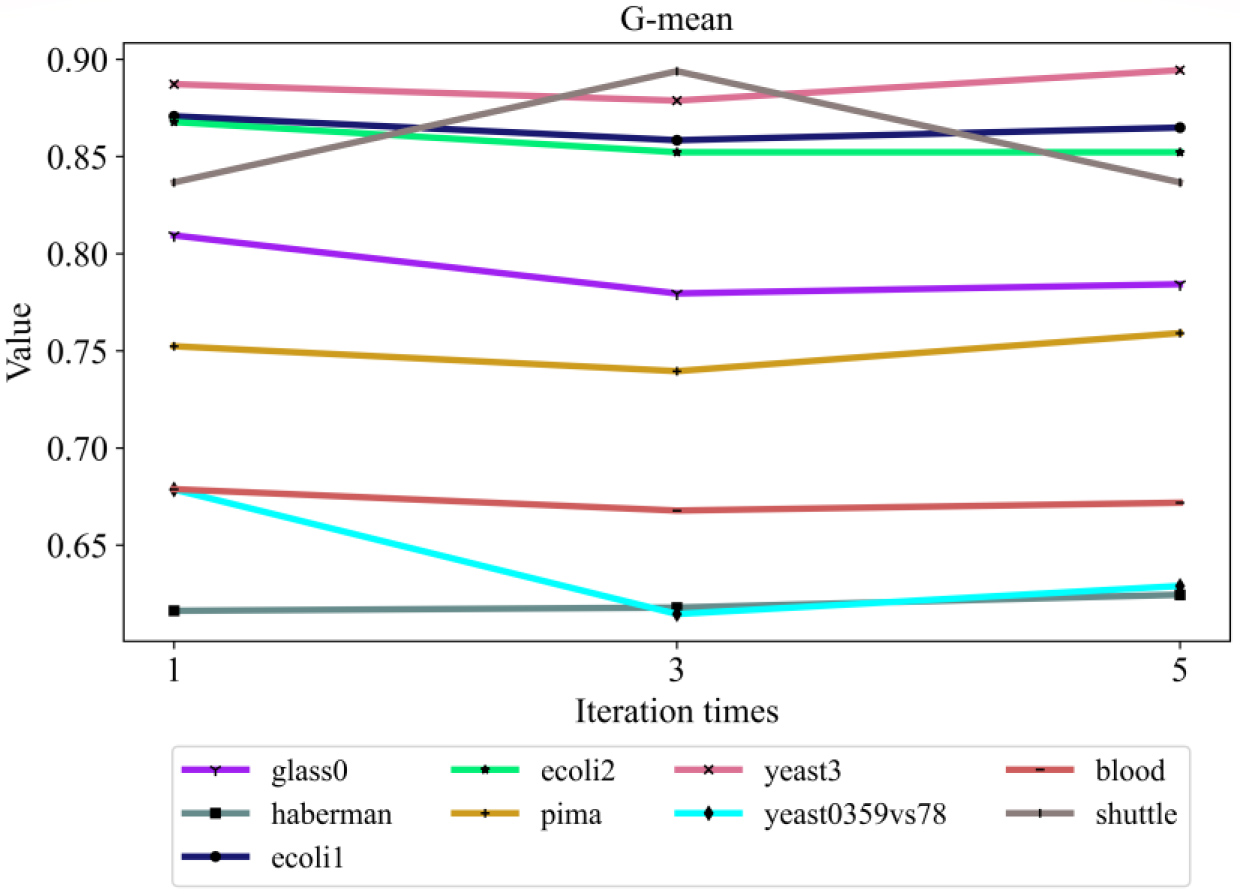
It can be seen from Table 3 that when the RBSP-Boosting method is used to classify these datasets, the AUC value achieves the optimal value on the five datasets. Compared with the SVM-SMOTE algorithm with the best average effect among the four comparison algorithms, the average AUC value on these datasets increased from 0.751376 to 0.786591, increasing by 4.69%.
Table 4 shows that the proposed method achieves the best F-score value on all datasets. Compared with the SVM-SMOTE algorithm with the best average effect among the four comparison algorithms, the average value of the F-score on all datasets increased from 0.630326 to 0.695228, increasing by 10.30%.
It can be seen from Table 5 that when the proposed method is used to classify these datasets, G-mean achieves the optimal value on five datasets. Compared with the best SVM-SMOTE algorithm among the four comparison methods, the average value of G-mean on all datasets increased from 0.726773 to 0.783863, increasing by 7.86%.
The paper draws the average ranking of five methods on the assessment metric scores on nine datasets. Figure 4 shows that the average ranking of the proposed method in AUC, F-score and G-mean is the best.
In addition, the paper draws the ROC curves of five methods on the nine datasets, which more intuitively demonstrates the effectiveness of the proposed method. Figure 5 shows the ROC curves of the five methods on nine datasets, which shows the effectiveness of the proposed method.
It can be seen that in most ROC graphs, when the false-positive rate is small, the RBSP-Boosting method has a larger true positive rate value than other methods, indicating that this method has achieved better classification results.
To further demonstrate the effectiveness of the method, we show the average results of all datasets in Fig. 6. The performance of the RBSP boosting method in terms of the AUC, F-score and G-mean is better than that of the other four methods.
Figure 6 shows that the RBSP-Boosting method achieves the best average values of AUC, F-score and G-mean on the nine datasets, and the classification effect is better than that of the other four methods.
To verify the stability of the method proposed in this paper, the paper conducts experiments under different iteration times. The experimental settings were the same as those in the above experiments. Finally, the AUC, F-score and G-mean under different iteration times are obtained, and the experimental results are shown in Figs 7–9.
It can be seen from Figs 7 to 9 that the proposed method can be stably executed under different iteration times except for the yeast0359 vs. 78 dataset, which fully illustrates the stability and effectiveness of the method.
The greater the contribution value of a sample point to the model effect, the deeper its impact on the model performance. The Shapley value can accurately measure the contribution of each data point to the model effect. According to the Shapley value of the data, we make full use of the samples with a larger Shapley value for oversampling and delete the samples with a smaller Shapley value. While constructing a balanced dataset, it fully retains the effective samples, which is also the key to improving the effect of the model. Therefore, the proposed method outperforms the comparison method in multiple datasets.
Table 6 compares the RBSP-Boosting method against several classic and representative processing methods for solving the problem of imbalanced data classification.
Comparison of handling methods for imbalanced data classification
Running time comparison table
Summarizing Tables 3 to 6 and Figs 4 to 9, we can see that the RBSP-Boosting method can achieve the best results on most datasets. On the three evaluation indicators of AUC, F-score and G-mean, the overall effect is optimal, and stability can be guaranteed in multiple sets of different iteration times. Therefore, the proposed method is effective and can be used to solve the practical problem of imbalanced data classification.
In addition, we compare the running time of the methods for the researcher’s reference.
This paper proposes an imbalanced data processing method based on the Shapley value for the problems that the oversampling algorithm easily generates redundant data and noisy data, and the undersampling algorithm easily removes the defects of discriminative valuable data. First, the RBSP-Boosting method calculates the Shapley value of each data point in the dataset. Second, it uses different processing methods for samples with different Shapley values based on the Shapley value of the samples to construct a balanced dataset. Finally, the method uses the AdaBoost classifier for classification. On the one hand, it effectively reduces the redundant data generated in the oversampling process. On the other hand, it effectively uses the data with a certain degree of discrimination. The experimental results on nine sets of KEEL and UCI datasets show that the RBSP-Boosting method has improved AUC, F-score and G-mean compared with the four methods mentioned in this paper. In future work, a problem worthy of research is the multiclassification of imbalanced data, and another problem worthy of research is the multilabel classification of imbalanced data. We will improve the measurement indicators in the calculation of the Shapley value, and we will further study how to reasonably divide the dataset into different categories and adopt different sampling methods.
Footnotes
Acknowledgments
This work is supported in part by the Natural Science Foundation of China under Grant 61762008 and 62162003, the National Key Research and Development Project of China under Grant 2018YFB1404404.