Abstract
Active learning focuses on selecting a small subset of the most valuable instances for labeling to learn a highly accurate model. Considering informativeness and representativeness of unlabeled instances is significant for a query, some works have been done about combing informativeness and representativeness criteria. However, most of them are generally in a fixed manner to balance these criteria, and difficult to find suitable sampling strategies and weights of informativeness and representativeness for various datasets. In this paper, an adaptive active learning method ALIR is proposed to address these limitations. Firstly, an adaptive active learning framework is represented, in which the weight of informativeness and representativeness criteria can be dynamically updated by the feedback of previous learning processes. Secondly, by formulating the active learning as a Markov decision process, ALIR can adaptively select the suitable sampling strategies according to the reward of the learning process. Finally, extensive experimental results over several benchmark datasets and two real classification datasets demonstrate that ALIR outperforms several state-of-the-art methods. Different from traditional active learning algorithms, ALIR can adaptively select sampling strategies and adjust the weights simultaneously, which helps it more feasible in the application.
Introduction
Many classification problems require abundant training instances to achieve superior performance [1]. Given the large quantities of unlabeled instances and scarce labeled instances of the real world, many conventional algorithms to request the label for an instance seems insufficient as the professional domain knowledge and large cost-consuming need to be required [2, 32]. Thus, it is attached great importance to training a precise model with a small number of labeled instances. Active learning is a technique to address this challenge by iteratively selecting the most valuable instance for labeling to maximize the accuracy of the classifier [3, 33].
The most popular method is pool-based active learning, which assumes that the entire instances are in a pool where the most utility unlabeled instances are selected to query their label by appropriate query strategy. Two types of query criteria, i.e., informativeness and representativeness, are widely applied by active learning methods [4]. The informativeness criterion measures the model uncertainty of classifying unlabeled examples, whereas representativeness measures the ability of an instance represents the entire data space. Usually, a single criterion is deployed for many active learning methods, which often leads to a limitation of performance. Methods selecting the informative instance often are not immune to the sampling bias significantly since it has high uncertainty and neglects the further exploration of datasets [5]. In contrast, approaches favoring the representative instance attempt to take into account the overall data space, but it may reach suboptimal performance as the informativeness of a single instance is ignored and the density of the input data is estimated only with the current cluster result [6, 7].
Framework diagram of the previous algorithm. The two criteria are combined by a certain weight as a measurement of the instance selection, where the query strategies or their weights based on two criteria are frequently fixed.
Hence some methods [8, 9, 10, 31] were developed to combine the two criteria for picking the instance that is both informative and representative. However, the performance of the proposed combinations is not optimal as two criteria seldom reinforce each other, and instead tend to a disagreement on instance selection [11]. As shown in Fig. 1, some methods are usually done in a fixed manner for a combination of two criteria, rather than by dynamically selecting or reweighting [12]. Additionally, other approaches commonly apply fixed two query strategies to all datasets, which can not work well across all datasets with different properties such as a varying number of classes, different training set size, and data clustering structure [1, 13, 30]. All in all, there is no one algorithm to adaptively select the most profitable query strategies for a given dataset and adjust the weight between the selected strategies dynamically.
In this paper, an adaptive Active Learning algorithm with Informativeness and Representativeness (ALIR) is proposed, which can significantly improve the accuracy of the classifier by robustly incorporating informativeness and representativeness criteria. The first focus of our method is to provide a novel Active Learning Framework (ALF), where the weight of query strategies combination can be dynamically adjusted by the feedback of previously selected instances. Further, our algorithm can learn from experience over multiple active learning rounds to select effective query strategies, and formalize it as a Markov decision process, which can be used to guide the next query according to the past sequence of decisions. Hence, our work seems to be more efficient in instance selection, as the appropriate query strategies and their weights can be dynamically adapted according to specific data distribution and data informativeness. ALIR achieves obvious improvements by identifying informative and representative queries compared to some state-of-the-art methods, which is verified by our empirical study on some UCI and KEEL benchmark datasets and the datasets of practical application.
The remainder of this paper is organized as follows. Section 2 briefly reviews and summarizes some related work. Some efficient sampling strategies of the two criteria are presented in Section 3. Section 4 presents the proposed algorithm in detail. The results of our empirical studies are described and observation and analysis can be obtained in Section 5. Section 6 concludes the proposed approach and provides the suggestion for potential future works.
Approach drawing on informativeness criteria is the most common approach for active learning. Typical approaches include 1) query-by-committee [15], which chooses the instances that have the highest disagreement based on the labels predicted by several distinct classifiers; 2) margin sampling [16, 17], in which the active learner is more inclined to pick the instances that closest to the classification boundaries; 3) entropy sampling [18, 19, 20], where the classifier is uncertain for instances with high information entropy, hence selecting these instances has a high information content for the task of improving the classifier. The main drawback of these methods can not further explore the data distribution, as they only focus on the instances whose label predicted by the classifier is the most ambiguous, making it prone to sampling bias [21, 22].
In contrast, several methods have been proposed to find the most representative instance. Some algorithms [23, 24, 25] take advantage of the cluster structure of the unlabeled instance to select instances that are located in the high-density area for labeling. Despite the success of these methods, which probably leads to a bad performance by only considering the uniform sampling of data space. Further, optimal experimental design methods [26] are developed to find the representativeness instances that can reconstruct the entire data space, whereas the classification uncertainty of the unlabeled instance is almost ignored.
Several active learning algorithms tried to combine the criteria of informativeness and representativeness to address the deficiency of a single criterion. Du et al. [27] combined informativeness and representativeness simultaneously according to the loss risk minimization principle, but their weights need to be adjusted manually. Ebert et al. [1] proposed a feedback-driven framework where the query strategies are picked by the entropy gain before and after instance selection, but their weights are not dynamically adjusted according to the specific situation. More recently the trade-off of the two criteria can be dynamically updated by estimating the gain for the next iteration or by using a feedback-driven method. [5] adopted a fixed boundary to switch the uncertainty sampling and density-weighted uncertainty sampling. Cebron and Berthold [7] developed a weighted formula between density measure and uncertainty measure. In [14], the weights of the two criteria were tuned-up using a multi-armed bandit (MAB) formulation. [13] balanced the trade-off of informativeness and representativeness criteria in a time-varying manner. Despite the strong progress of more accurate models, these algorithms may be ineffective in instance selection, for they only involve two sampling strategies rather than dynamically selecting sampling strategies for a given dataset. Further, previous algorithms are limited in the selection of effective sampling strategies and weights between them simultaneously, which may achieve or face sampling bias, cluster dependency, and classification deviations.
In this work, a new framework is designed to update the weights of two criteria according to the feedback from the previously selected instance for the model, without any need to inform the method about the specifics of the dataset or the available criteria. Meanwhile, the active learning process is formalized as a reinforcement learning problem to select two desirable query strategies based on the reward during the learning process, which helps to an adaptive selection of the most valuable instances for a given dataset. Hence, the proposed algorithm tends to be an adaptive process, which can learn a robust classifier and achieve the same or better performance compared to previous works [1, 2, 28, 29].
An illustrate examples for selecting informative and representative instances.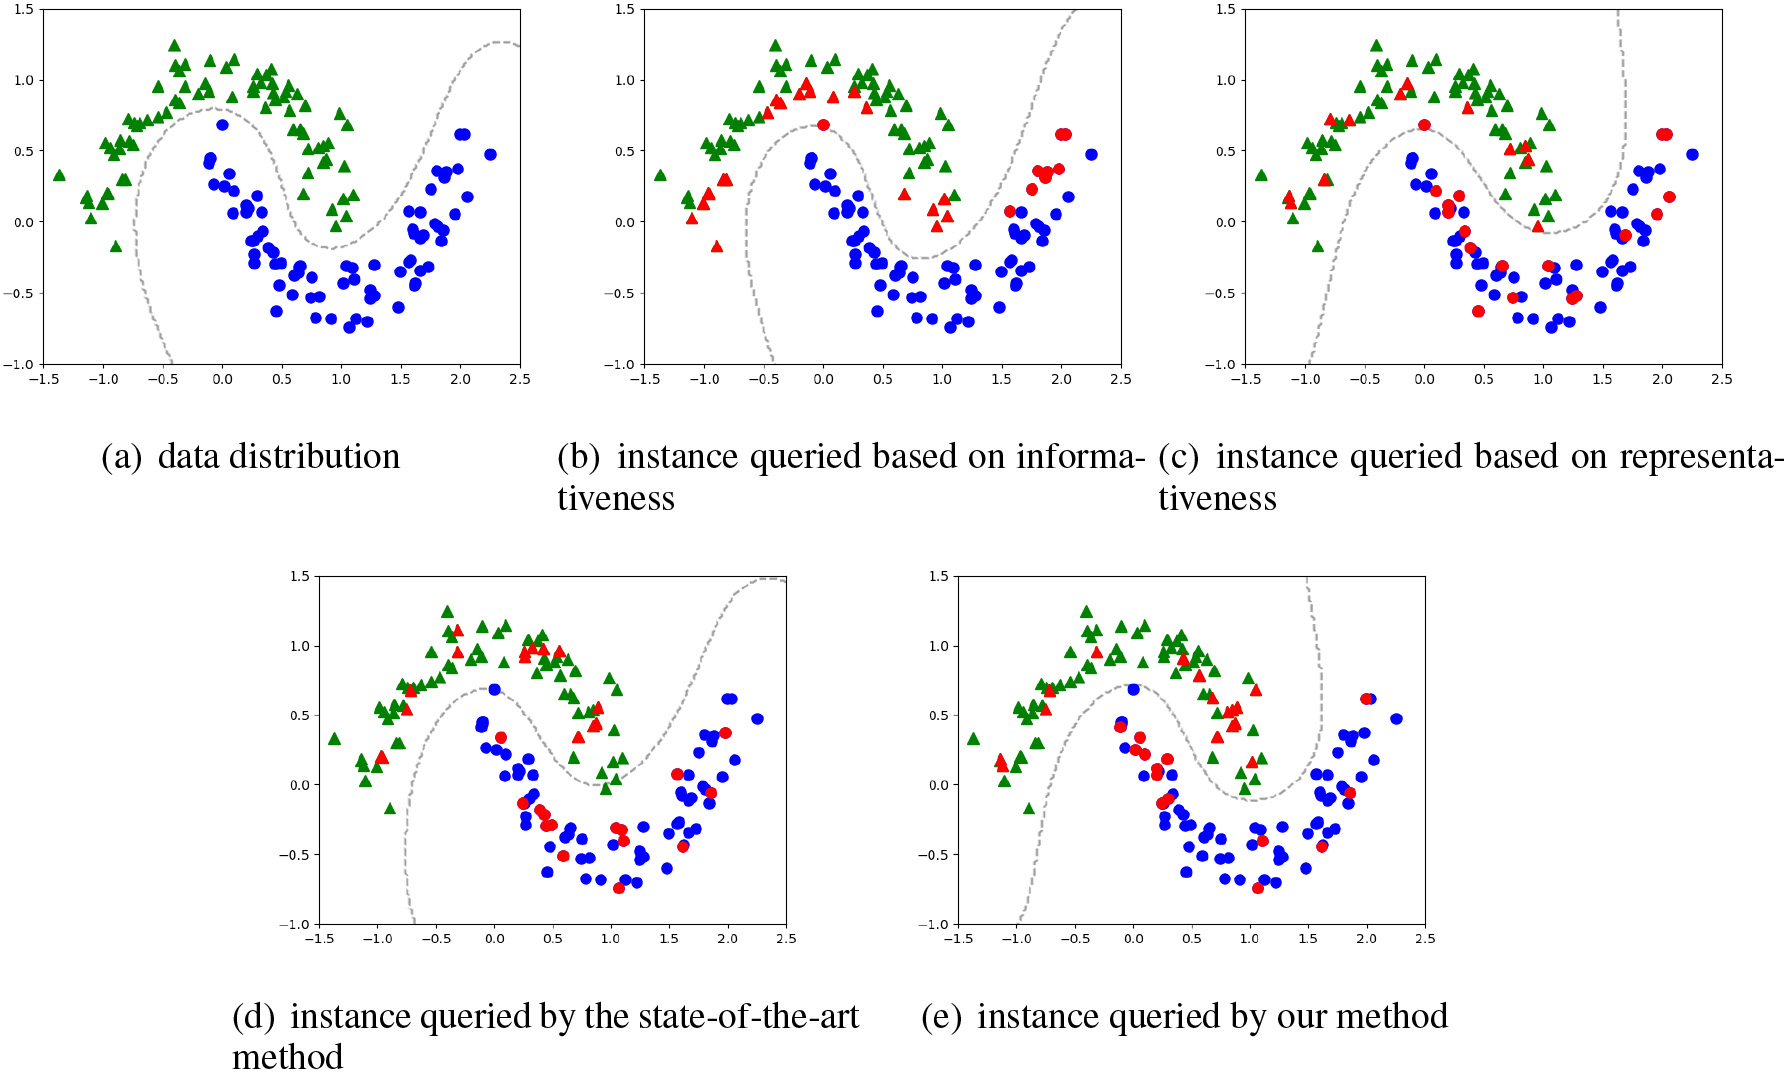
To illustrate the informative and representative instance is important for a query, we first perform empirical research on a synthetic dataset. Figure 2a illustrates a synthetic dataset for binary classification, where the triangles and circles represent different classes. We verify four active learning algorithms by sequentially selecting 30 instances for labeling, where the red triangles and red circles are selected instances by each algorithm, and the line of dashes denotes the classification boundary. Figure 2b demonstrates that the right cluster of triangle class and the left cluster of circle class are unexplored by an active learning method [16] based on informativeness criterion, for the data distribution keeps frequently being ignored. As indicated by Fig. 2c, The method [7] adopting representativeness criteria neglects some informative instances in the right cluster of triangle class, as it only considers the data distribution to ensure the diversity of the selected instances. Further, Fig. 2d shows that an active learning method [1] combining the two criteria is usually difficult to find a balance between the two criteria, which makes it difficult to classify some instances located at the classification boundary, resulting in classification deviation. As shown in Fig. 2e, our proposed algorithm is more efficient in finding the decision boundary than the other three approaches, as it can adaptively select the most informative and representative instance for a given dataset.
The key to active learning lies in the query strategy, which decides the accuracy of the classifier as the desirable instance can be selected by this query strategy to improve the performance. Two informativeness-based query strategies and two representativeness-based query strategies are described in this section.
Supposed there is a dataset with
Informativeness criteria
Entropy (Ent) favors the most informative instances where the classification model is most uncertain about their class label:
where the
Query-By-Committee (QBC) chooses the unlabeled instance whose label is most ambiguous based on several different classifiers:
where the
Node potential (Nod) adopts a Gaussian weighting function to find the representative instances that near or are located in the dense regions:
note that the distance between two instances
Kernel (Ker) explores the undiscovered regions to find the most representative instance according to the data distribution:
where
No one algorithm can select the appropriate query strategies and trim their weights from the previous experience simultaneously. Meanwhile, in previous work, the combination of two criteria can not reinforce each other, as the sampling strategies and the weights between them during the whole active learning process usually are fixed. To address these issues, we first develop a novel adaptive formula, where the weights of the selected sampling strategies are updated by the classified gain for the previous iteration. A second part formalizes the active learning process as a decision process to learn a robust and dynamic policy, which favors the selection of the most efficient strategies according to the utility of the past sequence of annotating decisions. In this work, we focus on adaptively selecting the optimal sampling strategies for the classifier and adjusting their weights concurrently for a given dataset. Meanwhile, the informativeness and representativeness of selected instances are adopted implicitly as one kind of observation of the reinforcement learning agent. Hence, this algorithm is flexible enough to reinforce any combination of query strategies, showing a continuous improvement compared to several state-of-the-art active learning approaches.
In this section, we first introduce how the weight of sampling strategies can be dynamically adjusted using a new framework, and then show how to formalize active learning as a reinforcement learning problem for choosing an efficient combination of sampling strategies.
ALF
Inspired by [1], the framework that combines informativeness and representativeness criteria is displayed as follow:
where
The first improvement deploys a rank function to unify the measurement of informativeness and representativeness:
where
The crucial contribution of this work is that a new feedback function replaces the fixed probability
where
where
Thirdly, we propose a hypothesis using neighborhood entropy, which can measure the success of the previous learning process:
with
This hypothesis favors instances that are both informative and representative. Therefore, it can be a good measure of whether the past active learning process is effective.
The feedback has a large gradient in the interval [
where
In each iteration, the label of the instance
Selecting different combinations of query strategies on different datasets has different effects, so a mechanism is required to select the optimal query strategies for a given dataset. To address these drawbacks, the active learning process is formalized as a simpler MDP that is a general-purpose framework for decision making as a tuple
The crucial improvement applies the reward measuring the informativeness and representativeness to select desirable action. This allows the
where
The selection of query strategies and the trade-off between informativeness and representativeness are key ingredients to improve the performance of active learning. In previous work, the trade-off between informativeness and representativeness criteria is usually fixed in all scenes, which may achieve a sampling bias and cluster dependency. Therefore, the experience of previous learning processes is applied to select an appropriate and effective query strategy combination and adapt their weights to tackle this challenge. Based on the proposed optimal framework and sampling strategies selection mechanism, we propose an adaptive active learning method, whose flow-chart is as shown in Fig. 3. The work details of this method are mainly composed of the following two parts:
Framework diagram of the proposed algorithm. First of all, adapt the weight between the informative and representative criteria according to the feedback during the previous learning processes, then combine the query strategies based on the two criteria separately, and finally choose the sampling strategies with the maximum reward for a selection of the most valuable instances.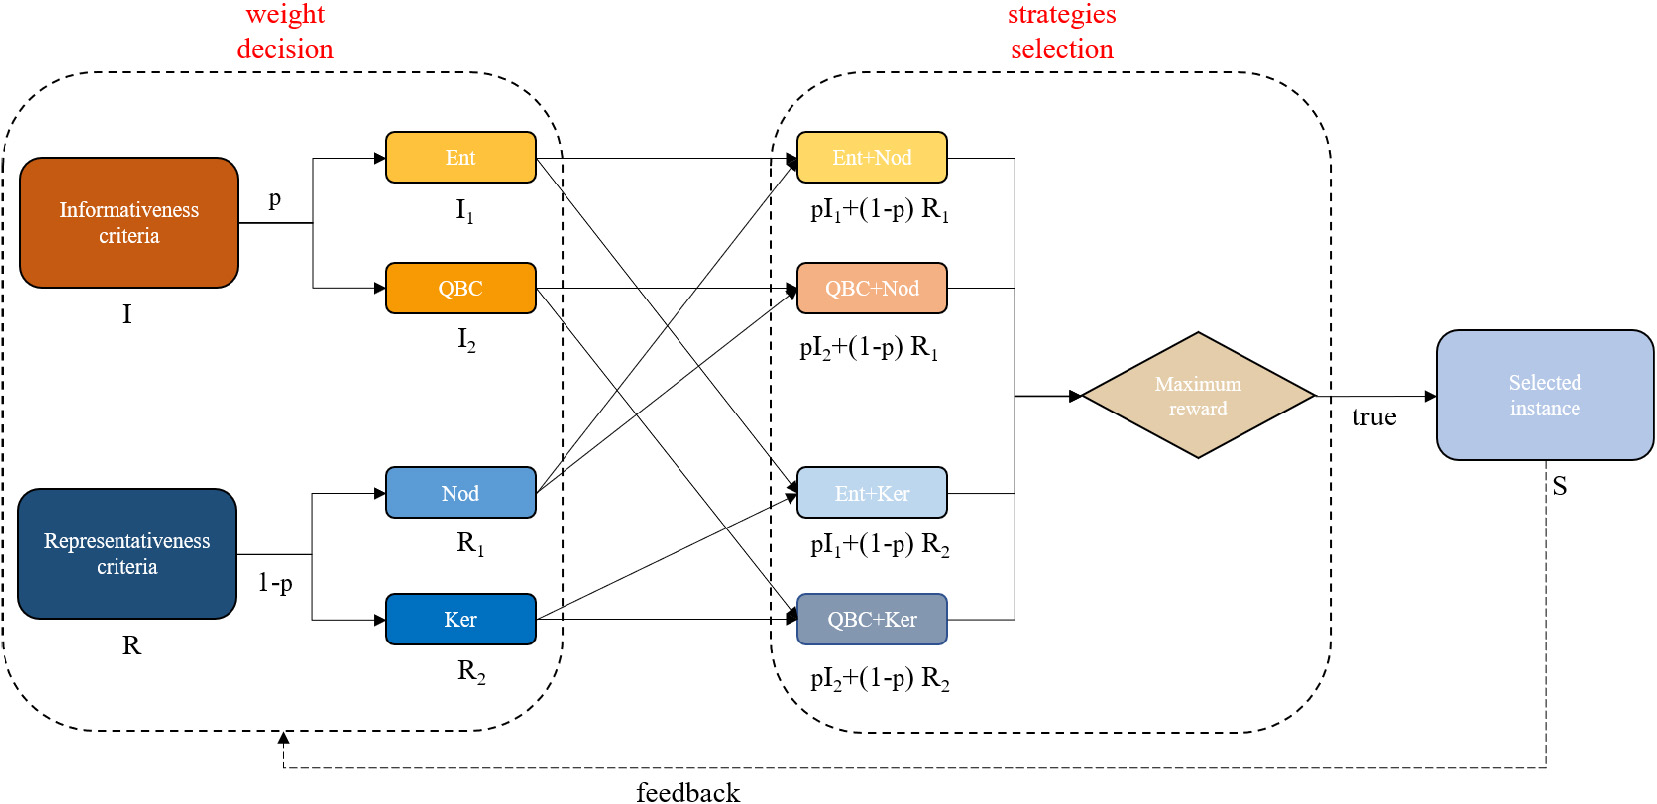
Weight decision: the fixed parameter is replaced by adapting weight during entire active learning processes as shown in the previous section, which can tackle the problem that a trade-off between selected query strategies is difficult to find. The main idea is that some datasets might need more exploration at the beginning and more exploitation at the end while other datasets might need a constant trade-off. To address this limitation, we use Eq. (7) to adjust the parameters of the selected query strategies, leading our work more flexible and convenient.
Strategies selection: the active learning process can be viewed as a sequence of decisions, and then it can be formulated as a Markov decision process (MDP) to select two effective query strategies over the entire labeling process. When the
When action
[h] : The ALIR Algorithm[1] Unlabeled dataset
In this section, we first verify the effectiveness of ALF and ALIR on the benchmark datasets, followed by applying our method to real problems.
Datasets
Twelve datasets in KEEL [35] and UCI [34] platforms are adopted to verify the effectiveness of our research, which is often used in the field of active learning. The classes of datasets include three two-class and nine multi-class, and the number of instances range from 214 to 5473, and their specific characteristics are described in Table 1.
The datasets information, including the number of corresponding features, labels, and instances
The datasets information, including the number of corresponding features, labels, and instances
Setting
In this part, we compare ALF with the following two algorithms:
PBAC [7]: queries informative and representative examples by weighted formula between uncertainty and diversity.
Exploration (Explora) [14]: adjusts the parameter of informativeness and representativeness using a MAB formulation to select a batch of instances.
The datasets are divided into the test set, the training set, and the unlabeled dataset. Among them, training instances account for 10%, test instances account for 30%, and unlabeled instances account for 60%. Exploration and PBAC use the recommended setting of [14, 7]. We initialize
Comparison with state-of-the-art methods
Table 2 shows the classification accuracy of three active learning algorithms and four combinations of query strategies with 50 queries. To compare the average classification accuracy, every five rows and three columns of the data section represent the results on a dataset. When comparing horizontally under each dataset, the best result for each strategies combination is shown in bold. The best performance for each dataset is shown in shades of gray.
Comparison of average classification accuracy, the best performance for each dataset is shown in the gray shadow, the best result for each combination of each dataset is highlighted in boldface
Comparison of average classification accuracy, the best performance for each dataset is shown in the gray shadow, the best result for each combination of each dataset is highlighted in boldface
From above results, We observe 1) The average ACC values of ALF are superior to Exploration and PBAC in most cases.
2) ALF significantly outperforms other comparison algorithms on the biodeg, led7digit, and ionosphere datasets, especially on biodeg by 2.4%.
3) PBAC works best on some dataset but performs poorly on others due to the fixed parameter of informativeness and representativeness. The phenomenon of Exploration is similar to PBAC, which achieves good performance on some datasets and performs a deficiency on others as the adaptation of weight between uncertainty and diversity is limited.
4) The times of
5) There is no one combination of sampling strategies works best in every dataset since different query strategies have different performances on different datasets.
6) ALF outperforms the baseline methods for most cases as it focuses on the most valuable instances by an adaptive framework based on informativeness and representativeness.
Comparison on AUC.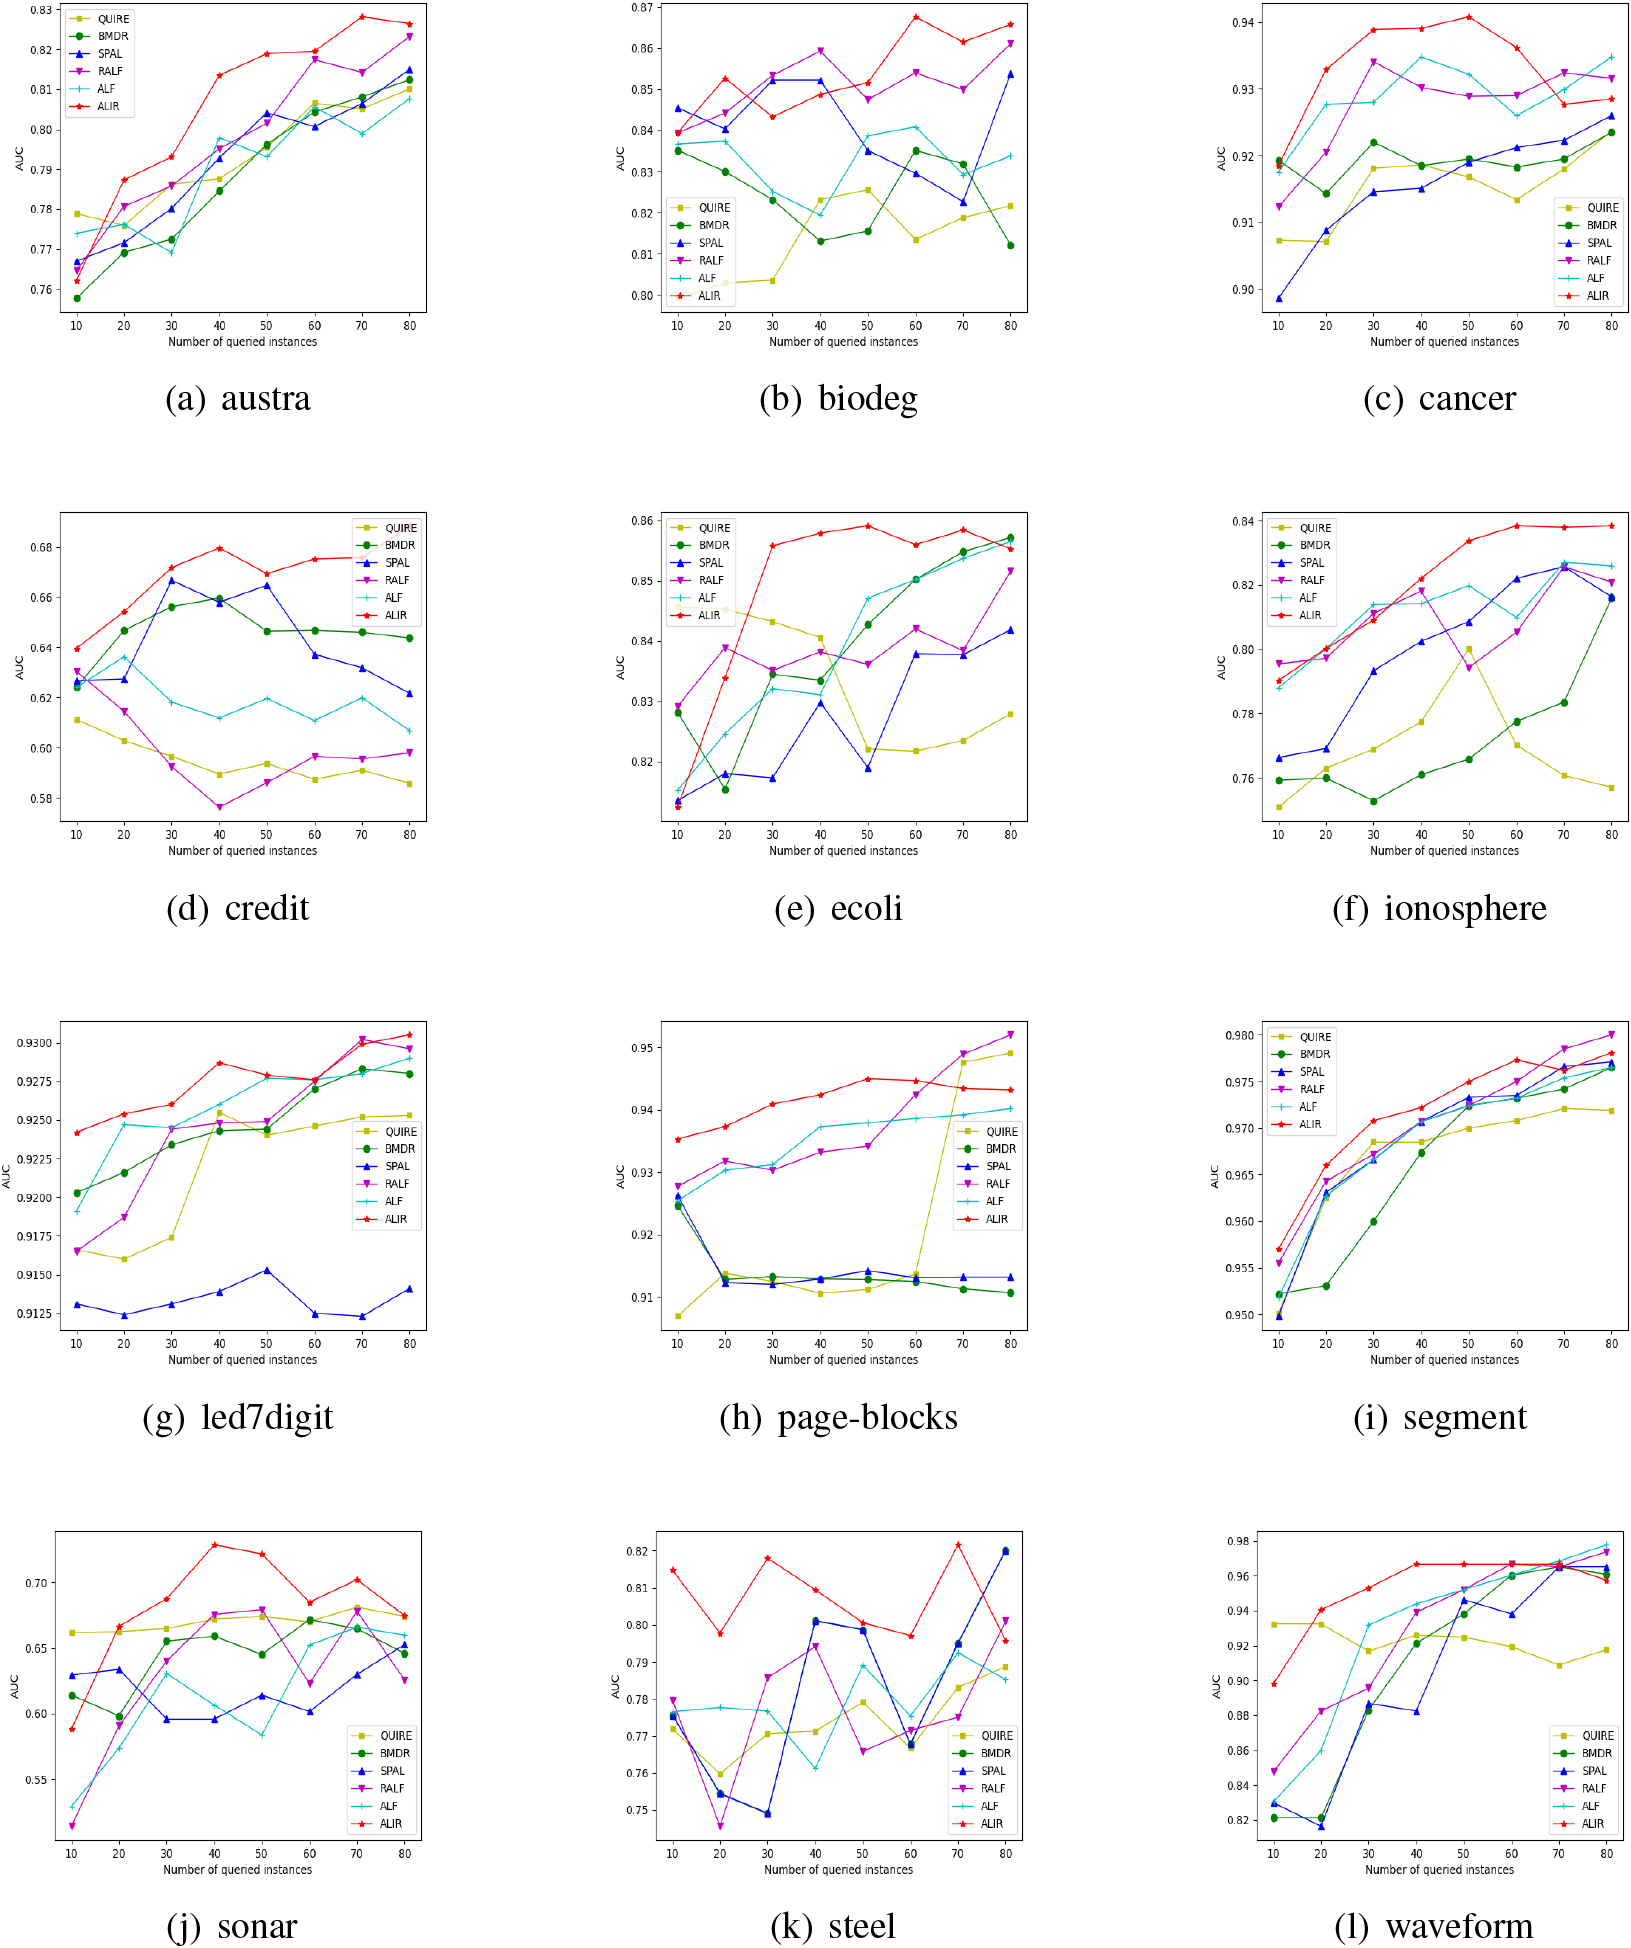
Comparison on F1-score
In this part, we compare ALIR with five algorithms:
QUIRE [2]: selects informative and representative instances using the min-max approach.
BMDR [28]: favors the selection of discriminative and representative examples by minimizing the ERM risk bound of active learning.
SPAL [29]: queries informative, representative, and easy examples by minimizing a well-designed objective function.
RALF [1]: chooses informative and representative examples by a feedback-driven framework.
ALF: selects informative and representative examples by a dynamically adaptive framework based on the experience of previous learning processes.
The dataset division is the same as the previous section. We set
ALF uses the best combination
Comparison with state-of-the-art methods
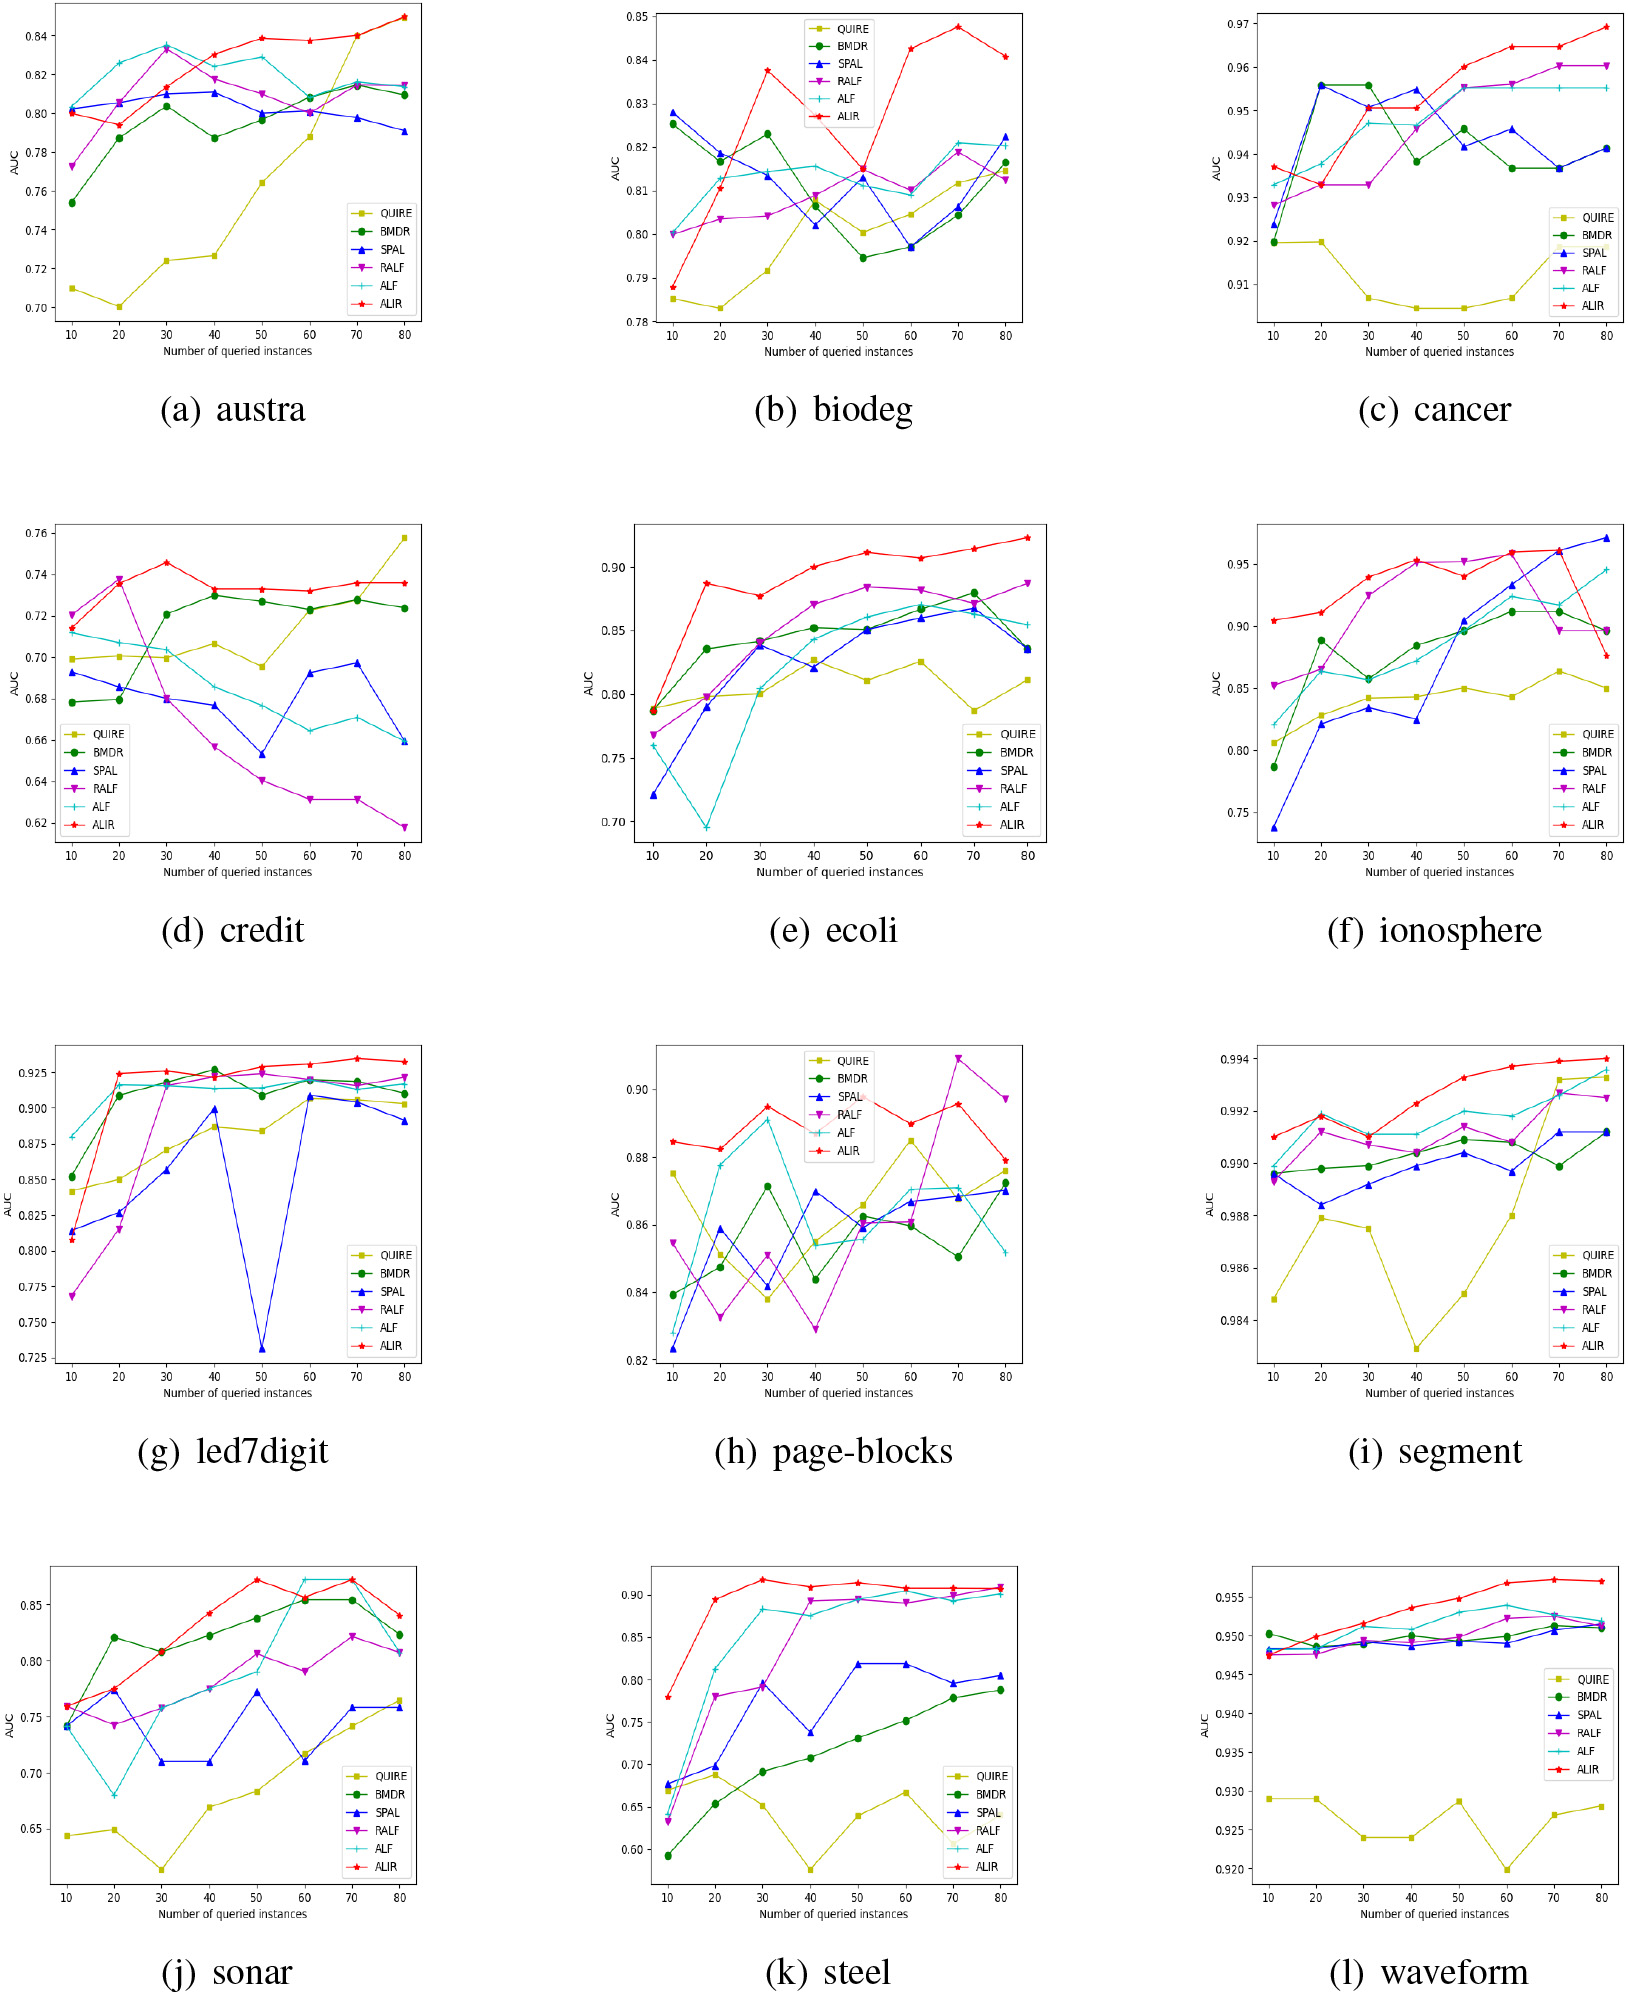
Figure 4 displays AUC values on six active learning algorithms with an increasing number of labeled instances queries. The performance on F1-score with an increasing number of queries are shown in Table 3. The best result for each dataset is highlighted in boldface.
We observe 1) The AUC values of ALIR are superior to other state-of-the-art algorithms in most cases. The average AUC values of ALIR on datasets austra, sonar, credit, and waveform are significantly better than other algorithms, especially on dataset credit, which is improved by 4.93% on average.
2) ALIR has an obvious advantage in F1-score compared with other approaches. The average F1-score of ALIR on the dataset credit, page-blocks, segment, and sonar are distinctly better than others, especially on dataset sonar, which is improved by 10.84% on average.
3) With the continuous queries for unlabeled instances, the classification performance of ALF and ALIR is on the rise due to the adaptive and effective feedback during the query processes.
4) QUIRE and BMDR perform a deficiency in most cases due to their without developing an adaptive mechanism to tune the trade-off automatically. SPAL performs poorly on some datasets since it focuses on the instances that have high potential value but the feedbacks of previous learning are neglected. RALF often achieves a suboptimal on most datasets due to insufficient feedback. ALIR outperforms ALF for most cases as it can choose the optimal query strategies combination in each round of active learning.
5) In general, compared to the baselines, our approach ALIR achieves the best performance in most cases, as it can choose the optimal query strategies combination for each dataset, and adapt the weight between the informativeness and the representativeness criteria according to previous feedback of active learning processes, leading to a selection of the most informative and representative instance.
Application on ALIR
Datasets of practical application
Assumed that under the premise that high-complexity modules have a high defect rate by software defect prediction theory, some measurements of software products are applied to characterize the complexity of software products, and then the defect status of software modules can be predicted. According to the prediction results, software development organizations can focus their limited development and test resources on high-risk modules that are prone to defects, so as to find and eliminate defects more effectively, and improve the quality and reliability of software products. In order to apply the proposed method to this practical problem, the KC1 dataset (NASA) from the public NASA repository was selected, which contains 2109 records of software defects, each of which contains 21 features that attempt to objectively characterize code features that are associated with software quality. In this case, each record is classified as either non-defective or defective.
When diagnosing cardiovascular disease through ECG, the change of each waveform is actually concerned. For example, when the QRS wave becomes larger and wider, premature ventricular contractions may occur; when the ST segment is elevated, myocardial infarction may occur. Therefore, some morphological characteristics or other measurements of the ECG signal are usually used to visually represent the changes of various waveforms. In this way, through the most intuitive feature representation of waveform changes, the diagnosis results of cardiovascular and cerebrovascular diseases can be predicted. The ECG5000 dataset consists of 5000 heartbeats extracted from a 20-hour long electrocardiogram of a patient with severe congestive heart failure. Each record constants 140 features and is classified into one of the five categories: normal (58.4% of the entire instances), R-on-T Premature Ventricular Contraction (PVC) (35.3%), PVC (1.9%), supraventricular (3.9%), and unclassifiable (0.5%).
Setting
The training/testing instances segmentation is consistent with the previous section, the comparing algorithms include QUIRE, BMDR, SPAL, RALF, ALF, and ALIR. The classification accuracy (ACC) is applied to verify the experimental results. To get rid of the influence of randomness, we use the average of 10 times execution results as the final result.
Comparison with state-of-the-art methods
Comparison on ACC.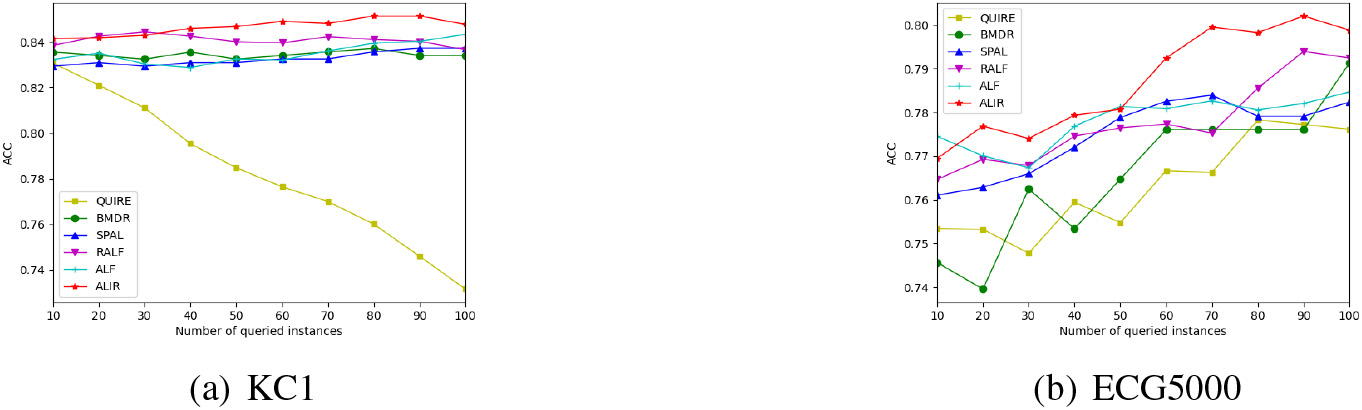
Figure 5 demonstrates the classification accuracy of our method compared to the baseline algorithms on the real problem, ALIR achieves consistently better performance across the different numbers of labeled instances. The average ACC of ALIR on dataset KC1 is 1.5% higher than various benchmark algorithms, whereas it achieves 2.2% better than other methods on dataset ECG5000. The performance gap is more clear especially with increasing the number of queries where the selected instances contributed to model training. QUIRE suffers from a significant gap in performance when compared with ALIR, especially in dataset KC1. In general, empirical experiments demonstrate that the proposed ALIR can achieve promising results and clearly exceeds the established baseline.
This paper proposes a novel adaptive active learning algorithm, which can dynamically select sampling strategies and adjust the weights between them for different datasets. In this method, the weight between informativeness and representativeness is dynamically updated by measuring the success of the previous learning process. Further, by formulating the entire active learning process as a Markov decision process, the sampling strategies with maximum reward are chosen by a robust policy learned from the past decision process. Hence, our method achieves frequently optimal performance during the whole active learning process and is fast and efficient due to an adaptive process without dataset-specific tuning. Results on benchmark datasets and real datasets show a superior improvement of the classification performance with the proposed approach, compared to other state-of-the-art methods. We observe from our experiments that it is beneficial to dynamically update the trade-off parameter which balances the informativeness and representative during the query process. In the future, extending it to high-dimensional instances is the next step in the research, such as image processing, natural language processing, etc.
Footnotes
Acknowledgments
This work is supported by the National Natural Science Foundation of China (Nos. 61563012 and 61802085), Innovation Project of Guangxi Graduate Education (YCSW2019162), and the Guangxi Key Laboratory of Embedded Technology and Intelligent System Foundation (No. 2018A-04).
Appendix
Experiments for ALF based on DT and SVC
Table A1 displays a comparison of average classification accuracy based on DT for ALF, and the one based on SVC is shown in Table A2.
Comparison of average classification accuracy based on DT
Dataset
Austra
Biodeg
Segement
Combination
PBAC
Explora
ALF
PBAC
Explora
ALF
PBAC
Explora
ALF
Ent
0.793
0.794
0.732
0.722
0.862
0.856
Ent
0.793
0.799
0.712
0.725
0.866
QBC
0.793
0.793
0.722
0.739
0.877
0.867
QBC
0.787
0.801
0.713
0.737
0.878
0.867
Mean
0.792
0.798
0.725
0.730
0.871
0.867
Dataset
Cancer
Credit
Sonar
Combination
PBAC
Explora
ALF
PBAC
Explora
ALF
PBAC
Explora
ALF
Ent
0.891
0.881
0.577
0.632
0.529
0.516
Ent
0.905
0.896
0.609
0.605
0.514
0.522
QBC
0.902
0.880
0.608
0.607
0.548
0.543
QBC
0.900
0.888
0.613
0.625
0.497
0.508
Mean
0.900
0.890
0.610
0.618
0.522
0.526
Dataset
Ecoli
Ionosphere
Steel
Combination
PBAC
Explora
ALF
PBAC
Explora
ALF
PBAC
Explora
ALF
Ent
0.573
0.634
0.821
0.834
0.535
0.555
Ent
0.625
0.651
0.831
0.835
0.546
0.540
QBC
0.574
0.626
0.858
0.816
0.550
0.545
QBC
0.623
0.651
0.834
0.848
0.520
0.530
Mean
0.599
0.649
0.836
0.835
0.538
0.546
Dataset
Led7digit
Page-blocks
Waveform
Combination
PBAC
Explora
ALF
PBAC
Explora
ALF
PBAC
Explora
ALF
Ent
0.589
0.582
0.950
0.948
0.717
0.720
Ent
0.592
0.589
0.947
0.710
0.720
QBC
0.588
0.607
0.946
0.948
0.723
0.717
QBC
0.614
0.603
0.592
0.948
0.947
0.703
0.716
Mean
0.596
0.595
0.949
0.948
0.713
0.720
Comparison of average classification accuracy based on SVC
Dataset
Austra
Biodeg
Segement
Combination
PBAC
Explora
ALF
PBAC
Explora
ALF
PBAC
Explora
ALF
Ent
0.547
0.553
0.811
0.823
0.899
0.902
Ent
0.553
0.545
0.791
0.902
0.899
QBC
0.549
0.533
0.797
0.826
0.913
0.904
QBC
0.547
0.543
0.790
0.827
0.901
0.902
Mean
0.549
0.544
0.805
0.816
0.906
0.902
Dataset
Cancer
Credit
Sonar
Combination
PBAC
Explora
ALF
PBAC
Explora
ALF
PBAC
Explora
ALF
Ent
0.915
0.931
0.514
0.673
0.472
0.467
Ent
0.924
0.932
0.672
0.673
0.471
0.467
QBC
0.924
0.931
0.528
0.655
0.482
0.468
QBC
0.920
0.930
0.673
0.673
0.489
0.459
Mean
0.921
0.932
0.597
0.668
0.479
0.462
Dataset
Ecoli
Ionosphere
Steel
Combination
PBAC
Explora
ALF
PBAC
Explora
ALF
PBAC
Explora
ALF
Ent
0.700
0.708
0.901
0.498
0.483
Ent
0.714
0.716
0.883
0.454
0.467
QBC
0.680
0.699
0.905
0.897
0.474
0.484
QBC
0.708
0.726
0.895
0.903
0.465
0.482
Mean
0.701
0.719
0.897
0.903
0.911
0.473
0.479
Dataset
Led7digit
Page-blocks
Waveform
Combination
PBAC
Explora
ALF
PBAC
Explora
ALF
PBAC
Explora
ALF
Ent
0.635
0.639
0.927
0.931
0.806
0.808
Ent
0.643
0.635
0.929
0.930
0.806
0.814
QBC
0.624
0.621
0.923
0.921
0.798
0.797
QBC
0.634
0.637
0.924
0.805
Mean
0.634
0.634
0.927
0.927
0.804
0.809
Experiments for ALIR based on DT and SVC
The performance of the F1-score with an increasing number of queries based on DT and SVC are shown in Tables A3 and A4. The best result for each dataset is highlighted in boldface.
Figures A1 and A2 also display AUC values on six active learning algorithms with an increasing number of labeled instances queries based on DT and SVC.
Comparison of F1-score based on DT
Number of queries
Dataset
10
20
30
40
50
60
70
80
Mean
Austra
QUIRE
0.7209
0.7119
0.7311
0.7599
0.7485
0.7503
0.7970
0.7692
0.7486
BMDR
0.7245
0.7142
0.7838
0.7491
0.7692
0.7750
0.7588
0.7450
0.7525
SPAL
0.7481
0.7332
0.7752
0.7395
0.7404
0.7660
0.7662
0.7911
0.7575
RALF
0.6575
0.7271
0.6938
0.7430
0.7389
0.6703
0.6846
0.7094
ALF
0.7573
0.7283
0.7665
0.7013
0.6989
0.7128
0.6835
0.7476
0.7245
ALIR
0.7568
Biodeg
QUIRE
0.7762
0.7616
0.7574
0.7617
0.7645
0.7706
0.7758
0.7805
0.7685
BMDR
0.7744
0.7606
0.7555
0.7452
0.7655
0.7773
0.7655
0.7805
0.7656
SPAL
0.7571
0.7638
0.7635
0.7712
0.7712
0.7561
0.7568
0.8168
0.7696
RALF
0.7610
0.7475
0.7269
0.7465
0.7491
0.8082
0.8072
0.7715
ALF
0.7709
0.7475
0.7211
0.7500
0.7558
0.7532
0.7860
0.7770
0.7577
ALIR
0.8059
Ecoli
QUIRE
0.4668
0.5340
0.4905
0.5037
0.5538
0.5415
0.5964
0.5746
0.5327
BMDR
0.5255
0.4534
0.4987
0.5830
0.5217
0.5263
0.4994
0.5316
0.5175
SPAL
0.5201
0.4626
0.5339
0.5462
0.5370
0.4941
0.4818
0.4703
0.5058
RALF
0.5255
0.5869
0.6191
0.6528
0.6375
0.6290
0.6459
0.6124
ALF
0.5117
0.5600
0.6590
0.5991
0.6260
0.5991
0.6636
0.6091
ALIR
0.5907
0.6321
Credit
QUIRE
0.5322
0.5280
0.5802
0.5665
0.5651
0.5675
0.5708
0.5764
0.5608
BMDR
0.5594
0.5081
0.5779
0.6051
0.5557
0.5248
0.5563
0.5628
SPAL
0.4716
0.5136
0.5260
0.5792
0.5507
0.5507
0.5977
0.5482
RALF
0.5291
0.5211
0.5229
0.5143
0.4858
0.5143
0.4481
0.4895
0.5031
ALF
0.5594
0.5748
0.5965
0.5285
0.5279
0.5211
0.4759
0.4605
0.5306
ALIR
0.5742
0.6070
Led7digit
QUIRE
0.6125
0.6953
0.6938
0.6878
0.6866
0.6651
0.6663
0.6597
0.6709
BMDR
0.6671
0.6608
0.6608
0.6680
0.6690
0.6780
0.6886
0.6952
0.6734
SPAL
0.6684
0.6671
0.6492
0.6492
0.6462
0.6723
0.6786
0.6786
0.6637
RALF
0.6906
0.6902
0.6925
0.6882
0.6882
0.7104
0.7018
0.7167
0.6973
ALF
0.6886
0.6886
0.6945
0.6932
0.7273
0.7273
0.7041
ALIR
0.6876
0.7203
Steel
QUIRE
0.7598
0.8420
0.8538
0.8619
0.8817
0.9059
0.8924
0.8550
BMDR
0.7696
0.8045
0.8377
0.8534
0.8651
0.8770
0.8368
0.8682
0.8390
SPAL
0.8132
0.8377
0.8604
0.8691
0.8551
0.8922
0.8515
RALF
0.7975
0.8010
0.8420
0.8569
0.8656
0.8656
0.8813
0.8356
ALF
0.7626
0.8298
0.7966
0.8420
0.8569
0.8656
0.8805
0.8875
0.8402
ALIR
0.7591
0.8263
0.8883
Segment
QUIRE
0.8756
0.8579
0.8623
0.8683
0.8840
0.8803
0.8849
0.8778
0.8739
BMDR
0.8761
0.8773
0.8711
0.8693
0.8826
0.8837
0.9016
0.8994
0.8826
SPAL
0.8788
0.8753
0.8750
0.8810
0.8859
0.8732
0.8863
0.8804
RALF
0.8593
0.8642
0.8675
0.8675
0.8577
0.8797
0.8717
0.9096
0.8722
ALF
0.8540
0.8686
0.8830
0.8888
0.8881
0.8628
0.8825
0.8771
ALIR
0.8761
0.8852
Sonar
QUIRE
0.6190
0.6898
0.7203
0.7144
0.7525
0.7553
0.8194
0.8224
0.7366
BMDR
0.7602
0.8385
0.7732
0.7428
0.7428
0.7758
0.7933
0.7753
SPAL
0.7401
0.7863
0.7706
0.8403
0.8403
0.8551
0.8394
0.8568
0.8161
RALF
0.7088
0.7715
0.7863
0.7959
0.8150
0.8551
0.9047
0.9047
0.8178
ALF
0.7401
0.7441
0.7332
0.7297
0.7715
0.8253
0.9221
0.9047
0.7963
ALIR
0.7497
Page-blocks
QUIRE
0.7126
0.6850
0.5431
0.5443
0.5443
0.7012
0.7186
0.7084
0.6447
BMDR
0.7201
0.6767
0.6574
0.7822
0.7747
0.7598
0.7822
0.7791
0.7415
SPAL
0.7201
0.6289
0.7189
0.6357
0.7747
0.7598
0.7871
0.7903
0.7269
RALF
0.7375
0.7617
0.7822
0.7958
0.7797
0.7729
0.7738
Table A3, continued
Number of queries
Dataset
10
20
30
40
50
60
70
80
Mean
ALF
0.7313
0.7673
0.7493
0.7282
0.7878
0.8039
0.7789
ALIR
0.7282
0.7673
0.8343
Waveform
QUIRE
0.7571
0.7150
0.7763
0.6958
0.6633
0.6513
0.7342
0.7459
0.7174
BMDR
0.7502
0.7890
0.7799
0.7805
0.7765
0.7918
0.7816
0.7816
0.7789
SPAL
0.7836
0.7932
0.7706
0.7757
0.7715
0.7873
0.8006
0.7958
0.7848
RALF
0.8048
0.8048
0.8144
0.7785
0.8105
0.8292
0.8138
ALF
0.8214
0.7534
0.7624
0.7579
0.8130
0.8147
0.7850
0.8028
0.7888
ALIR
0.8214
0.8204
Ionosphere
QUIRE
0.7118
0.7486
0.7549
0.7733
0.7936
0.8397
0.7910
0.7647
BMDR
0.5609
0.5550
0.5912
0.6704
0.7544
0.7877
0.8014
0.8268
0.6935
SPAL
0.6000
0.8053
0.8053
0.8180
0.8199
0.8199
0.8375
0.7856
RALF
0.6234
0.7348
0.7955
0.8112
0.8112
0.8493
0.8336
0.8121
0.7839
ALF
0.6831
0.7193
0.7867
0.7916
0.8415
0.8415
0.8444
0.8600
0.7960
ALIR
0.6743
0.7625
Cancer
QUIRE
0.9121
0.9188
0.8749
0.9085
0.8854
0.8910
0.8968
0.9007
0.8985
BMDR
0.9119
0.9198
0.9204
0.9200
0.9197
0.9198
0.9197
0.9207
0.9190
SPAL
0.9054
0.9054
0.9198
0.9265
0.9197
0.9198
0.9204
0.9207
0.9172
RALF
0.8975
0.9141
0.9213
0.9213
0.9268
0.9268
0.9331
0.9209
ALF
0.9125
0.9149
0.9031
0.9200
0.9279
0.9213
0.9204
0.9269
0.9184
ALIR
0.9200
Comparison of F1-score based on SVC
Number of queries
Dataset
10
20
30
40
50
60
70
80
Mean
Austra
QUIRE
0.3618
0.3634
0.3799
0.3805
0.3744
0.3643
0.3789
0.3970
0.3750
BMDR
0.4981
0.4702
0.6147
0.5891
0.5755
0.5939
0.5684
0.5617
SPAL
0.4981
0.4015
0.4702
0.5332
0.5835
0.5819
0.5763
0.4845
0.5162
RALF
0.3910
0.4127
0.3991
0.4346
0.4638
0.4901
0.4869
0.4805
0.4448
ALF
0.3910
0.4885
0.4997
0.4997
0.4502
0.4135
0.4478
0.4638
0.4568
ALIR
0.5763
Biodeg
QUIRE
0.6185
0.6144
0.6157
0.6345
0.6032
0.4605
0.4368
0.4187
0.5503
BMDR
0.7760
0.7867
0.7922
0.7859
0.7692
0.7692
0.7777
0.7868
0.7805
SPAL
0.7652
0.7813
0.7706
0.7759
0.7833
0.7819
0.7944
0.7964
0.7811
RALF
0.7803
0.7819
0.7797
0.7956
0.7819
0.7708
0.7879
0.7941
0.7840
ALF
0.7878
0.7918
0.7961
0.7786
0.7780
0.7697
0.7737
0.7992
0.7844
ALIR
Ecoli
QUIRE
0.5813
0.5653
0.5589
0.5589
0.4934
0.4934
0.5083
0.5354
BMDR
0.4087
0.5641
0.5396
0.5474
0.5110
0.5118
0.4173
0.4182
0.4898
SPAL
0.4359
0.4317
0.5396
0.5468
0.5295
0.5295
0.4106
0.4182
0.4802
RALF
0.3640
0.4156
0.5304
0.6628
0.6527
0.7075
0.7691
0.7953
0.6122
ALF
0.3574
0.5430
0.5455
0.5557
0.5877
0.7295
0.7801
0.6115
ALIR
0.4245
0.7649
Page-blocks
QUIRE
0.3874
0.3903
0.3903
0.3918
0.4411
0.4426
0.4422
0.4500
0.4170
BMDR
0.4382
0.4339
0.4603
0.4716
0.4808
0.4702
0.5033
0.5041
0.4703
SPAL
0.4382
0.4328
0.4339
0.4504
0.4565
0.4565
0.4550
0.4583
0.4477
RALF
0.4661
0.4716
0.4290
0.4315
0.4029
0.4029
0.4440
ALF
0.4681
0.4686
0.4725
0.4718
0.4916
0.4916
0.4772
ALIR
0.4547
0.4403
0.4608
0.4683
Table A4, continued
Number of queries
Dataset
10
20
30
40
50
60
70
80
Mean
Led7digit
QUIRE
0.5838
0.6363
0.6299
0.6312
0.6109
0.6170
0.6182
0.6182
0.6182
BMDR
0.6224
0.6224
0.6576
0.6691
0.6640
0.6640
0.6599
0.6653
0.6531
SPAL
0.6309
0.6201
0.6249
0.6255
0.6338
0.6338
0.6421
0.6449
0.6320
RALF
0.6691
0.6818
0.6802
0.6662
0.6567
0.6683
ALF
0.6633
0.6335
0.6681
0.6834
0.6865
0.6869
0.6732
0.6670
ALIR
0.6351
0.6367
Steel
QUIRE
0.5746
0.5717
0.5404
0.5364
0.4535
0.4661
0.4845
0.5303
0.5197
BMDR
0.6405
0.6405
0.6169
0.6287
0.6618
0.6098
0.5979
0.6137
0.6262
SPAL
0.6405
0.6350
0.5388
0.5388
0.5514
0.5135
0.5017
0.5490
0.5586
RALF
0.7123
0.6208
0.6807
0.6870
0.6334
0.6981
0.6838
ALF
0.6965
0.7052
0.6571
0.6492
0.6184
0.6697
0.6697
0.6697
0.6669
ALIR
0.6531
0.7296
Segment
QUIRE
0.9156
0.9142
0.9193
0.9182
0.9209
0.9176
0.9191
0.9205
0.9182
BMDR
0.9059
0.9133
0.9125
0.9173
0.9192
0.9262
0.9314
0.9297
0.9194
SPAL
0.9008
0.9022
0.9105
0.9183
0.9202
0.9223
0.9167
0.9182
0.9137
RALF
0.9101
0.9211
0.9220
0.9232
0.9208
0.9179
0.9270
0.9277
0.9212
ALF
0.9101
0.9097
0.9192
0.9247
0.9223
0.9162
0.9179
0.9257
0.9182
ALIR
Sonar
QUIRE
0.2624
0.5637
0.6781
0.5689
0.5970
0.4852
0.6372
0.6141
0.5508
BMDR
0.5305
0.4415
0.6782
0.7044
0.6933
0.6798
0.6495
SPAL
0.5503
0.5090
0.5924
0.6345
0.7068
0.6933
0.6551
0.6472
0.6236
RALF
0.4177
0.3486
0.5837
0.6345
0.6750
0.6750
0.7052
0.7091
0.5936
ALF
0.4177
0.3486
0.5448
0.6758
0.6480
0.6043
0.6123
0.6266
0.5598
ALIR
0.6258
0.7600
Credit
QUIRE
0.6068
0.6230
0.6429
0.6050
0.5909
0.6274
0.6346
0.6346
0.6207
BMDR
0.5951
0.6120
0.6372
0.6334
0.6279
0.6717
0.6417
SPAL
0.5261
0.5174
0.5272
0.5349
0.5349
0.5174
0.5803
0.6449
0.5479
RALF
0.5032
0.5524
0.5715
0.6563
0.6481
0.6574
0.6574
0.6755
0.6152
ALF
0.6424
0.6536
0.6503
0.6536
0.6574
0.6574
0.6563
0.6473
ALIR
0.5710
0.6705
0.6705
Waveform
QUIRE
0.9021
0.9021
0.8736
0.8795
0.8795
0.8737
0.8798
0.8737
0.8830
BMDR
0.8207
0.8350
0.8485
0.8651
0.8767
0.8700
0.9038
0.9038
0.8655
SPAL
0.8914
0.8203
0.8406
0.8651
0.8440
0.8974
0.8974
0.9038
0.8700
RALF
0.8150
0.8794
0.8794
0.9098
0.9339
0.9207
0.9008
ALF
0.8854
0.8982
0.9147
0.9204
0.9290
0.9290
0.9207
0.9164
ALIR
0.9290
0.9222
0.9298
Ionosphere
QUIRE
0.8679
0.8548
0.8659
0.8615
0.8802
0.8869
0.9192
0.9236
0.8825
BMDR
0.8338
0.8169
0.8278
0.8642
0.8731
0.8790
0.8726
SPAL
0.8147
0.8688
0.8688
0.8642
0.8680
0.8802
0.8938
0.8929
0.8689
RALF
0.9014
0.9094
0.9166
0.8676
0.8922
0.8874
0.8925
0.8925
0.8950
ALF
0.9014
0.9094
0.9010
0.8663
0.8764
0.8714
0.8769
0.8798
0.8853
ALIR
0.8701
0.8756
Cancer
QUIRE
0.8922
0.8922
0.8755
0.8701
0.8755
0.8866
0.8926
0.8980
0.8853
BMDR
0.9215
0.9296
0.9355
0.9353
0.9353
0.9290
0.9290
0.9353
0.9313
SPAL
0.9215
0.9105
0.9247
0.9277
0.9277
0.9277
0.9338
0.9307
0.9255
RALF
0.9072
0.9199
0.9297
0.9419
0.9391
0.9422
0.9480
0.9393
0.9334
ALF
0.9238
0.9266
0.9301
0.9268
0.9391
0.9260
0.9445
0.9456
0.9328
ALIR
Comparison of AUC based on DT.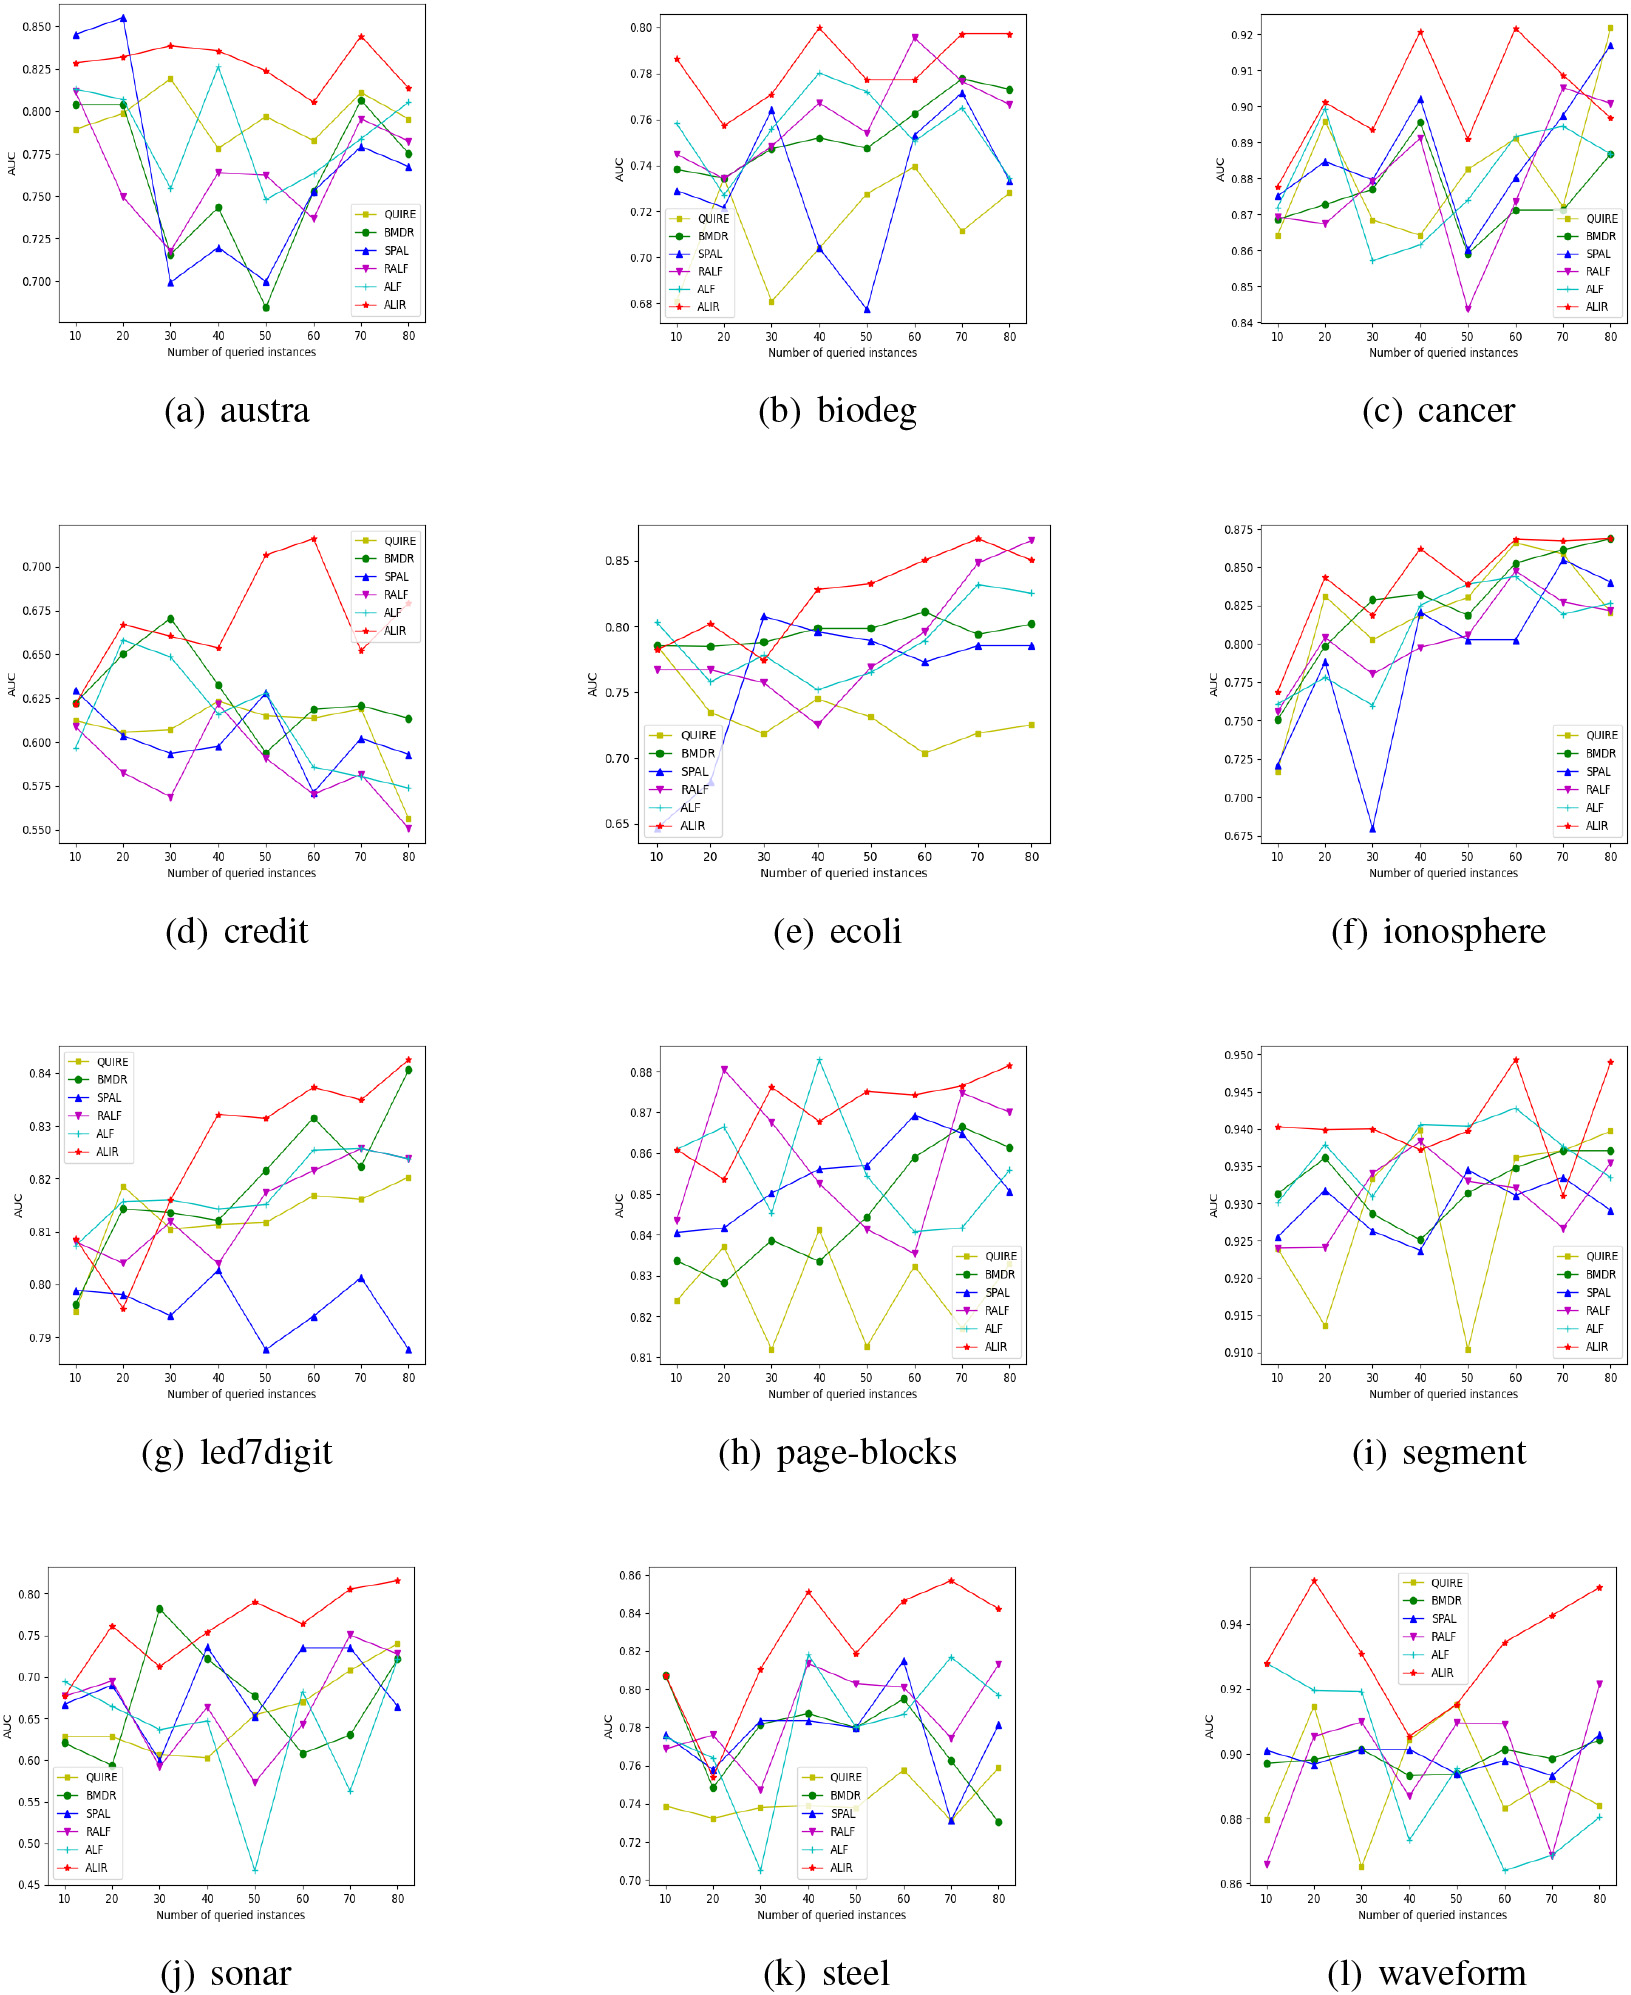
Comparison of AUC based on SVC.