Identifying structural hole spanners that benefit from acting as bridges between communities is a core study in social network analysis. Existing methods for identification mainly focus on measuring the ability of users to control information propagation by bridging holes, while ignoring the impact of reinforcement of the holes themselves on the benefits of bridging spanners. A recent sociological study shows that the more reinforced a hole is, the more likely it is to bring high benefits to its spanners. In this paper, we propose a node embedding-based method ReHSe for identifying reinforced structural hole spanners in social networks. Specifically, an integrated embedding method is devised to extract features encoding reinforcement properties of nodes into a low-dimensional space. Further, to improve the robustness and accuracy of identification, an incremental learning strategy based on a reserved set is employed to train a scoring network in this subspace, to find top- reinforced hole spanners. Extensive experimental results show that the performance of hole spanners identified by the proposed method outperforms several existing methods.
Nowadays, social networks (e.g., Twitter, Weibo, and TikTok) completely changed our lifestyle and become our main channels to access information and establish contacts. A pervasive and important concept in social network analysis is the structural hole theory proposed by the leading sociologist Burt [2]. Intuitively, a structural hole is a gap between disconnected communities that limit interactions and communications between the communities. Individuals who bridge the gaps can take advantage of the limitations to gain benefits, and such individuals are referred to as structural hole spanners [22].
It is of great value to identify structural hole spanners in social networks. For example, serving as bridge roles, it is easier for structure hole spanners to manipulate the information flow across communities in social networks [14, 16, 22, 37]. Finding a few important structural hole spanners can, on the one hand, promote information spread faster to different communities, and on the other hand, dramatically reduce the spread of rumors by filtering the misinformation passing through the hole spanners and thus avoiding harm and panic caused by the shaped public opinion [31, 39]. In addition, identifying employees who occupy bridging positions facilitates innovation in the enterprise. Because the employees have more opportunities to develop innovative ideas by merging diverse and valuable information from the non-redundant communities (i.e., companies or departments) they bridge, thereby creating more value [3, 5, 23]. More valuable applications include community detection [22], link prediction [13] and node or edge classification [9, 29], etc.
A lot of efforts have been devoted to identify structural hole spanners [3, 16, 17, 20, 22, 29, 36, 37]. Most traditional studies detect hole spanners using the network topology directly or based on analyzing the information flow. Burt [3] considered that the number of redundant contacts of a user determines the constraints imposed on him/her by a network, and higher constraints imply fewer opportunities to span structural holes, where the redundant contacts means that two contacts of a user are connected to each other. Lou and Tang [22] identified important hole spanners based on the two-step information flow theory, which suggests that nodes connecting with opinion leaders in different communities are more likely to act as hole spanners. He et al. [16] devised a harmonic modularity method to select the nodes with neighbors belonging to more different communities as the structural hole spanners.
Due to the effectiveness of machine learning in network analysis, some identification methods based on this have been proposed, which are more expressive and can mine more potential information than traditional methods. Integrating the idea of algorithm [16], Luo et al. [20] designed a graph convolutional network model based on an auto-encoder to simultaneously detect communities and hole spanners. Jiang et al. [17] adopted a non-backtracking strategy to embed the graph into a low-dimensional space, and then distinguished hole spanners in this space by evaluating the topological importance of nodes.
Motivations
Although the hole spanners identified by the existing methods yield good results in different applications, they all fail to capture an important property: the influence of a structural hole itself on its spanner. To bring more benefits to a user acting as a bridge, Burt [4] found that the more reinforced a structural hole, the greater the difficulty in bridging it, but the more likely a successful bridge will bring a high profit to the user. Here, a structural hole being reinforced implies the existence of strong internal cohesion within communities on each side of the hole, and we refer to the user bridging the hole as a reinforced hole spanner.
An illustration of reinforced structural hole spanners, where there are six communities , and nodes and are the hole spanners with different degrees of reinforcement between communities.
We use Fig. 1 as an example to explain why a more reinforced hole spanner benefits more. A network contains six communities and two hole spanners. User spans the structural hole formed by communities , , and , and user spans the structural hole formed by communities , , , and . Existing studies may regard as the more important spanner than user , because he bridges more communities and lies on the larger number of the shortest paths. However, it can be seen that members either in community , , or are loosely connected with each other, the sparse ties reduce the efficiency of collaboration within the community, and the smaller number of information exchange increases the probability of disagreement among members [3], such that the information propagated by user has difficulty in gaining unanimous trust from members in the community.
In contrast, each neighbor of user is embedded in a more tightly connected community, the hole spanned by is deepened. Information within communities (i.e., , , and ) on either side of user is more likely to be homogeneous and redundant, while the disconnection between communities enables different communities to operate with diverse ideas. Therefore, although user bridges only three communities, fewer than the four communities spanned by user , information within a community propagated by user is more likely to be innovative for other communities and thus adopted by members in the communities. Also, the successful bridge provides user with the opportunity to innovate by synthesizing ideas from both sides or to learn ideas and techniques from one side to solve the difficulties faced by the other side [3, 4]. As a result, user with access to a more reinforced structural hole can benefit more.
Motivated by the above considerations, in this paper, we combine this new research progress in sociology, i.e., the concept of reinforced structural holes, to detect hole spanners by capturing the influence of the properties of holes themselves on the benefits of their spanners, instead of relying on measuring the bridging ability of the users themselves in a network, as in existing studies.
Therefore, in this paper, we focus on the problem of identifying reinforced structural hole spanners in social networks. The primary challenge of the problem is to find a way to represent the extent to which each structural hole spanner is reinforced. With the capability of the graph embedding in capturing structural features, we consider generating vector representations to preserve the structural information of nodes as well as the connections within surrounding communities, thus capturing the reinforcement properties of each node so that it can be easily employed by the downstream identification task.
Contributions
To find the important structural hole spanners in social networks that not only have neighbors in many different communities, but also access reinforced structural holes, in this paper, we devise a novel method ReHSe, identifying top- REinforced structural Hole Spanners based on node Embedding, which considers only the topological structure of a network for generality reasons. Our main contributions are summarized as follows:
This is the first attempt to identify top- structural hole spanners using node embedding from the perspective of structural holes being reinforced.
We present an integrated embedding method by utilizing first-order proximity and -order reinforcement to characterize the reinforcement properties of each node in a social network, where can be flexibly tuned to allow the method to focus on local or global structure. And then we detect hole spanners by learning a score for each node in the embedding subspace.
To improve the accuracy and robustness of the model, we employ a reserved set-based incremental learning strategy to training, which combines the old and new samples to continuously optimize the feature representation space of nodes.
Finally, we conduct extensive experiments on real-world datasets, the experimental results demonstrate that the reinforced score of top- hole spanners identified by the proposed method is about 17% higher than those by existing methods, and have a stronger ability to spread information across communities.
The rest of the paper is organized as follows. Section 2 reviews related works. Section 3 presents key definitions used in this paper and formally defines the problem. Section 4 proposes a method for identifying reinforced hole spanners. Section 5 evaluates the performance of the proposed method and other benchmark methods through extensive experiments, and analyzes the parameters by ablation experiments. Section 6 concludes the paper.
Related work
This paper is mainly related to node embedding and structural hole spanners identification. In this section, we discuss both of them briefly.
Node embedding
The goal of node embedding is to map high-dimensional and intractable nodes from an original graph to low-dimensional vectors in an embedding space, while encoding the connection information between nodes, such that the low-dimensional embeddings can be conveniently applied to various graph analysis tasks, such as node classification, clustering, link prediction, and recommendation.
Depending on how the existing methods model the defined “close” (i.e., node/edge/subgraph similarities), they can be classified into three types [35]. The first type is the matrix decomposition-based method, which expresses the close relationship between nodes as a matrix, and generates the embeddings by decomposing the matrix. The typically adopted methods are to decompose the graph Laplacian eigenmaps [1, 30] modeling first-order proximity to learn node embeddings, or decompose the proximity matrix [38, 40].
The second type is the random walk-based method, which attempts to capture high-order proximity between nodes. Different from the above methods using deterministic measures of nodes proximity, these methods describe the co-occurrence relationships between nodes with a stochastic strategy. Perozzi et al. [25] pioneered the application of the famous neural language model Skip-Gram [24] into network analysis, representing the high-order neighborhood structure of nodes through a truncated random walk, so that node similarity and community information can be provided for downstream tasks. Moreover, a number of studies inspired by this have been proposed [11, 12, 33, 41], either using modified random walk strategies to sample paths or applying Skip-Gram with different optimization ways (e.g., Skip-Gram with negative sampling, heterogeneous Skip-Gram) on the generated paths to encode relationships between nodes. For example, in order to address the problem that method [25] can only capture the local structural properties of networks, Grover et al. [12] generated sampling paths utilizing a biased random walk, which controls the model by adjusting two hyper-parameters to approximate the depth-first search that captures global structural information, or the breadth-first search that captures local structural information, resulting in higher quality and more comprehensive embeddings. Dong et al. [11] devised a node embedding framework based on observations of the heterogeneity of node and edge types in most social networks. They first captured the relationships between different types of nodes using meta-paths-based random walk and employed a heterogeneous Skip-Gram on sampled paths to obtain node embeddings in heterogeneous information networks.
With the success of deep learning in various research fields(e.g. natural language processing, computer vision, etc.), several methods to encode proximity between nodes based on this have been proposed [8, 21, 32]. For example, Wang et al. [32] developed an embedding method to capture highly nonlinear network structures that adopts a deep auto-encoder to preserve the first- and second-order similarities between nodes. Cao et al. [8] first got nodes co-occurrence information by random surfing, which avoids the limitation of fixed length paths of traditional sampling, and then input the transformed positive pointwise mutual information matrix into an auto-encoder to extract node features.
The aforementioned methods aim to capture local neighbor similarity or higher order global neighborhood information, however, they cannot be directly applied to encode the reinforcement properties of nodes, therefore, to identify reinforced hole spanners, we propose an integrated embedding method for extracting the structural features of nodes and the connections between members within the communities they bridge.
Structural hole spanner identification
The identification of structural hole spanners has attracted a lot of attention from researchers due to its wide applications in various fields, such as the promotion and obstruction of information diffusion in social networks, enterprise settings, community detection, and node classification, etc. However, finding these hole spanners is remain a challenging task.
Most of the existing studies identified the top- hole spanners relying on measuring the ability of each node itself to bridge structural holes in the network. Burt [2] proposed a set of measures based on ego network, with two key metrics both focusing on the concept of redundancy, where a user with redundant connections means that his/her neighbors are also connected. One is called network constraint, which is used to measure the extent to which a node has access to redundant contacts. Higher constraint scores indicate fewer opportunities to access favorable resources. Then, the top- hole spanners identified are the node with the lowest scores. The other is effective size, which is a measure of the number of non-redundant contacts of each node. Nodes with higher effective size scores have more opportunities for information and control advantage, thereby acting as important hole spanners. Goyal et al. [15] ranked nodes according to their betweenness centrality, that is, measured the ability of nodes to participate in the shortest path between all pairs of nodes. The time complexity is however unsatisfactory. Tang et al. [29] improved it by counting only the number of two-step shortest paths where a node lies, extending its applicability to large graphs. Lou et al. [22] argued that the widespread of information in a network depends largely on the delivery between opinion leaders within communities and hole spanners across communities. Therefore, they selected the nodes that have connections with more opinion leaders in different communities as top- hole spanners. The prerequisite for the execution of the method is a well-suited community detection algorithm. He et al. [16] devised a harmonic function, which can be used to learn the communities indicator of nodes, and simultaneously help to select the top- hole spanners connected to more different communities. However, the method requires the ground-truth community labels and is not available in large-scale networks. Xu et al. [36] observed that the top- spanners are the nodes whose removal from the network will lead to the maximum increase in the average distance of the shortest path between all pairs. They then proposed two novel yet scalable algorithms for this task. Later, Xu et al. [37] suggested that important hole spanners should not only build relationships with multiple communities, but also maintain frequent and close ties with these communities. Therefore, they measured the bridging capability of each node by calculating the number of blocked information diffusion after removing the node from the network. And the top- spanners are the nodes that block the largest number of information diffusion.
The advantages of machine learning in performance improvement enable its application to network analysis. Compared with traditional methods, machine learning-based methods are more expressive and can capture more potential information, therefore, a few studies to identify hole spanners on this basis have been presented recently. Jiang et al. [17] utilized a non-backtracking random walk strategy to capture the neighborhood information of nodes, and factorized the combinatorial Laplacian matrix of an oriented line graph to obtain node embeddings. They then detected communities and structural hole spanners in this low-dimensional space. Luo et al. [20] designed a deep learning framework based on an auto-encoder to implement the idea of the algorithm proposed in [16] and improve its performance for joint detection of community and hole spanners under specific scenarios.
Unlike the aforementioned methods, we identify top- hole spanners by capturing the extent to which the structural holes themselves are reinforced.
Preliminaries
Let be an undirected unweighted social network, where is the set of nodes , and is the set of edges , representing the users and interactions between users in the social network, respectively. Let and . Denote by the adjacency matrix of network , where if , otherwise represents the edge weight of . For weighted network, we have . Denote by the power of matrix , where represents the number of paths with length exactly from node to node . Let diagonal matrix be the degree matrix of network , where is the degree of node . Note that when is a directed and/or weighted social network, the proposed method ReHSe is also applicable.
In this paper, we aim to identify reinforced structural hole spanners by measuring the internal cohesion of the communities to which each node is connected. For this purpose, the structural features within the -length range around the node should be preserved. However, the existing graph embedding methods that attempt to preserve local pairwise proximity or high-order proximity between nodes cannot be directly applied to encode such structural information. We thus employ an integrated node embedding method to extract features of each node, which involves the first-order proximity and the -order reinforcement. We define them as follows.
(First-order proximity).
The first-order proximity represents the local pairwise similarity between nodes. For any two nodes and in the network , the first-order proximity between them is the edge weight .
The first-order proximity emphasizes on the relationship of a pair of nodes. If two nodes are directly connected in network , their embedding vectors in the latent space tend to be similar. Since the contacts between intra-community nodes are relatively frequent compared to the inter-community nodes, if a node and its neighbors belong to the same community, they are more likely to have similar embedding vectors. Otherwise, the embedding vector of the node may be less similar to that of its neighbors belonging to different communities, indicating that it may be a hole spanner.
However, communities connected by different hole spanners vary greatly in their extent of cohesion, the first-order proximity fails to capture the information about the extent to which the structural hole bridged by a spanner is reinforced. Therefore, we introduce the -order reinforcement to extend the structural features of each node to a larger range.
(The th-order local relation).
For any node in the network , let be the set of the th-order neighbors of (e.g., ), then the th-order local relation of is the difference between the embedding vector of and that of the nodes in .
(-order reinforcement).
The -order reinforcement of each node is the reinforcement that node obtains from the combination of the first-order local relation to the th-order local relation.
The -order reinforcement of a node captures the network structure of the node at a different -order range, and the structure varies with the value of . By investigating such structural features, we can obtain information about the location advantage of this node. Since the differences in vector representations between a node and its th-order neighbors will reflect the number of the th-order neighbors of the node, which helps to find important hole spanners that have contacts in multiple communities. On the other hand, it can reveal how tightly connected it is between members within the communities it bridges.
Taking both the first-order proximity and the -order reinforcement into consideration for node embedding, and it can be formalized as follows.
(Node embedding).
Given a network , the node embedding problem aims to learn a mapping function that embeds each node into a low-dimensional space, in which the first-order proximity and -order reinforcement are preserved.
(Top- reinforced structural hole spanners).
Given a social network , the mapping function , the top- reinforced hole spanners problem in is to find a set of nodes , such that the nodes in with the maximum reinforcement, i.e.,
Methodology
In this section, we first present the general framework of the proposed method ReHSe. We then elaborate on the details of each of its components.
Model description
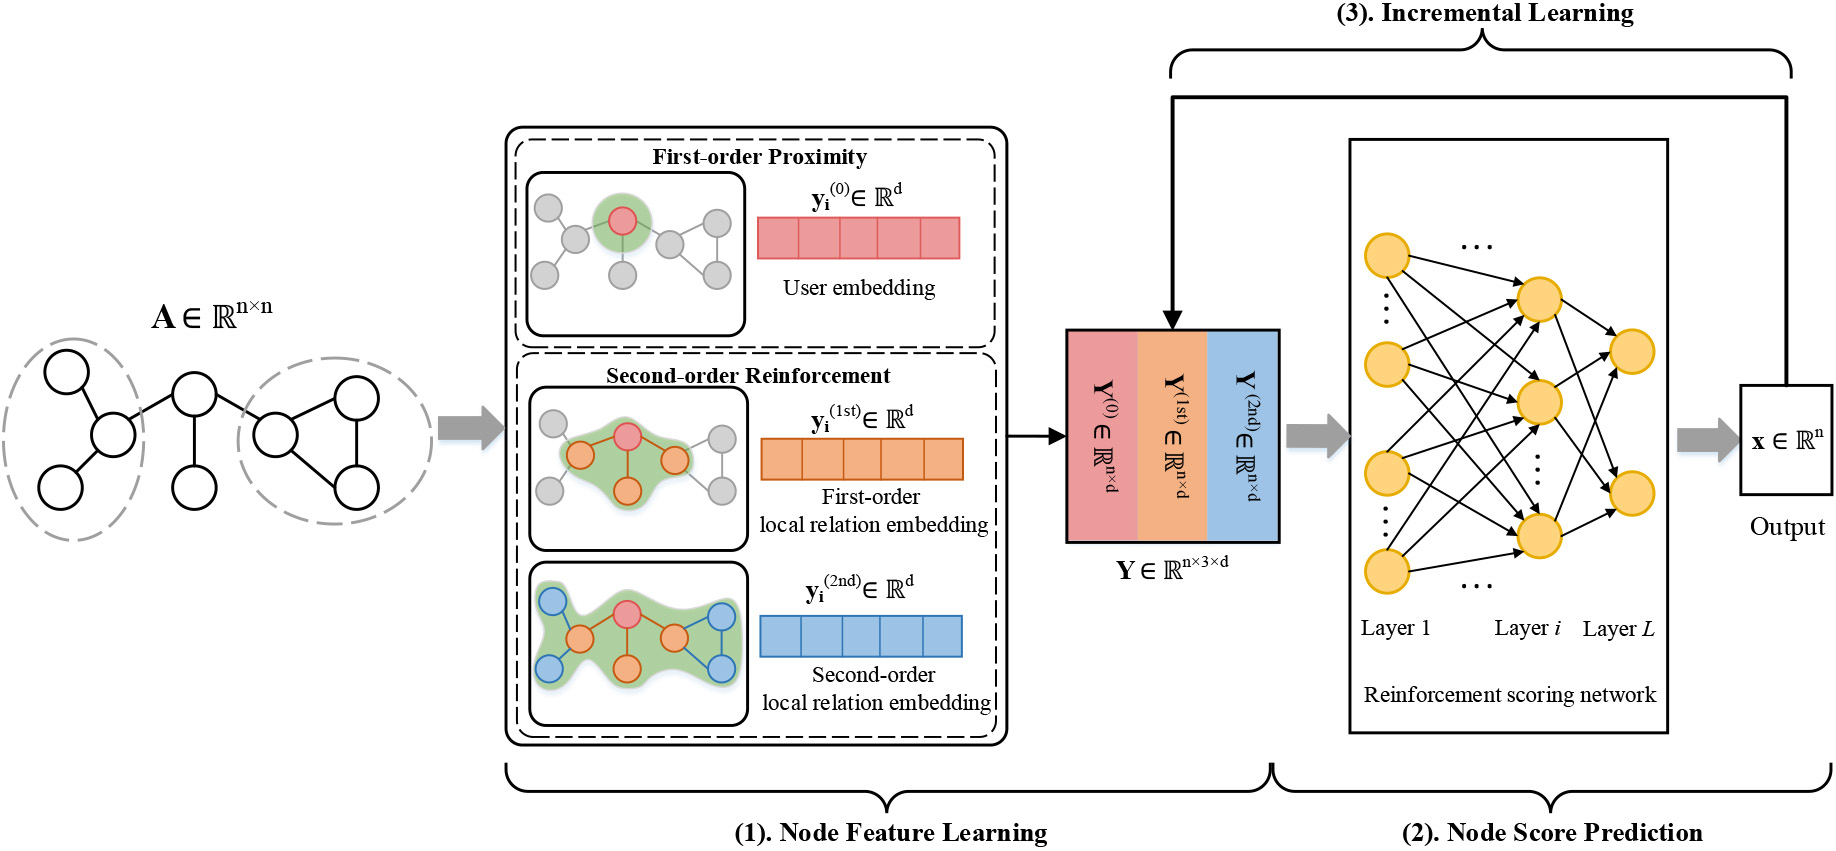
A desirable method for detecting structural hole spanners in real-world social networks should meet the following three requirements. The first is adaptability, it can handle arbitrary types of networks (directed or undirected, weighted or unweighted). The second is effectiveness, the structural hole spanners identified by it can play stronger bridging roles in the network, yielding more benefits on information and control. The third is robustness, since the structural features of hole spanners differ slightly in different social networks, by learning from various types of networks to expand the feature representations of hole spanners, it is able to deliver a better accuracy even for a new network to be identified. And the model performance continuously improves with the increase of training networks. In this paper, we develop a method ReHSe based on node embedding for identifying reinforced structural hole spanners, which satisfies the above requirements, and its framework is shown in Fig. 2.
Specifically, we first characterize the topological structure features of each node in network by preserving first-order proximity and -order reinforcement, such that the low-dimensional vectors are generated. Then, we input the obtained node embeddings into a fully connected neural network, which assigns a score to each node embedding by learning from the labeled hole spanners identified by the algorithm [4], and outputs the top- reinforced hole spanners ordered by the score. To enhance the accuracy and robustness of the model for identification, we finally use an incremental learning strategy based on a reserved set, whenever a new network to be identified is added, it is merged with old training samples to continuously optimize the feature representation space of nodes.
An illustration of the ReHSe framework for identifying reinforced structural hole spanners. The model input is the relationships of nodes in a social network and the output is the top- reinforced structural hole spanners.
Learning of node reinforcement features
Recall that to measure the extent to which each node is reinforced in the network , we first need to extract features covering first-order proximity and -order reinforcement about each node, i.e., the final embedding matrix of nodes, defined as , is a combination of the structural information of each order of the nodes, see the first stage in Fig. 2. Note that for ease of presentation, here we set the order to focus on the connection relationships within the second-order range. In fact, can be extended to a higher order, allowing the model to capture a wider range of structural features, and we discuss the impact of different values of on model performance in Section 5.3 ablation study.
Embedding with first-order proximity
We first model the first-order proximity. Let matrix be the -dimensional representation () of network , the -th row of is the embedding vector of node , represents the distance between node and in the latent space. We aim to find the optimal embedding to keep the connected nodes in are close to each other in the -dimensional space, and the natural way is to minimize the following objective function:
where indicates whether node is connected to . Based on the Laplacian Eigenmaps [1], denote by the Laplacian matrix of , the Eq. (2) can be rewritten as:
where the constraint ensures that the scaling invariance of the objective function in embedding. The optimal solution to this problem is given by the following generalized eigenvalue problem:
We sort the obtained eigenvalues in ascending order , the eigenvector corresponding to is disregarded since it is a constant. And we then select eigenvectors corresponding to to construct the matrix by columns, the -dimensional embeddings of each node are finally generated.
Embedding with r-order reinforcement
Then, we adopt a simple way to represent the second-order reinforcement features of each node , i.e., to calculate the first- and second-order local relation. Specifically, for any node with an embedding vector , where denotes the th element in vector . Denote by the first-order local relation embedding of node , which indicates the differences between and each of its direct neighbors, we have:
We thus have the first-order local relation matrix consisting of each node . Similarly, the second-order local relation embedding of node refers to the differences between and each of its indirect neighbors with path of length two, such that
where means node can reach via a two-step path. The second-order local relation matrix is thus .
By concatenating the matrices horizontally, we obtain the final node embeddings .
Prediction of reinforcement score
For each node with embedding vector in a given network to be identified, we predict the score of by training a reinforcement scoring network to determine the extent to which each node is reinforced. Specifically, we aim to evaluate the effect of each component (i.e., ) of a vector on its score by training, therefore, we take the embedding vectors of nodes in a training network as input, and then apply the reinforcement scoring network with four fully connected layers to map the input into the target representation space (see the second stage of Fig. 2).
To introduce the nonlinearity in the scoring network, we use Rectified Linear Unit (ReLU) as the activation function, since it can reduce the possibility of vanishing gradient, which causes the parameters to be updated slowly in each iteration. On the other hand, compared to the saturated nonlinear functions (e.g., sigmoid, tanh), the training time with gradient descent of non-saturated nonlinear function ReLU is faster, i.e., ReLU is more efficient in learning, such that networks with ReLU typically have a better convergence performance in practice [18]. Therefore, batch normalization and a function ReLU are used between the layers of the network. The hidden representation of each layer is formulated as:
where is the -th layer weight matrix, and is the -th layer bias vector with .
We use the algorithm RSH [4] proposed by Burt to calculate the ground-truth score of each node , which indicates how much the node is reinforced by the networks around its neighbors. Given a set of training samples with , the proposed model is then trained with the following loss function:
where represents the set of parameters, and the model is optimized with stochastic gradient descent.
Finally, the predicted scores of the nodes in can be obtained by feeding the embedding matrix of directly into the scoring network, and top- reinforced hole spanners are found by sorting the scores in non-increasing order. The process is presented in Algorithm 4.3.
[htp] : A nimble method for identifying top- reinforced hole spanners.[1] A social network for test, a training network , a training label set , a set of predicted scores of nodes in , embedding dimension , embedding order , and a positive integer A set of reinforced hole spanners Let set and ; Generate -dimensional embedding matrices and with -order for the networks and , respectively, by Eqs (4)– (6); Randomly select a batch from ; Train model with loss function ; convergence Predict the score of each node embedding in with the model; Sort the nodes in in non-increasing order by the predicted scores in , and select the top- nodes to ; .
An incremental learning method
Since network properties (e.g., density, average degree, clustering coefficient, etc.) vary across social networks, the structural features of hole spanners may be also slightly different. It is possible that the trained model works may works well on some test networks, while it may fails due to changes in the feature representation space of nodes caused by the addition of networks with new structural features. However, we cannot encompass all types of networks into the dataset at once to achieve a robust model for reinforced hole spanners identification.
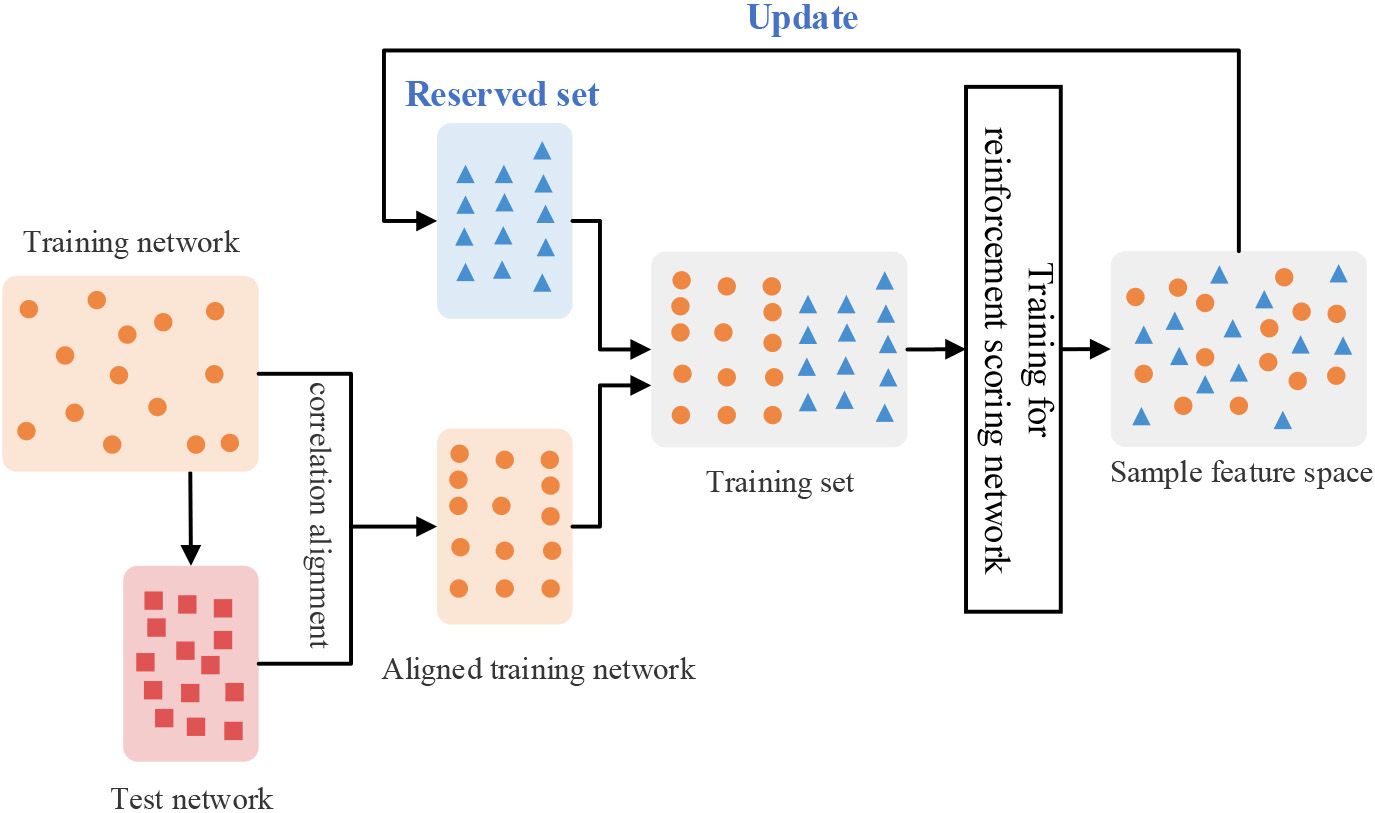
Therefore, to address this problem, we introduce an incremental strategy to train the scoring network, such that the additional available information from the addition of new training networks can help the model to adjust the parameters and expand the structural feature space of nodes, continuously improving the accuracy and robustness of the model. This corresponds to the third part in Fig. 2. Denote by the stream of training networks, and represents the given test network to be identified, in line with the idea of most incremental learning algorithms [7, 10, 34], in each incremental step (i.e., whenever a new training network enters), we construct a new training set for the model, which includes two parts: a sample set of the current new network, and a reserved set containing samples selected from the old networks that have been trained, as illustrated in Fig. 3.
An illustration of incremental learning, where orange dots represent the embedding vectors of nodes in the current training network, red squares represent the embedding vectors of nodes in the test network, and blue triangles indicate the representative samples selected for the reserved set (best viewed in color).
Domain alignment
Before we construct the training set for the current task, we first need to ensure that feature vectors from all training networks, which have different distributions, can be represented in a uniform latent space for subsequent sample selection. Therefore, we consider the feature space of each newly added training network as source domain, and align it toward that of the test network , which is viewed as target domain.
Specifically, suppose the th training network comes, denote by and the set of feature vectors of the network and the test network , respectively. To align the feature distributions of the source domain and the target domain , we first normalize the features on each dimension(i.e., dimensions) to z-score, where the z-score of a raw value is measured in terms of standard deviation from the mean. Each element in can be normalized by the following way
where is the mean of the th column of , and is the standard deviation of the th column of , we then have the normalized target domain , as well as the normalized source domain .
Although we have the normalized features of both the source and target domains, the distributions may still be different caused by differences in correlations. Here, we deal with correlation alignment based on the non-parametric feature learning method CORAL [27], which matches the distribution of source towards target domain features by aligning the second-order statistics (i.e., covariance) without the target being labeled. Applying the method on normalized of training network, we thus have
where is the covariance matrix, and are identity matrices of dimension . This process can be viewed as whitening the source to decorrelation, and then recoloring it with the covariance of the target [27].
Construct a reserved set
We then adopt a clustering center-based strategy to construct the reserved set, which is updated in each incremental step to include representative exemplars sampled from the feature space. That is, after the ()th incremental training, we select a given number of samples that can represent the structural features of nodes and store them in the memory unit to prepare for the th incremental task (see Fig. 3). Denote by the training set of the ()th task. Denote by the reserved set and the number of samples in , and is a positive integer, e.g., .
Since nodes with different embedding vectors correspond to different rsh scores, which is a quantification of the reinforcement properties of nodes, we first divide the nodes with vectors into two categories according to the score : nodes with score and . The centers of each category are calculated as follows.
where is the th element in vector , with . indicates the two categories, and is the number of samples in each category. Thus, the representation of the mean vector for each category is .
Then, we calculate the Euclidean distance between each sample in category and the center , we have
For each category, we retain samples by the distance , and construct the reserved set by merging the two categories. The procedure is described in Algorithm 4.4.2.
We finally generate a training set for the th incremental training task by combining the aligned feature vectors of the current training network and the constructed reserved set .
[!htb] : Construct a reserved set after the ()th incremental task.[1] The training set of the ()th incremental task, and memory size A reserved set of representative samples Let set ; For the embedding vector of each node , classify it by the score ; Calculate the mean vector and for category and category , respectively; For each vector , calculate its Euclidean distance to the mean vector ; Sort vectors in each category separately in non-decreasing order by the distance ; .
Identifying the top-k reinforced hole spanners
[!htb] : ReHSe: REinforced Hole Spanners detection based on Embedding.[1] A social network for test, the set of training networks, a set of labeled data of generated by algorithm [4], a reserved set , a set of predicted scores of nodes in , embedding dimension , embedding order , and a positive integer A set of reinforced structural hole spanners Let set and ; Generate -dimensional embedding matrix with -order of network , by Eqs (4)–(6); Calculate the normalized target domain , by Eq. (9); each training network in Generate -dimensional embedding matrix with -order of network , by Eqs (4)–(6); Compute the normalized source domain , by Eq. (9); Obtain the aligned feature matrix by matching the distributions toward the target domain , by Eq. (10); Construct a training set for the th incremental task; Randomly select a batch from ; Minimize the loss function by gradient descent; convergence Update the reserved set by invoking Algorithm 4.4.2; Predict the score of each node embedding with the model; Sort the nodes in non-increasingly by the score , select the top- nodes, and update set ; .
For the problem of top- reinforced hole spanners identification, we first extract features encoding reinforcement properties of nodes to the low-dimensional space. To improve the quality of identification, we then train the reinforcement scoring network using an incremental learning strategy for training, whenever a new network is available, we update the feature space to generate a new training set. Finally, we identify the hole spanners with the model. The detailed algorithm is given in Algorithm 4.5.
Experiments
In this section, we first evaluate the effectiveness of the proposed method ReHSe on eleven real-world networks, and compare it with various benchmark methods. We then conduct ablation experiments to analyze the effects of different parameters on the performance of the proposed method ReHSe.
Experimental setting
Datasets. We adopt eleven real-world network datasets with different types to study the effectiveness of algorithms, which are shown in Table 1. They include six social network datasets: karate club (social ties between members), fb-Reed98 (friendship ties between users), email-Eu-core (communication between members), hamsterster (friendship and family ties between users), wiki-Vote (voting data between users), LastFM-asia (mutual follower relationships between users); two collaboration network datasets: ca-GrQc, ca-HepTh; two entity network datasets: football (American football games between Division IA colleges), fb-politician (mutual links between facebook pages); and a biological network dataset: HC-BioGrid (physical and genetic interactions). The datasets email-Eu-core, wiki-Vote, LastFM-asia, ca-GrQc and ca-HepTh are obtained from SNAP repository [19], the dataset HC-BioGrid is acquired from [28], and the other five datasets are available on network repository platform [26].
Statistics of eleven real-world networks
Datasets
Avg. degree
Avg. clc
Karate club
34
156
4.6
0.5706
Football
115
1,226
10.7
0.4032
Fb-Reed98
962
37,624
39.1
0.3184
Email-Eu-core
1,005
25,571
25.4
0.3994
Hamsterster
2,426
33,260
13.7
0.5375
Ca-GrQc
5,241
28,968
5.5
0.5296
Ca-HepTh
9,875
51,946
5.3
0.4714
Fb-politician
5,908
83,458
14.1
0.3851
Wiki-Vote
7,115
103,689
14.6
0.1409
LastFM-asia
7,624
55,612
7.3
0.1786
HC-BioGrid
4,039
20,642
5.1
0.0595
Benchmark methods. In this paper, we compare the proposed method ReHSe with the following eight benchmark methods, the first method identifies reinforced hole spanners, while the other seven methods detect hole spanners without considering reinforcement.
RSH [4] first calculates the extent to which each node is reinforced by each pair of its neighbors, and then selects the most reinforced top- nodes as the hole spanners.
Constraint [3] measures the value of each node constrained by its neighbors, and selects the top- hole spanners with lowest values.
HIS [22] first assigns each node a score that is the importance of its neighbors in different communities, then chooses the nodes with the highest scores as hole spanners, where the ground-truth communities need to be predefined.
HAM [16] considers the number of communities that neighbors of each node belong to, then selects the top- nodes.
MaxD [22] detects nodes whose removals will result in maximizing the decrease in the number of minimal cut of communities in a network, assuming that the community labels are already known.
maxBlockFast [37] identifies nodes to maximize the number of blocked information propagation in a network after removing the nodes.
APGreedy [36] finds nodes, so that the increase of communication cost in the residual network will be maximized by their removals.
Note that since the execution of the methods HIS, HAM and MaxD requires ground-truth communities of networks, we use a community detection algorithm [6] to reveal community structure of datasets, which excludes datasets karate club, football and email-Eu-core, as their communities are available. The codes of algorithms HAM and ReHSe are written in python, and other algorithms are implemented in C. All algorithms are run on a server configured with an Intel(R) Xeon(R) CPU E5-2680 v4 with 2.4 GHz and a 64 GB RAM.
Performance evaluation
Evaluation criteria
In order to quantitatively evaluate the quality of the top- identified hole spanners, we consider the following two evaluation criteria.
Percent Reinforced hole spanners Score (Percent-RS) uses the metric Normalized RSH defined by Burt [4] to measure the sum of average extent to which spanners are reinforced by their pairs of neighbors. The Normalized RSH standardize the score by dividing the number of pairs of neighbors of a node (i.e., ), and it varies from zero to one, with the larger value indicating that each of the spanner’s neighbors lies in a larger and more cohesive community, thus bringing more benefits to the spanner. Given a network , and a set of top- hole spanners identified by an algorithm, then, the Percent-RS of the set is
Structural Hole Influence Index (SHII) [16] measures the influence of each hole spanner in information propagation across communities, and a higher SHII score indicates better performance. For each identified hole spanner , we compute its SHII score in as follows. We first construct a seed set by combining the spanner and a certain number of randomly sampled neighbors from the community to which belongs, and then perform an information propagation model (i.e., independent cascade (IC) or linear threshold model (LT)) several times to find the set of influenced nodes. The SHII of spanner is defined as
where is the set of communities in , is an indicator of whether a node is activated by the seed set. In our experiment, for each hole spanner, we set the ratio of randomly sampled neighbors to 5% for constructing the seed set, and we repeat the sampling 100 times and run the IC and LT models 1,000 times for each sampled seed set. Finally, we show the average values of SHII for the top- hole spanners identified by each method.
Percent reinforced hole spanners score
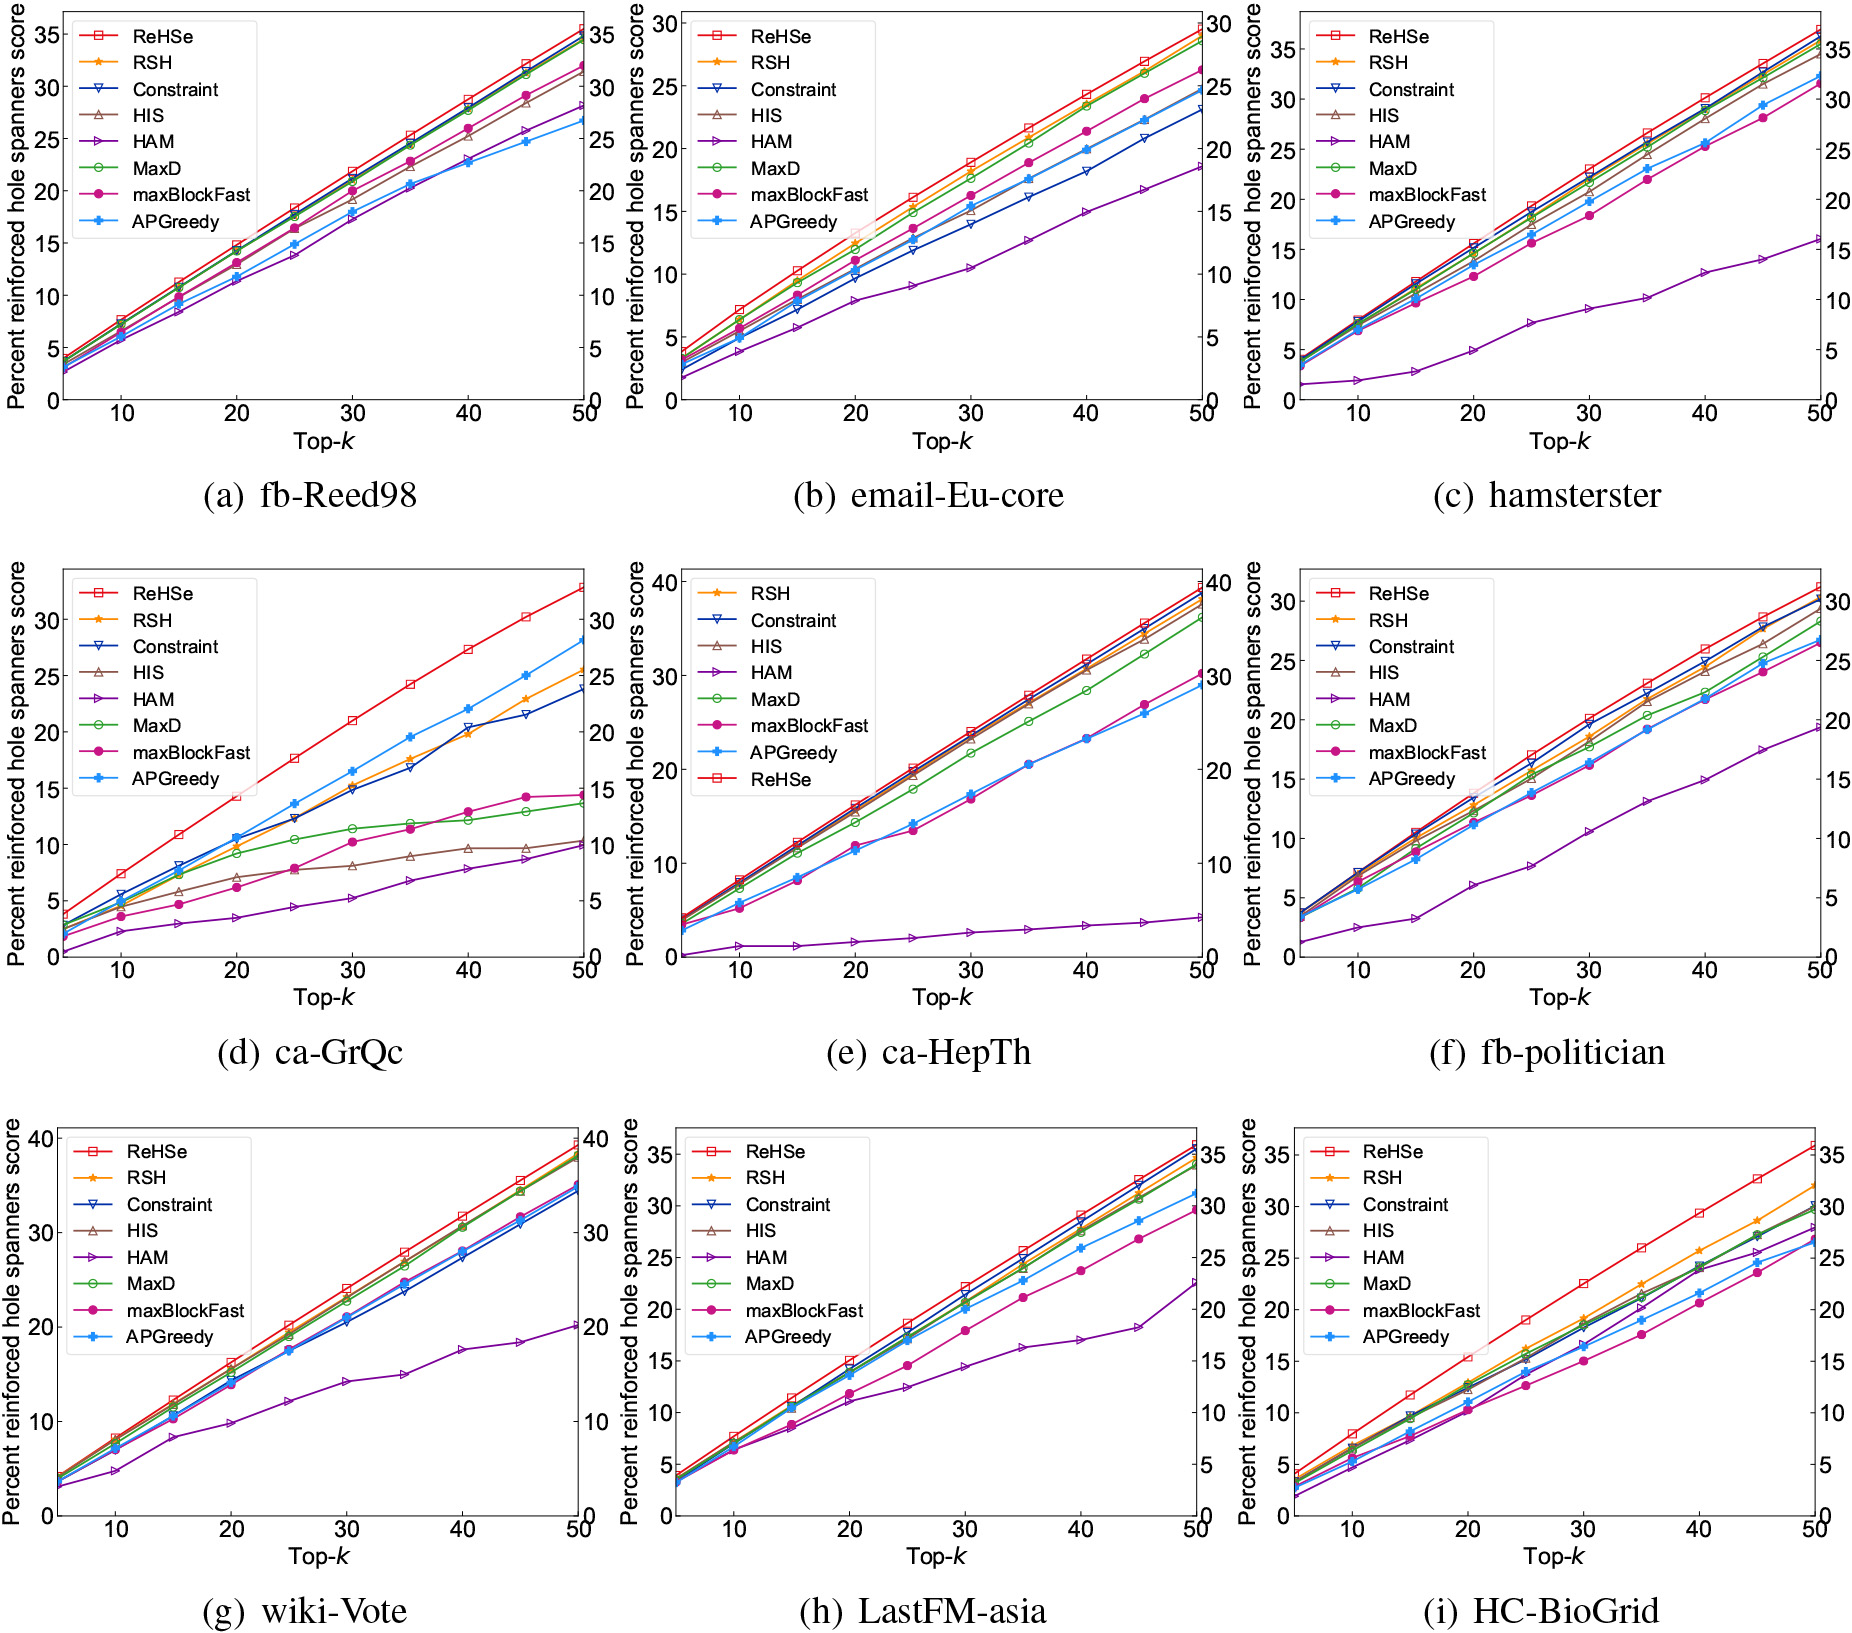
Percent reinforced hole spanners score of different methods in various networks.
We first investigate the Percent-RS of top- hole spanners identified by different methods in slightly smaller networks. It can be seen from Fig. 4a–c that ReHSe outperforms the other seven methods. Specifically, Fig. 4a shows that in the fb-Reed98 network, the Percent-RS of top-50 hole spanners identified by ReHSe is about 3% () higher than the best existing method RSH, which is almost identical to the results of methods Constraint and MaxD, and about 11% () higher than that of method maxBlockFast, where the Percent-RS of top-50 hole spanners found by methods ReHSe, RSH, Constraint, HIS, HAM, MaxD, maxBlockFast, and APGreedy are 29.1, 28.9, 23.1, 24.7, 18.5, 28.5, 26.2, 24.6, respectively. And Fig. 4b plots that method ReHSe exhibits similar performance in the email-Eu-core network as in the fb-Reed98 network. Moreover, Fig. 4c demonstrates that the Percent-RS of hole spanners found by ReHSe in the hamsterster network is about 3% and 2.3 () times higher than the existing best method Constraint and the poorest method HAM, when , respectively.
We then study the performance of the different methods in other six networks ca-GrQc, ca-HepTh, fb-politician, wiki-Vote, LastFM-asia and HC-BioGrid. Figure 4d–i plots that the advantages of hole spanners detected by the proposed method ReHSe are more visible in these relatively large networks, especially in networks ca-GrQc and HC-BioGrid. For example, Fig. 4d demonstrates that the Percent-RS of top-50 nodes found by method ReHSe in the ca-GrQc network is approximately 17% () and 29% higher than the best two existing methods APGreedy and RSH among the eight benchmark methods, respectively. Moreover, Fig. 4i shows that the Percent-RS of top-50 hole spanners detected by method ReHSe in the HC-BioGrid network is about 12% () and 20% higher than the best two methods RSH and Constraint, respectively.
In contrast, although the method RSH identifies spanners from the perspective of structural holes being reinforced by the spanners’ neighbors, its Percent-RS are lower than the proposed method ReHSe in all nine networks, because the method RSH focuses only on the reinforcement from two-step neighbors, while ReHSe can be extended to multi-order neighbors. On the other hand, the incremental strategy allows ReHSe to improve the accuracy of identification by preserving the structural features of nodes in different networks, thus detecting spanners that are connected to a larger number and more cohesive communities.
Structural hole influence index
Results of average SHII for different methods in various datasets under the independent cascade influence model
Comparative methods
Datasets
# of Hole spanners
ReHSe
RSH
Constraint
HIS
HAM
MaxD
maxBlockFast
APGreedy
Karate club
3
0.536
0.536
0.536
0.495
0.501
0.506
0.489
0.457
Hole spanners
[0, 33, 2]
[0, 33, 2]
[0, 33, 2]
[8, 13, 19]
[2, 19, 8]
[33, 0, 32]
[33, 32, 2]
[0, 1, 3]
Football
20
0.932
0.916
0.917
0.925
0.907
0.91
0.906
0.91
Email-Eu-core
50
0.963
0.967
0.958
0.961
0.956
0.968
0.955
0.959
Ca-GrQc
50
0.902
0.889
0.865
0.822
0.857
0.844
0.876
0.933
Ca-HepTh
50
0.862
0.821
0.81
0.83
0.771
0.879
0.846
0.907
Fb-Reed98
50
0.443
0.449
0.418
0.574
0.382
0.449
0.283
0.334
Fb-politician
50
0.914
0.842
0.871
0.855
0.773
0.901
0.819
0.85
Hamsterster
50
0.392
0.390
0.365
0.374
0.409
0.39
0.407
0.484
HC-BioGrid
50
0.964
0.919
0.921
0.921
0.953
0.923
0.926
0.911
LastFM-asia
50
0.942
0.91
0.9
0.914
0.867
0.912
0.938
0.896
wiki-Vote
50
0.837
0.818
0.809
0.822
0.878
0.836
0.813
0.756
Results of average SHII for different methods in various datasets under the linear threshold influence model
Comparative methods
Datasets
# of Hole spanners
ReHSe
RSH
Constraint
HIS
HAM
MaxD
maxBlockFast
APGreedy
Karate club
3
0.382
0.382
0.414
0.661
0.661
0.382
0.321
0.422
Football
20
0.343
0.329
0.341
0.367
0.288
0.299
0.267
0.285
Email-Eu-core
50
0.833
0.847
0.631
0.788
0.565
0.851
0.8
0.77
Ca-GrQc
50
0.668
0.522
0.509
0.397
0.650
0.404
0.377
0.411
Ca-HepTh
50
0.698
0.615
0.611
0.623
0.551
0.655
0.576
0.576
Fb-Reed98
50
0.427
0.433
0.403
0.536
0.337
0.432
0.257
0.3
Fb-politician
50
0.665
0.651
0.673
0.661
0.597
0.696
0.633
0.657
Hamsterster
50
0.292
0.293
0.268
0.281
0.301
0.290
0.308
0.368
HC-BioGrid
50
0.712
0.536
0.506
0.522
0.665
0.502
0.516
0.462
LastFM-asia
50
0.598
0.59
0.589
0.588
0.657
0.62
0.625
0.591
wiki-Vote
50
0.653
0.582
0.575
0.584
0.625
0.595
0.578
0.538
Tables 2 and 3 present the average structural hole influence index of each method in different networks under IC and LT models, respectively. We count the number of times each method achieves optimal results in a total of 22 evaluations across 11 networks, the results show that ReHSe leads 9 times, HIS and APGreedy lead 4 times, HAM and MaxD lead 3 times, RSH and Constraint lead 1 time, and maxBlockFast leads 0 time. It can be observed that the top- hole spanners found by ReHSe have a stronger influence on information propagation across communities, even compared to the methods HIS, HAM and MaxD which require ground-truth communities information, especially in relatively sparse networks. In addition, although the hole spanners detected by APGreedy have the best SHII in several networks, the Percent-RS of the hole spanners are lower in most networks.
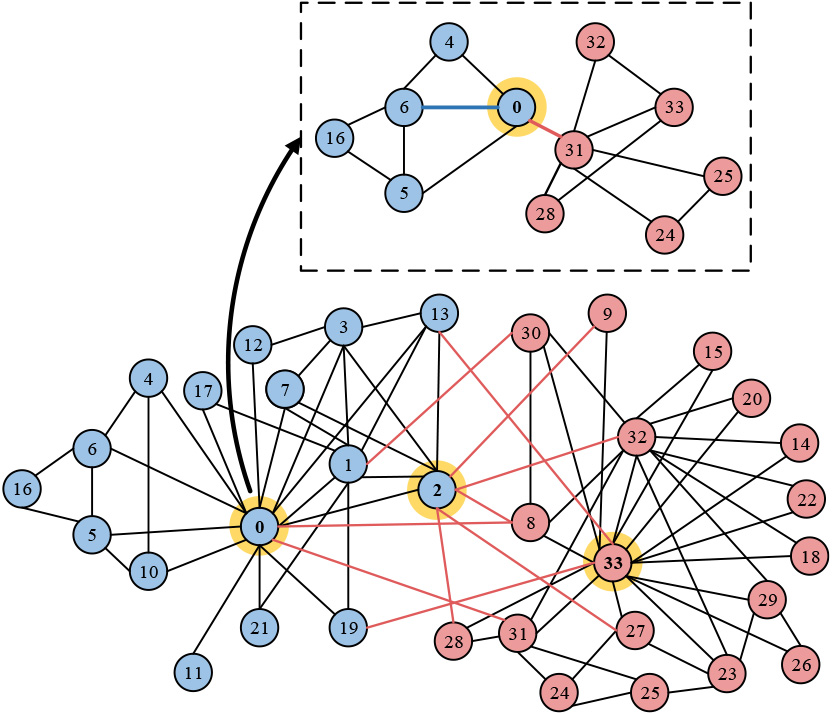
To be more intuitive, we plot the karate club network and label the top-3 hole spanners found by ReHSe, i.e., , see Fig. 5, and the top-3 spanners found by other methods are listed in Table 2. We can observe that ReHSe identifies nodes that not only connect with multiple communities, but also access to more reinforced structural holes. For example, we zoom in on a hole formed by nodes 6 and 31 from different communities bridged by node 0, and it can be seen from the subgraph that nodes 6 and 31 are closely connected with the members in their respective communities, which strengthens the bridge role of node 0. Moreover, although methods RSH and Constraint find the same top-3 spanners as ReHSe in the karate club network, the Percent-RS of spanners found by them are lower than ReHSe when takes larger values in other networks, see Fig. 4a–g, i.e., the top- spanners found by methods RSH and Constraint with less reinforcement in these networks.
A visualization of the karate club network, where the ground-truth communities are colored differently, and the shaded nodes are the top-3 hole spanners identified by ReHSe.
In summary, Fig. 4 and Tables 2 and 3 validate our claim in Section 1.2 that the top- hole spanners identified by the method ReHSe bridge a larger number of reinforced holes, such that more benefits (e.g., greater propagation influence) can be achieved, compared to other benchmark methods.
Ablation study
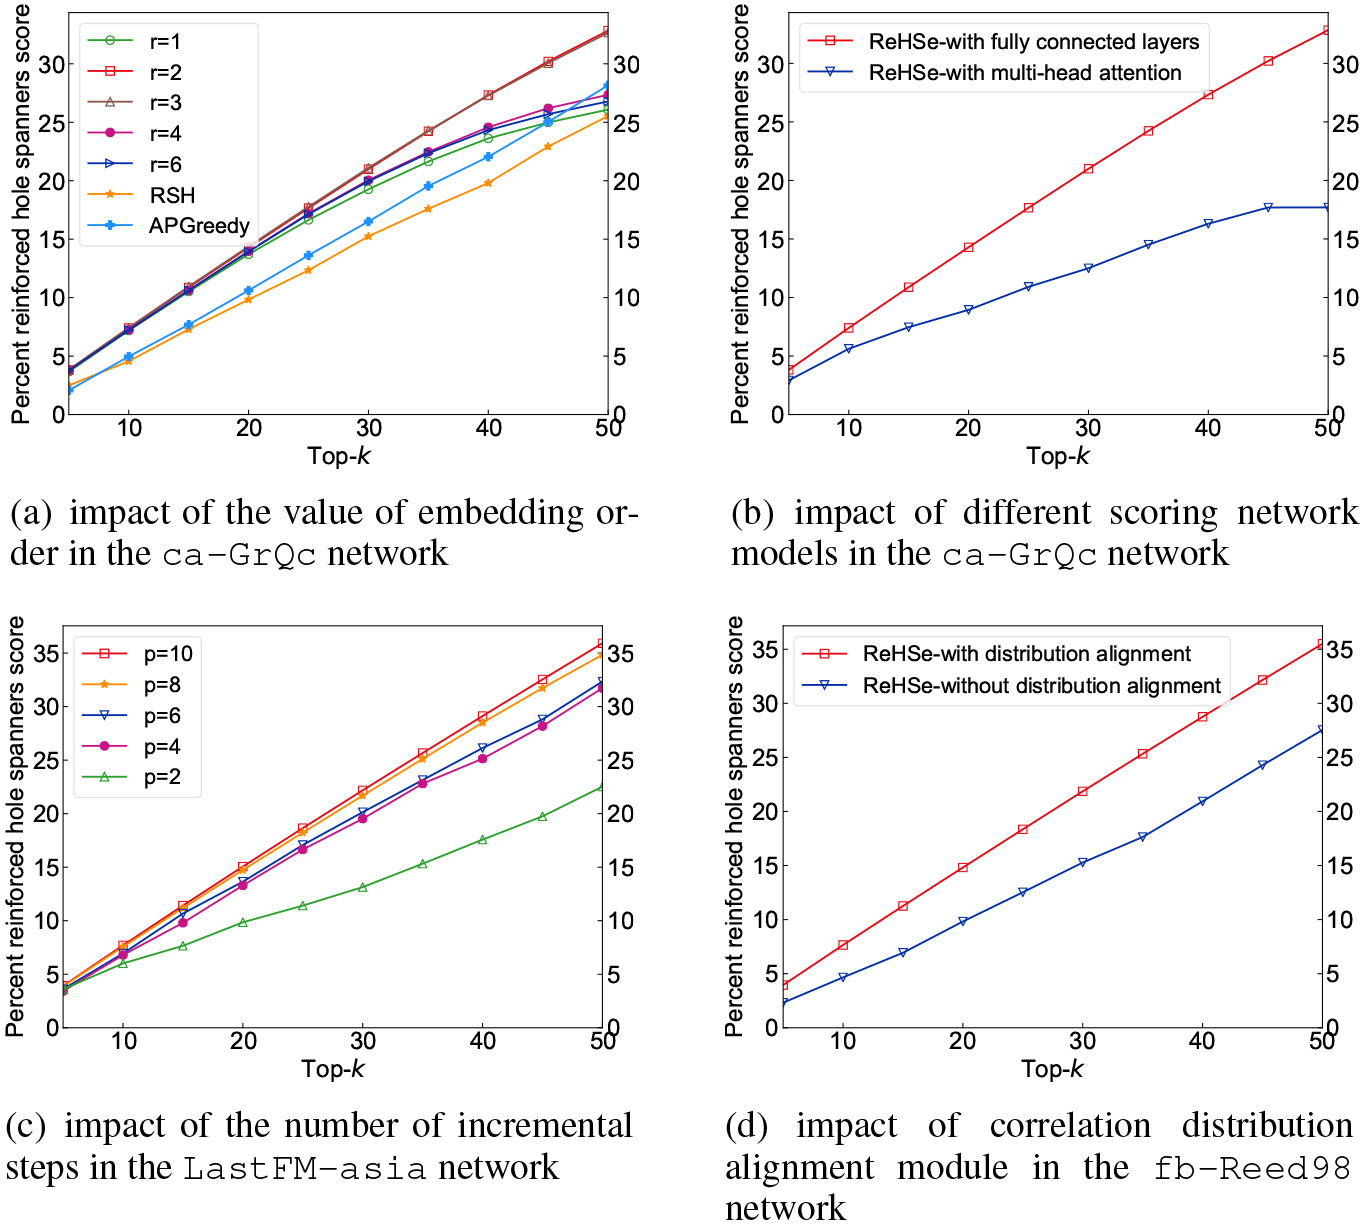
We now discuss the impacts of components on the proposed method ReHSe, including the value of embedding order , the scoring network model, the number of incremental steps, and the correlation alignment. We first investigate the effect of the value of embedding order on the model performance in the network ca-GrQc with . It can be observed from Fig. 6a that the Percent-RS of the top- hole spanners found by ReHSe are the highest and almost equal when and (i.e., each node with and ), among all values of the order . ReHSe has a lower Percent-RS of hole spanners identified with than that identified with , which may be due to the fact that the idea of ReHSe with is similar to the method Constraint, which measures the extent to which a user has access to many non-redundant neighbors, without considering the reinforcement information. Moreover, when and , although there may be lower Percent-RS due to the limitation of labeled data, they are still comparable to the best two existing methods APGreedy and RSH in the ca-GrQc network.
Ablation study on the performance of the proposed method ReHSe.
We then study the effect of different scoring models on performance in the ca-GrQc network. We compare two models: the model with fully connected layers, and the model with multi-head attention mechanism. It can be seen from Fig. 6b that the Percent-RS of the hole spanners found by training with a fully connected network is about 86% better than that of detected by training with the attention mechanism. The fully connected layers provide a simple way to capture dependencies of a node embedding vector on each of its components (i.e., -orders neighborhood relation embeddings at the corresponding positions). By contrast, although the multi-head attention mechanism helps to obtain richer features, it cannot capture the location information, i.e., the sequential relationship of the components in an embedding vector cannot be learned, thus leading to a performance drop in identification.
Furthermore, Fig. 6c demonstrates that the Percent-RS of the hole spanners identified by ReHSe increases with the number of training networks for incremental learning in the LastFM-asia network. The results validate our claim in Section 4.4 that ReHSe on the one hand adjusts the model parameters by introducing additional information from the new networks, and on the other hand, with the feature distribution changes, it updates the reserved set to continuously improve the accuracy of detecting spanners.
We finally analyze the role of correlation alignment on method ReHSe in the fb-Reed98 network. We reshape the embedding vectors of nodes into a two-dimensional space to observe the changes in the distribution covariances. Figure 7 plots the transformation of the distribution covariances of the training network fb-Reed98 (source) towards the test network football (target). We can see that although the initial source and target domains have different feature distributions, they can align well in the feature space after the transformation. Moreover, compared with the method without alignment, the performance of the identified spanners is improved by about 30% by aligning the training network toward the given test network first at each incremental step, see Fig. 6d.
An illustration of correlation alignment, where football with 115 nodes and 1,226 edges is taken as the test network, and fb-Reed98 with 962 nodes and 37,624 edges is regarded as the training network.
Conclusion
In this paper, we proposed a node embedding-based method ReHSe for identifying reinforced hole spanners in social networks that not only connect to multiple communities, but also access reinforced structural holes. Specifically, we first devised an integrated embedding method to extract features encoding the reinforcement properties of nodes into a low-dimensional space. To improve the robustness and accuracy of identification, we then employed an incremental learning strategy based on a reserved set to train a reinforcement scoring network in this subspace, to find top- reinforced structural hole spanners. We finally evaluated the performance of the proposed method on eleven real-world datasets. The results showed that the reinforced score of the top- hole spanners found by ReHSe is about 17% higher than that by existing methods.
The theory of structural holes is an important concept for social network analysis, which indicates the social advantages of individuals. In the future, it is a worthwhile work to further improve the proposed method in this paper, for example, the method ReHSe will suffer from expensive computational and intensive memory costs in large-scale social networks with millions of nodes due to matrix operations, or even inapplicable. In addition, ReHSe only utilizes the network topology to detect hole spanners, and how to introduce the social behavior features of users into ReHSe is also an interesting research point. Moreover, the study of novel methods for identifying hole spanners in dynamic networks would also be of great interest.
Footnotes
Acknowledgments
The work by Feihu Huang was supported by Sichuan Science and Technology Program with grant number 22ZDYF3599. The work by Jian Peng was supported by the National Key Research and Development Program of China with grant number 2020YFB0704502.
References
1.
BelkinM. and NiyogiP., Laplacian eigenmaps for dimensionality reduction and data representation, Neural Comput15(6) (2003), 1373–1396.
2.
BurtR.S., Structural holes: the social structure of competition, Harvard university press, Cambridge, 1992.
3.
BurtR.S., Structural holes and good ideas, Am. J. Sociol110(2) (2004), 349–399.
BurtR.S. and WangS., Bridge supervision: Correlates of a boss on the far side of a structural hole, Acad. Manage. J (2021), published online, doi: 10.5465/amj.2021.0676.
6.
BatageljV. and ZaversnikM., An algorithm for cores decomposition of networks, cs.DS/0310, 2003.
7.
CastroF.M.Marín-JiménezM.J.GuilN.SchmidC. and AlahariK., End-to-end incremental learning, in: Proceedings of the European Conference on Computer Vision (ECCV), 2018, pp. 233–248.
8.
CaoS.LuW. and XuQ., Deep neural networks for learning graph representations, in: Proceedings of the AAAI Conference on Artificial Intelligence (AAAI), Vol. 30, 2016, pp. 1145–1152.
9.
ChenY.XiongY.LiuB. and YinX., TranGAN: Generative adversarial network based transfer learning for social tie prediction, in: IEEE International Conference on Communications (ICC), 2019, pp. 1–6.
10.
DongS.HongX.TaoX.ChangX.WeiX. and GongY., Few-shot class-incremental learning via relation knowledge distillation, in: Proceedings of the AAAI Conference on Artificial Intelligence (AAAI), Vol. 35, 2021, pp. 1255–1263.
11.
DongY.ChawlaN.V. and SwamiA., metapath2vec: Scalable representation learning for heterogeneous networks, in: Proceedings of the 23rd ACM SIGKDD International Conference on Knowledge Discovery and Data Mining (KDD), 2017, pp. 135–144.
12.
GroverA. and LeskovecJ., Node2vec: Scalable feature learning for networks, in: Proceedings of the 22nd ACM SIGKDD International Conference on Knowledge Discovery and Data Mining (KDD), 2016, pp. 855–864.
13.
GhaffarF.BudaT.S.AssemH.AfsharinejadA. and HurleyN., A framework for enterprise social network assessment and weak ties recommendation, in: IEEE/ACM International Conference on Advances in Social Networks Analysis and Mining (ASONAM), 2018, pp. 678–685.
14.
GhaffarF. and HurleyN., Modelling social capital: the structural hole connections game, in: Proceedings of the 2021 IEEE/ACM International Conference on Advances in Social Networks Analysis and Mining (ASONAM), 2021, pp. 9–13.
15.
GoyalS. and Vega-RedondoF., Structural holes in social networks, J. Econ. Theory137(1) (2007), 460–492.
16.
HeL.LuC.MaJ.CaoJ.ShenL. and YuP.S., Joint community and structural hole spanner detection via harmonic modularity. in: Proceedings of the 22nd ACM SIGKDD International Conference on Knowledge Discovery and Data Mining (KDD), 2016, pp. 875–884.
17.
JiangF.HeL.ZhengY.ZhuE.XuJ. and YuP.S., On spectral graph embedding: a non-backtracking perspective and graph approximation. in: Proceedings of the 2018 SIAM International Conference on Data Mining (SDM), 2018, pp. 324–332.
18.
KrizhevskyA.SutskeverI. and HintonG.E., ImageNet classification with deep convolutional neural networks, Commun. ACM60(6) (2017), 84–90.
19.
LeskovecJ. and KrevlA., SNAP Datasets: Stanford Large Network Dataset Collection, 2014. http://snap.stanford.edu/data.
20.
LuoJ. and DuY., Detecting community structure and structural hole spanner simultaneously by using graph convolutional network based Auto-Encoder, Neurocomputing410 (2020), 138–150.
21.
LeriqueS.AbitbolJ.L. and KarsaiM., Joint embedding of structure and features via graph convolutional networks, Appl. Netw. Sci.5(1) (2020), 1–24.
22.
LouT. and TangJ., Mining structural hole spanners through information diffusion in social networks, in: Proceedings of the 22nd International Conference on World Wide Web (WWW), 2013, pp. 825–836.
23.
LinZ.ZhangY.GongQ.ChenY.OksanenA. and DingA.Y., Structural hole theory in social network analysis: A review, IEEE Trans. Comput. Soc. Syst. (2021), 1–16.
24.
MikolovT.ChenK.CorradoG. and DeanJ., Efficient estimation of word representations in vector space, in: Proceedings of the 1st International Conference on Learning Representations (ICLR), 2013.
25.
PerozziB.Al-RfouR. and SkienaS., Deepwalk: Online learning of social representations, in: Proceedings of the 20nd ACM SIGKDD International Conference on Knowledge Discovery and Data Mining (KDD), 2014, pp. 701–710.
26.
RossiR. and AhmedN., The network data repository with interactive graph analytics and visualization, in: Proceedings of the AAAI Conference on Artificial Intelligence (AAAI), 2015, pp. 4292–4293.
27.
SunB.FengJ. and SaenkoK., Return of frustratingly easy domain adaptation, in: Proceedings of the AAAI Conference on Artificial Intelligence (AAAI), 2016, pp. 2058–2065.
28.
StarkC.BreitkreutzB.J.RegulyT.BoucherL.BreitkreutzA. and TyersM., BioGRID: A general repository for interaction datasets, Nucleic Acids Res.34(1) (2006), D535–D539.
29.
TangJ.LouT.KleinbergJ. and WuS., Transfer learning to infer social ties across heterogeneous networks, ACM Trans. Inf. Syst.34(2) (2016), 1–43.
30.
TenenbaumJ.B.SilvaV.D. and LangfordJ.C., A global geometric framework for nonlinear dimensionality reduction, Science290(5500) (2020), 2319–2323.
31.
VosoughiS.RoyD. and AralS., The spread of true and false news online, Science359(6380) (2018), 1146–1151.
32.
WangD.CuiP. and ZhuW., Structural deep network embedding, in: Proceedings of the 22nd ACM SIGKDD International Conference on Knowledge Discovery and Data Mining (KDD), 2016, pp. 1225–1234.
33.
WangH.WangJ.WangJ.ZhaoM.ZhangW.ZhangF.LiW.XieX. and GuoM., Learning graph representation with generative adversarial nets, IEEE Trans. Knowl. Data Eng. (TKDE)33(8) (2019), 3090–3103.
34.
WuY.ChenY.WangL.YeY.LiuZ.GuoY. and FuY., Large scale incremental learning, in: Proceedings of the IEEE Conference on Computer Vision and Pattern Recognition (CVPR), 2019, pp. 374–382.
35.
XuM., Understanding graph embedding methods and their applications, SIAM Review63(4) (2021), 825–853.
36.
XuW.RezvaniM.LiangW.YuJ.X. and LiuC., Efficient algorithms for the identification of top-k structural hole spanners in large social networks, IEEE Trans. Knowl. Data Eng. (TKDE)29(5) (2017), 1017–1030.
37.
XuW.LiT.LiangW.YuJ.X.YangN. and GaoS., Identifying structural hole spanners to maximally block information propagation, Inf. Sci.505 (2019), 100–126.
38.
YangR.ShiJ.XiaoX.YangY. and BhowmickS.S., Homogeneous network embedding for massive graphs via reweighted personalized PageRank, Proc. VLDB Endow.13(5) (2020), 670–683.
39.
YuZ.LuS.WangD. and LiZ., Modeling and analysis of rumor propagation in social networks, Inf. Sci.580 (2021), 857–873.
40.
ZhangX.XieK.WangS. and HuangZ., Learning based proximity matrix factorization for node embedding, in: Proceedings of the 27th ACM SIGKDD Conference on Knowledge Discovery and Data Mining (KDD), 2021, pp. 2243–2253.
41.
ZhaoZ.ZhouH.LiC.TangJ. and ZengQ., DeepEmLAN: Deep embedding learning for attributed networks, Inf. Sci.543 (2021), 382–397.