
Abstract
When building a performing one-class classifier, the low variance direction of the training data set might provide important information. The low variance direction of the training data set improves the Covariance-guided One-Class Support Vector Machine (COSVM), resulting in better accuracy. However, this classifier does not use data dispersion in the one class. It explicitly does not make use of target class subclass information. As a solution, we propose Scatter Covariance-guided One-Class Support Vector Machine, a novel variation of the COSVM classifier (SC-OSVM). In the kernel space, our approach makes use of subclass information to jointly decrease dispersion. Our algorithm technique is even based on a convex optimization problem that can be efficiently solved using standard numerical methods. A comparison of artificial and real-world data sets shows that SC-OSVM provides more efficient and robust solutions than normal COSVM and other contemporary one-class classifiers.
Keywords
Introduction
The identification of “abnormal” instances or events in data sets is the focus of the majority of machine learning challenges. This technique is also known as outlier detection or anomaly detection. Machine Learning may be used in both supervised and unsupervised procedures. The unsupervised procedure is performed on unlabeled data and is only concerned with the subjective structure of data sets. This problem is addressed in a variety of practical domains: To analyze medical pictures in the life sciences area, for example, to discover aberrant cells or tumors. Another well-known anomaly detection application is fraud detection. As a result of the rise in digital products and online payment methods. Network intrusion detection is a critical application for monitoring server and network traffic. In this domain, traditional multi-class (or binary) classification algorithms pre-define two (or more) categories to categorize an unknown item. When the unknown item does not fit into any of those categories, the disadvantages of this sort of classifier become apparent. Many real-world issues, such as tumor identification or uncommon medical illnesses, provide a limited amount of such noisy data throughout the training phase [20]. Measurements Normal nuclear power plant operations (normal/target) data are possible. On the other hand, in the event of an accident, measuring the (abnormal/outlier) data is extremely risky [16]. In robust machine learning applications, one-class classification has been widely used. During the training phase, there is just one class (positive/target). For the other class (negative/outliers), it is either a poor representation of a representative sample or a very small distribution. A one-class classifier’s aim during testing is to identify the optimum separation of target and outlier data. For these reasons, the One-class classification issue has a variety of applications, including medical analysis [11], anomaly detection [35], face recognition [42], and web page categorization [30]. When the data boundary is concave and lengthy, the required number of training items may be quite large. Boundary-based techniques employed just boundary points surrounding the target class, such as the One-Class Support Vector Machine (OSVM) [32] or Support Vector Data Description (SVDD) [31]. A more practical algorithm would be to combine the maximum margin criteria with data spread control [7].
The performance of most classification algorithms is highly influenced by certain characteristics of the data set being modeled, class distribution imbalance, class overlap, lack of density, etc. An OKC classifier [3] has been proposed. It is a hybrid of the one-class SVM, k-nearest neighbors, and CART algorithms. This algorithm is sketched to the extent that it might work with the classification of non-linearly separable imbalanced datasets with no need for re-sampling. In [2], a new personalized federated learning method based on One-Class Support Vector Machine (FedP-OCSVM) to overcome the privacy and transmission issues stalled by the core machine learning model, and use it from various datasets.Then, compute the resulting support vectors for each data set collected. A device or sensor is used to train a local model (client). Unlike multi-class classification tasks, one-class classification necessitates low variance directions of the target class distribution. To tackle this challenge, the Covariance-guided One-Class Support Vector Machine (COSVM) [17] method incorporates the covariance matrix into the objective function of OSVM, which emphasizes low variance paths. This method has proven effective in reducing estimation error and enhancing classification performance. Nevertheless, in real-world scenarios, when the data is widely spread, and sub-classes arise within the training class, the COSVM method has some limitations. To overcome these limitations, several classifiers have recently utilized subclass information to advance their methods’ performance.
In the OSVM objective function, the Subclass One-Class Support Vector Machine (SOC-SVM) [24] introduces within-subclass dispersion of the training data. The results of the experiments illustrate the benefits of the video summarizing approach (SOC-SVM). The Kernel Support Vector Description (KSVDD) [25] method modifies the optimization process in feature spaces of any dimensions. An application on face recognition and human action recognition problems shows that KSVDD outperforms the OSVM, standard SVDD, and the minimum variance SVDD (MV-SVDD) [29]. Robust least squares one-class support vector machine (RLS-OCSVM) [40] possesses better robustness and generalization ability in comparison with its related methods. The novel robust LS-OCSVM based on correntropy loss function to efficiently reduce the effect of outliers. Moreover, the half-quadratic optimization technique is utilized to solve the optimization problem of the proposed robust LS-OCSVM. However, the performance of the proposed robust SC-OCSVM depends on the value of its scale constant
In this work, we present Scatter-Covariance OSVM (SC-OSVM), inspired by [28] that uses subclass information and includes the between and within scatter matrix into the COSVM’s objective function. In this work, first we divided the target class into subclass. Second, we calculate the between and within scatter matrix. Then, we optimize the COSVM’s objective function by incorporate the between and within scatter matrix to provide the best classification accuracy. Unlike the SOC-SVM and KSVDD techniques, the SC-OSVM method has the benefit of reducing not just scattering data inside each subclass but also scattering data between subclasses to improve classification performance. Furthermore, the SC-OSVM uses the trade-off parameter to regulate the contribution of our scatter matrix
The remainder of the paper is structured as follows: The next section present an overview. Section 3 gives more details on a new subclass method based on COSVM. Section 4 compares our technique to existing state-of-the-art applicable one-class classifiers on a variety of common datasets. Finally, Section 5 includes some closing thoughts.
Overview
We detail the related work to One-Class Classification and the influence of low variance direction in this part. We also define the clustering algorithms.
One-class classification
In the issue of one-class classification (OCC) [19] , positive training samples, known as targets, must be differentiated from all other negative items, known as outliers.
Only positive examples are relevant to Learning. Measurements on the normal operating conditions of a nuclear power station, for example, are simple to collect. In the event of an accident, the same characteristics will be dangerous to measure. Positive examples and a small number of poorly dispersed negative examples relevant to learning. This is most noticeable in tumor identification or uncommon medical conditions, when there is a limitation of negative training examples Positive and unlabeled data are used for learning. This category has sparked a lot of research interest among the document classification community, and there are always unlabeled samples accessible.
A vast variety of algorithms have been created, as well as numerous real models, to solve OCC problems. These approaches are classified into three types: density-based methods, boundary-based methods, and reconstruction-based methods.
The separation between target objects and outliers is based on a clear representation of the data. Principal Component Analysis (PCA) pre-processing is a key approach for decreasing dimensionality in data by removing low variance directions and retaining only high variance directions. [19] shown that in one-class classification, low-variance directions are the most descriptive, while high-variance directions are not always the best option. Many one-class classifiers focus on data scaling and are often damaged by data distributions in (irregular) subspaces. If the data is not linearly separable in the original (input) space, we converted it into a higher dimensional feature space (the kernel feature space), which is robust to large-scale variations in the scaling of the input data. The one-class classification based on Kernel space is a particular type of classification problem that is often utilized as an outlier detection and novelty detection approach. Tax and Duin [34] and Scholkopf et al. [32] created the support vector machine (SVM) technique to optimize the distance margin between the two analyzed classes using support vector. It has also been used in the OCC problem as OSVM [1] and SVDD [7]. The basic concept underlying these techniques is to create a judgment boundary around the target data in order to distinguish outliers (non-positives) from positive data.
Clustering algorithm
Clustering is an unsupervised classification method in which no data set learning is possible. Clustering’s primary task is to discover the distribution of patterns and relevant correlations in big data sets by assigning similar data to the same group known as a cluster. There are several clustering applications in a variety of disciplines, such market segmentation [37] and document classification [21]. Clustering’s two key difficulties are identifying comparable items to the same group and detecting overlapping structures and non-linearly-separable clusters [27]. The evaluation of clustering, also known as cluster validity, is a critical procedure for determining the right number of clusters in a data collection. The aim of cluster validity [13] is to find the ideal number of clusters C (optimal C clusters) that can more successfully validate the best description of the data structure using the validity function.Fuzzy clustering has been extensively studied and applied in a wide range of critical areas. Furthermore, fuzzy cluster validation is critical in fuzzy clustering. There are several cluster validity indices of fuzzy clustering in the clustering literature. For these reasons, determining a clustering method and validity index that provides the optimal grouping of our data is a critical challenge.
The novel scatter-covariance OSVM
In this part, we will go through our suggested algorithm in further details. We begin by introducing the COSVM method, which incorporates the target class’s estimated covariance matrix to favor low variance directions.
The COSVM method
The training data’s calculated covariance matrix covers all projectional directions, from low variance to high variance. incorporates the kernel covariance matrix into the objective function of the OSVM optimization problem to maintain the robustness of the OSVM classifier while emphasizing the low variance directions Using the kernel technique, the convex optimization issue of the COSVM method may be described as follows:
where
For clarity, we have used the vectorized form of
SC-OSVM considers subclass distribution to give more efficient and robust solutions than standard COSVM. The SC-OSVM takes into account the subclass distribution in order to provide more efficient and robust solutions than standard COSVM. The whole approach is founded on projecting the
We calculated the kernel covariance matrix
When
Where
Using this definition, we incorporate the within subclass and between subclass scatter matrices as an additional
By using the definitions of
This form of kernel covariance matrix
Using this definition, the between scatter matrix
Hence, our target term to incorporate into the COSVM dual problem is:
With this replacement, our proposed SC-OSVM method can be described by the optimization problem defined in Eq. (3.2).
Because both the kernel matrix
The balance between the dispersion matrix and the Kernel matrix, on the other hand, is controlled by our control parameter
Case 1: Schematic depiction of the decision hyperplane for SC-OSVM when the optimal linear projection would be along the direction of high variance. In this case, the optimal control parameter value for SC-OSVM is 
Case 2: Schematic depiction of the decision hyperplane for SC-OSVM when the optimal linear projection would be along the direction of low variance. In this case, the optimal control parameter value for SC-OSVM is 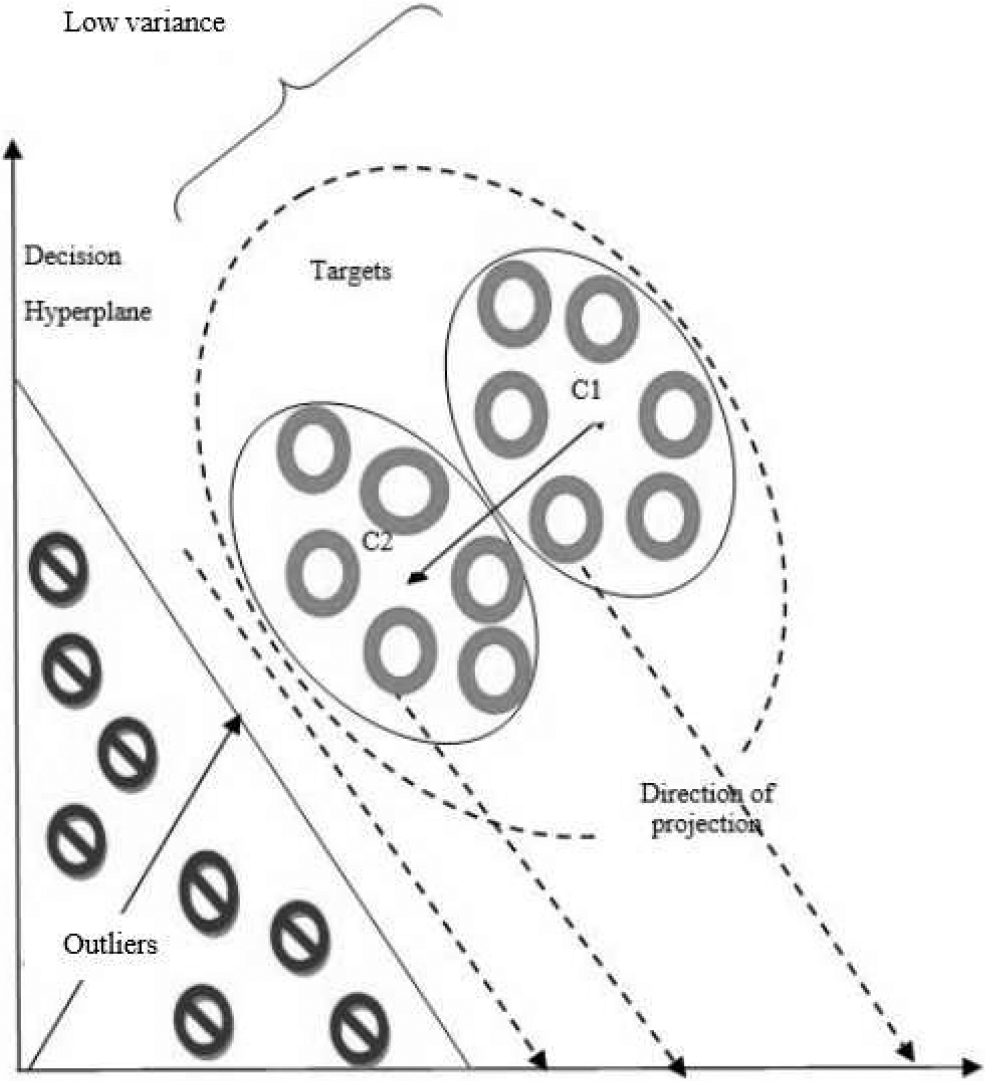
Comparison between COSVM and SC-OSVM : The value of the trade-off parameter is set equal to 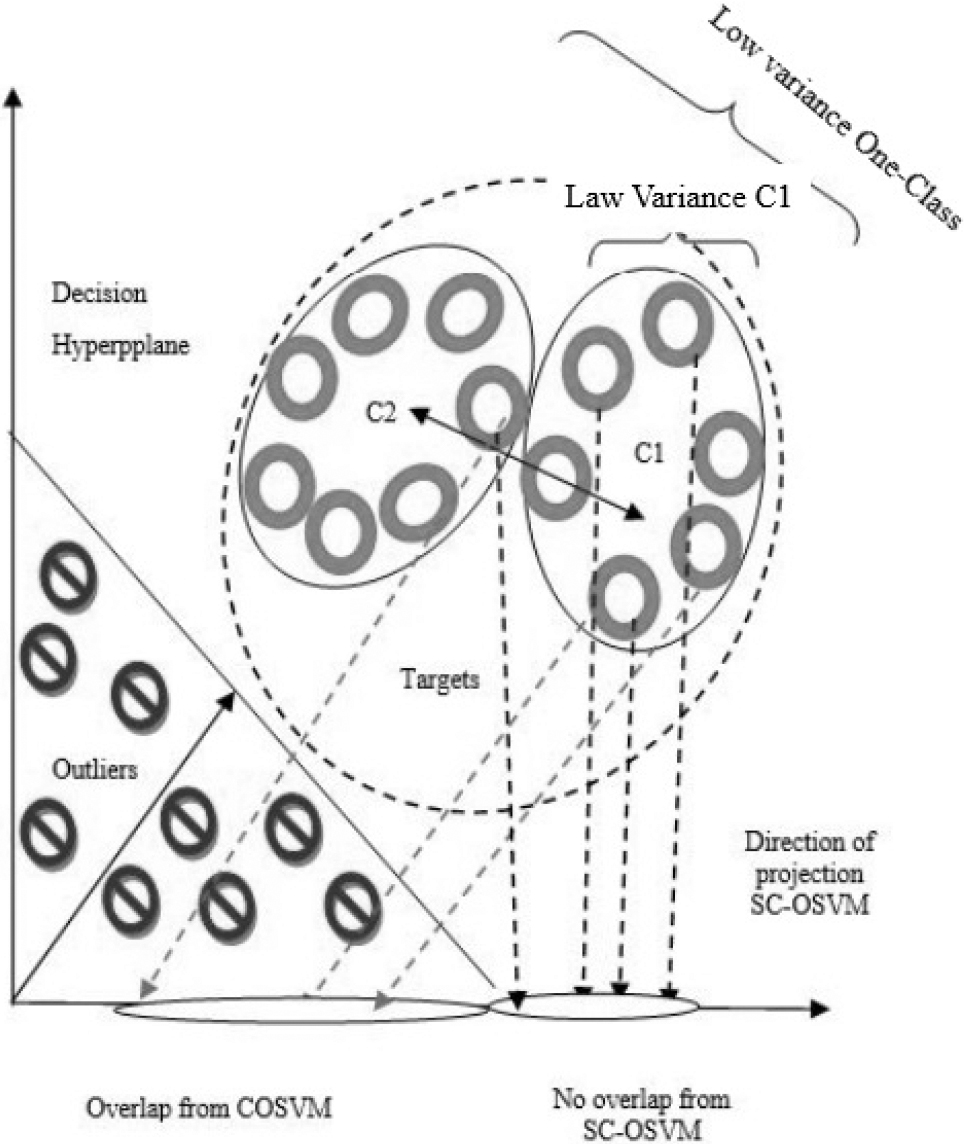
Finding the right value for
Schematic depictions
In this section, Fig. 3 presents graphic drawings to demonstrate the benefit of our SC-OSVM technique over the unimodal COSVM.
Experimental results
This section provides a thorough experimental analysis and findings for our proposed approach, which was tested on both artificial and benchmark real-world one-class datasets and compared to contemporary one-class classifiers. First, we examine the impact of varying the value of our main control parameter
Optimising the value of
First, we must optimize our key control parameter
Data sets used
In our studies, we employed both artificially generated datasets and real-world datasets to evaluate the robustness of our suggested approach in varying situations.
Artificially dataset
We constructed various sets of
Four artificial four-class datasets used for comparison. The blue class represents the target class (in each subfigure caption).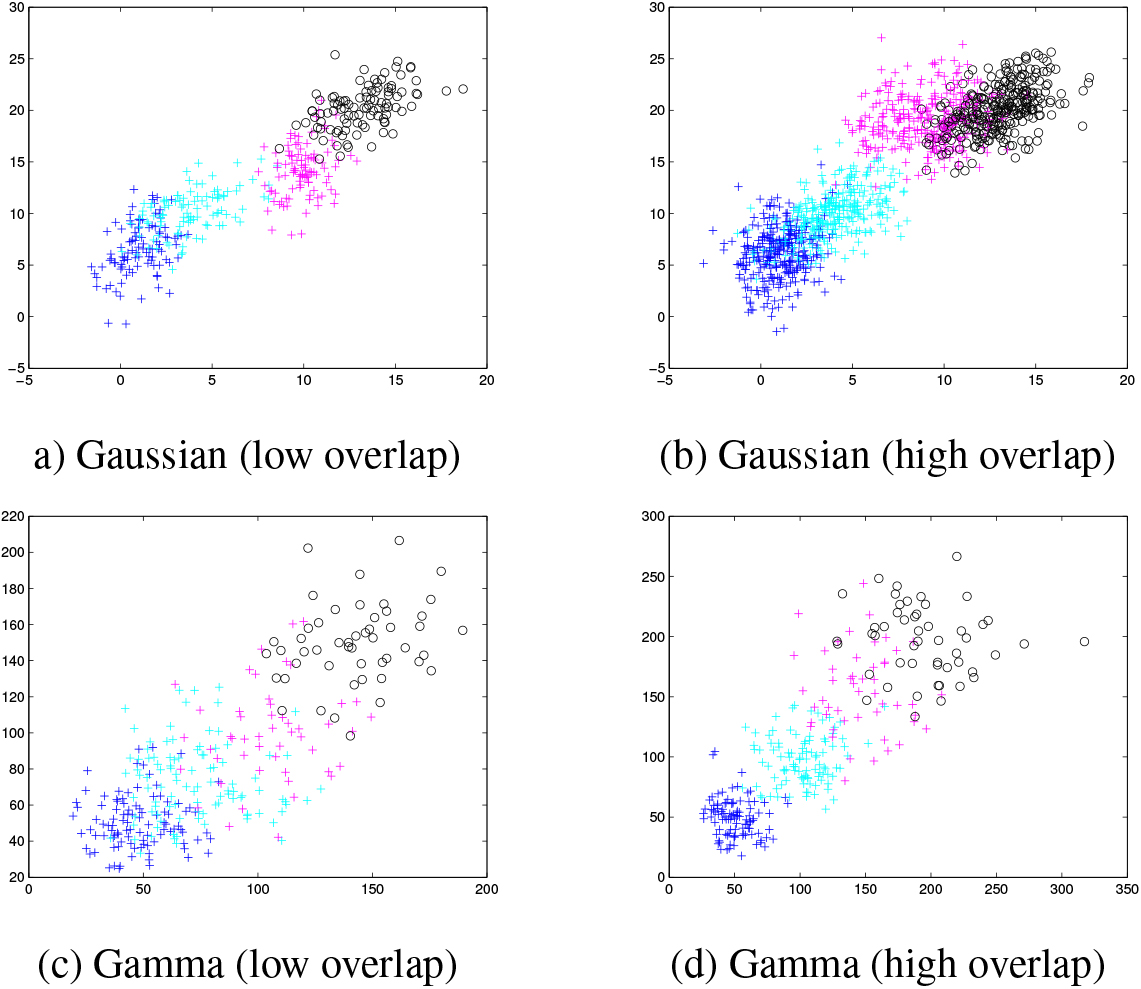
For the real-world scenario, the majority of these datasets were obtained from the UCI machine learning library [4]. We have mainly focused on one of the most significant domains of one-class classification, medical diagnosis [10]. As these datasets were initially multi-class, one class is identified as the target and the others as outliers. Some of the target and outlier sets were too simple to categorize. We did not include those sets in our results. We also tested the robustness of our technique against varied feature sizes by using data sets of varying size and dimensions. Table 1 shows that the dimensions range from
Description of real data sets
Description of real data sets
The TON-IoT network dataset has 223,390,21 records of normal and attacks data. The dataset has 461,043 records collected from the entire network dataset to include all the attacks and normal events (300,000 normal and 161,043 attack). These records can be used to apply different machine learning models and handle the challenge of imbalanced normal and attack records that are usually challenging. This challenge refers to that the number of normal records is too much greater than abnormal ones. Since the TON-IoT network dataset has a large number of attributes and different attribute types, such as categorical and numeric ones, it demands filter it demands filtering and processing the attributes to improve the performances of machine learning techniques. The total number of features (without pre-processing) is 43 features. And the total number of clusters using VSC as a validity index and K-means is 4 or 5 clusters.
The area under an ROC curve
Performance measurement is a fundamental role in Machine Learning, particularly in the classification problem. The receiver operating characteristic (ROC) curve is commonly used in medical applications and research to evaluate diagnostic testing [36]. The ROC curve is defined as a plot of the true positive rate (TPR) on the vertical axis and the false positive rate (FPR) on the horizontal axis over all possible decision thresholds or stoppages. The TPR is the proportion of cases with the disease who test positive for it based on the diagnostic test, whereas the FPR is the proportion of cases without the disease who test positive for it based on the same diagnostic test. This curve is important in evaluating the diagnostic competence of tests to differentiate the real condition of subjects, identify the best cut off values, and analyze two alternative diagnostic tasks when each task is done on the same subject. The Area under the Curve (AUC) is an effective method for assessing the effectiveness of rate classifiers since its prediction is based on the whole ROC curve and thus includes all potential classification levels.
SC-OSVM method algorithm
Algorithm 4.4 outlines the proposed SC-OSVM method. The algorithm begins by partitioning the training dataset
SC-OSVM method algorithm
Let Estimate the dual covariance matrix Calculate the between Incorporate the within subclass and between subclass scatter matrices as an additional Apply COSVM method for all data and find the trade-off parameter Uses the trade-off parameter SC-OSVM training and testing.
SC-OSVM performance was compared to Covariance guided One-class SVM (COSVM), One-class SVM (OSVM), Support Vector Data Description (SVDD),
Classifiers
All classifiers in this study are defined in the Matlab toolbox DDtools [33]. Our suggested approach was tested against the following seven established classifiers:
Gaussian [8] These classifiers, as the name indicates, represent the target data with a single Gaussian density and utilize maximum likelihood estimation for the mean and covariance matrix. For high dimensional data, a regularization term is frequently added to the covariance matrix. This classifier does not require any parameters to be tuned. Parzen [23] The Parzen density estimation approach, also known as the kernel density estimation technique. The Gaussian kernel is frequently used to measure the probability density of training data. The kernel width is determined by maximizing the probability of the training set using a leave-one-out approach. K Nearest Neighbors (K-NN) [15] This method determines if an incoming data point belongs to the target class or the outliers using the distance metric from the Support Vector Data Description (SVDD) [41] The Support Vector Data Description (SVDD) is a boundary-based one-class classifier that helps to describe the hypersphere with the smallest volume surrounding the training data points. This classifier can also benefit from the kernel technique. One-class SVM (OSVM) [16] The major difference between OSVM and SVDD is that SVDD estimates the boundary around the training data set using a hypersphere, whereas OSVM looks for the greatest margin hyperplane that separates the training data set from the origin. SVM with two classes. In OSVM, the origin is regarded as the sole member of the second class. One-Class Neural Network (OC-NN) [6] It is one-class classifier, which consists of feed forward neural network and the one-class SVM. Covariance guided One-class SVM (COSVM) [17] This classifier is explained in depth in Section 3.1. It is a modification of the original OSVM method that incorporates the covariance matrix into the OSVM objective function to emphasize low variance directions
DDtools was used to implement the k-NN, Parzen, Gaussian, and SVDD classifiers [33]. The SVM-KM toolkit was used to implement OSVM, COSVM, and SC-OSVM [39]. Kernelization in SVDD, OSVM, COSVM, and SC-OSVM employed the radial basis kernel. For these classifiers, the kernel width parameter
Average FPR for a fixed TPR to
Average FPR for a fixed TPR to
Our proposed algorithm was evaluated by using several criteria, such as accuracy and true-false positive rates. True positive rate (TPR) indicate the correctness classification for a record type. False positive rate (FPR) classifies a record as anomalous when such record is legitimate. Tables 2 and 3 show the FPR values for a fixed TPR to
Average AUC of each method for the
real-world data sets (best method in bold , second best emphasized)
Average AUC of each method for the
Average AUC of each method for the
Average AUC of OSVM, COSVM and SC-OSVM for the Train-test-Network (best method in
The average AUC values achieved for the classifiers on the artificial and real data sets are stored in Tables 5, Table 6 and Table 4. As we can see, the SC-OSVM outperforms all other classifiers and produces the best results on almost all data sets in terms of unbiased AUC values derived by averaging over
Using these performance metrics, we can confirm that our proposed emphasizing low variance directions improves the classification accuracy, since all the classes seem to be recognized fairly well.
In terms of training computational complexity, the SC-OSVM is nearly as complex as the COSVM. In fact, the dual kernel covariance matrix may be computed during pre-processing and reused throughout the training phase. The SC-OSVM technique solves the quadratic programming problem using sequential minimum optimization and hence scalable with
Table 7 shows the average training times, in milliseconds, for various algorithms used in the experiments on both artificial and real-world datasets. As expected, SC-OSVM has similar training times as COSVM. The training times for the other algorithms, such as K-NN, Parzen, Gaussian, SVDD, OSVM, and OC-NN, are also listed in the table. The training times of K-NN, Gaussian, and Parzen are less than SC-OSVM for the artificial datasets because these three algorithms are not based on an iterative optimization process process. K-NN, Gaussian, and Parzen have closed-form solutions that can be computed efficiently, while SC-OSVM requires an iterative optimization process, which can be time-consuming. However, for the real-world datasets, SC-OSVM has comparable training times to K-NN, Gaussian, and Parzen, indicating that the iterative optimization process does not significantly affect the training times in this case.
Average training times in milliseconds of different algorithms for the experiments on the artificial and real-world datasets
ROC curves of each classifiers for the data set SPECT (normal).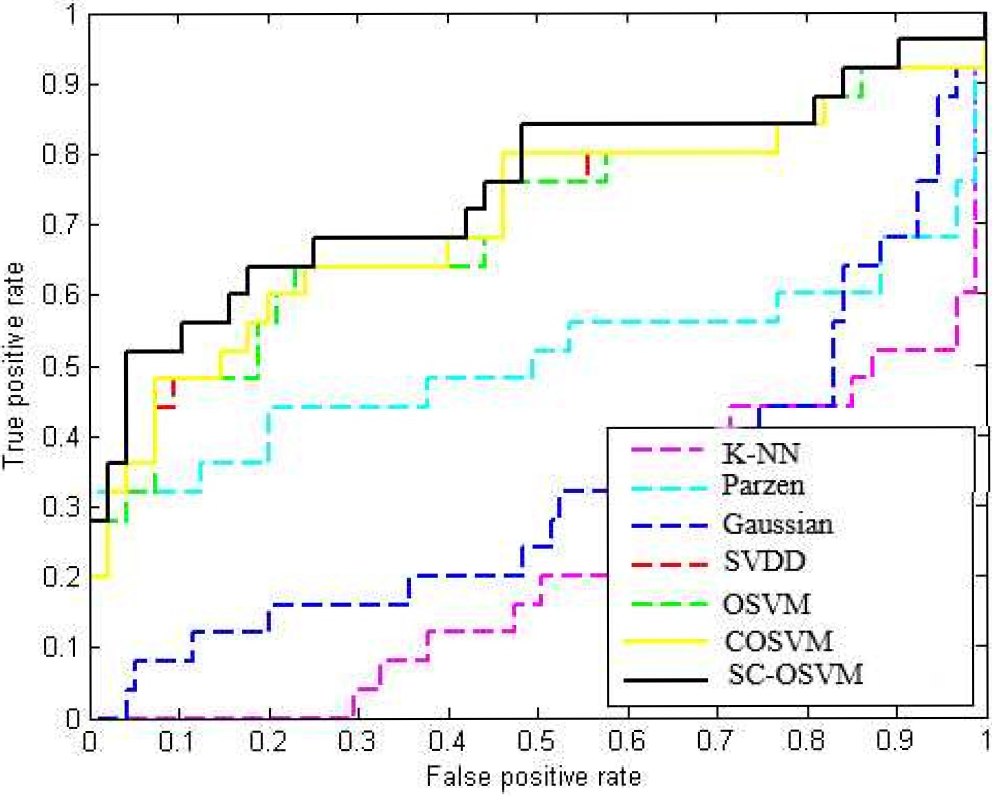
We provide individual graphical representations of the data set models by displaying the actual Receiver Operating Characteristics (ROC) [26] for the SPECT (normal) real world data set. Figure 5 illustrates the ROC curves for all the classifiers, revealing that SC-OSVM delivers the highest performance based on its ROC curve.
This article presents an improved version of the Covariance guided One-class SVM (COSVM) classifier called Scatter Covariance One-class SVM (SC-OSVM), which utilizes subclass information of the target class to reduce dispersion within and between subclasses and improve classification performance. The proposed approach involves dividing the target class into subclasses, calculating the between and within scatter matrix, and optimizing the COSVM’s objective function by incorporating these matrices to achieve the best classification accuracy.
The advantage of the SC-OSVM over other techniques such as SOC-SVM and KSVDD is that it reduces dispersion not only within each subclass but also between subclasses to enhance classification performance. Moreover, the SC-OSVM uses a trade-off parameter to regulate the contribution of the scatter matrix
To evaluate the performance of the SC-OSVM, various artificial and real-world benchmark datasets were used to compare it to contemporary one-class classifiers. The results show that the SC-OSVM outperforms other classifiers by a significant margin. In the future, the suggested SC-OSVM will be tested on security applications such as face recognition, anomaly detection, among others.