



Abstract
OBJECTIVE:
A representation of the sound recordings that are associated with the movement of the entire cardiac structure is termed the Phonocardiogram (PCG) signal. In diagnosing such diverse diseases of the heart, PCG signals are helpful. Nevertheless, as recording PCG signals are prone to several surrounding noises and other disturbing signals, it is a complex task. Thus, prior to being wielded for advanced processing, the PCG signal needs to be denoised. This work proposes an improved heart sound classification by utilizing two-stage Low pass filtering and Wavelet Threshold (WT) technique with subsequent Feature Extraction (FE) using Wavelet Scatter Transform and further classification utilizing the Cubic Polynomial Support Vector Machine (SVM) technique for CVD.
METHOD:
A computer-aided diagnosis system for CVD detection centered on PCG signal analysis is offered in this work. Initially, by heavily filtering the signal, the raw PCG signals obtained using the database were pre-processed. Then, to remove redundant information and noise, it is denoised via the WT technique. From the denoised PCG, wavelet time scattering features were extracted. After that, by employing SVMs, these features were classified for pathology.
RESULTS:
For the analysis, the PCG signal obtained from the Physionet dataset was considered. Heavy low-pass filtering utilizing a Low-Pass Butterworth Filter (LPBF) is entailed in the pre-processing step. This removed 98% of the noise inherently present in the signal. Further, the signal strength was ameliorated by denoising it utilizing the WT technique. Promising results with maximum noise removal of up to 99% are exhibited by the method. From the PCG, Wavelet Scattering (WS) features were extracted, which were later wielded to categorize the PCG utilizing SVMs with 99.72% accuracy for different sounds.
DISCUSSION:
The Classification accuracies are analogized with other classification techniques present in the literature. This technique exhibited propitious outcomes with a 3% improvement in the F1 score when weighed against the top-notch techniques. The improvement in the metrics is attributed to the usage of the pre-processing stage comprising of Low-pass filter and WT method, WS Transform (WST), and SVMs.
CONCLUSION:
The superiority of the proposed technique is advocated by the comparative investigation with prevailing methodologies. The system revealed that Coronary Artery Disease (CAD) can be implemented with superior methods to achieve high accuracy.
Keywords
Introduction
Globally, the chief reason for morbidity and mortality is Heart Diseases (HDs). Owing to HD, one out of every ‘3’ deaths happens worldwide [1, 2]. 16.7 million Deaths were engendered globally in 2002 as well as the numbers are anticipated to attain 23.3 million by 2030 [3]. CAD is the common reason behind HD. Also, the occurrence, as well as deaths owing to this, has augmented in the last few years [4]. The main cause of CAD is the plaque’s deposition on the inner wall of coronary arteries, which engenders unexpected cardiac arrest [5]. CAD relies on (a) Age, (b) smoking, (c) lifestyle, (d) exercise patterns, (e) diabetes, (f) hypertension, (g) obesity, and (h) raised blood cholesterol of an Individual [6]. The death rates connected with CAD differ worldwide. When analogized to other countries/regions, the maximum number of deaths is recorded in Asia, the Middle East, and Russia [7]. Single Vessel CAD (SVCAD), Double Vessel CAD (DVCAD), and Triple Vessel CAD (TVCAD) are the ‘3’ diverse categories of CAD, and they are classified based on the number of major coronary arteries affected by plaque buildup. The 3 types of CAD are given as follows.
SVCAD
In SVCAD, only one of the major coronary arteries are affected by plaque buildup. This can result in partial or complete blockage of blood flow to the heart, leading to symptoms, such as chest pain or discomfort, shortness of breath, or fatigue.
DVCAD
In DVCAD, two of the major coronary arteries are affected by plaque buildup. This can increase the risk of heart attack or other complications, as there is a greater likelihood of reduced blood flow to the heart.
TVCAD
In TVCAD, all three of the major coronary arteries are affected by plaque buildup. This can significantly lower blood flow to the heart, increasing the risk of heart attack or other serious complications [8, 9]. The CAD diagnosis is contingent on the harshness of left ventricular dysfunction along with the number of infected arteries. CAD’s signs may not evolve in diagnosis until stenosis becomes worse owing to compensatory mechanisms of the cardiac as well as pulmonary vasculature [10]. This might append intricacies to the diagnosis, and until it turns out to be extremely complex for non-invasive therapy, the person may stay undiagnosed. To lessen the death rate as well as evade further complexities, CAD’s timely and exact diagnosis is indispensable. Recently, for the diagnosis of CAD, Coronary Angiography (CA) is considered the gold standard [7]. It is a costly as well as invasive clinical process; also, it needs specialist expertise to operate [11]. Severe complications like artery segmentation, arrhythmia, or even unexpected fatality might be induced by CA. For cardiac disorders screening, an economical and useful procedure that is widely wielded is PCG auscultation [12]. Owing to coronary stenosis in PCG signals, weak heart murmurs are generated as per earlier works [13, 14]. In manual auscultation, these murmurs are extremely complex to identify. For diagnosing via manual auscultations, the types of CAD have no potential. Thus, for detection and the categorization of CAD, it is very important to create an intellectual PCG signal analysis technique [15]. PCG signals provide valuable information for the diagnosis of different heart diseases. PCG signals are recordings of the sounds produced by the heart during its normal functioning; also, they can be analyzed to detect abnormalities in the heart’s functioning. Some of the most general sorts of heart diseases include,
Coronary artery disease
This is caused by a plaque buildup in the arteries that supply blood to the heart. The arteries are reduced by plaque, which in turn reduces blood flow and causes chest pain or else a heart attack.
Heart failure
This occurs when the heart is not able to pump adequate blood for meeting the body’s requirements. It could be caused by a variety of factors like diabetes, high blood pressure, coronary artery disease, et cetera.
Arrhythmias
These are abnormal heart rhythms that could cause the heart to beat too fast, too slow, or irregularly. They could be caused by a variety of factors like electrolyte imbalances, medications, and heart disease.
Heart valve disease
This occurs when the valves in the heart don’t function properly, either by not opening fully or by not closing completely. It could be caused by a variety of factors, namely congenital heart defects, infection, and age.
Other less common sorts of heart disease include congenital heart defects, cardiomyopathy, and pericardial disease.
PCG signals
PCG is a non-invasive diagnostic tool that records and analyzes the sounds produced by the heart during its normal functioning. The PCG signal is obtained by placing a microphone or a sensor on the chest wall and then recording the sound waves produced by the heart. The PCG signal gives the characteristics of different heart sounds by capturing the acoustic vibrations generated by the heart during its normal functioning. This provides valuable information about the heart’s functioning and can help in the diagnosis of various heart conditions.
The PCG signal gives the characteristics of different heart sounds by capturing the acoustic vibrations generated by the heart during its normal functioning. The different heart sounds are characterized as S1, S2, S3, and S4. The (S1) is produced by the closing of the mitral and tricuspid valves at the beginning of systole. The sound is usually described as a lub and is heard as a low-frequency sound in the PCG signal. The (S2) is produced by the closing of the aortic and pulmonic valves at the end of the systole. The sound is usually described as dub and is heard as a high-frequency sound in the PCG signal. Additional heart sounds, such as S3 and S4 can also be heard in the PCG signal. S3 is produced by the rapid filling of the ventricles during diastole, while S4 is produced by the contraction of the atria just before S1.
The PCG signals can be classified based on different factors, such as,
Timing: PCG signals can be classified based on the timing of the heart sounds like the duration of the systolic and diastolic periods of the heart cycle. Frequency: PCG signals can also be classified grounded on the heart sounds’ frequency content, thus providing information about the different components of the heart sounds. Amplitude: PCG signals can be classified based on the amplitude or intensity of the heart sounds, which can be used to detect changes in the heart’s functioning.
Literature review
The majority of the previous studies concentrated on CAD recognition via Electrocardiogram (ECG) signals [16, 17, 18, 19, 20, 21, 22, 23]. Phonocardiograms (PCGs) and electrocardiograms (ECGs) are both non-invasive diagnostic tests wielded for evaluating the heart’s function.
Phonocardiograms are recordings of the sounds produced by the heart and are typically used to detect abnormalities in the heart valves and muscles. PCGs can detect murmurs, clicks, and other abnormal sounds that indicate issues, such as valve stenosis or regurgitation, ventricular septal defects, or hypertrophic cardiomyopathy.
Electrocardiograms, on the other hand, measure the heart’s electrical activity and could provide information about the rhythm and function of the heart. ECGs can detect arrhythmias, such as atrial fibrillation, and can also provide information about the presence of ischemia or damage to the heart muscle, such as in the case of a heart attack.
In [16], ECG-centered categorization of CAD was offered [16]. From ECG beat’s 4th-level detail coefficients decomposed via flexible analytical Wavelet Transform (WT), Cross Information Potential features were extracted. A detection accuracy of 99.6% was accomplished by utilizing Least Squares SVM (LS-SVM). To recognize CAD via ECG signals, authors in [18] deployed Convolutional Neural Networks (CNNs) with long short-term memory. By utilizing deep CNN, ECG signals were examined in other analogous work [17]. Arabasadi et al. [19] propounded a hybrid methodology by wielding a Genetic Algorithm along with Neural Networks (NNs) to identify CAD utilizing ECG signatures. 93.8% diagnostic accuracy was attained by the study. A methodology for CAD identification utilizing ECG signal’s heart rate instability investigation was offered by Dolatabadi et al. [21]. Through an optimized SVM classifier, 99.2% accuracy was accomplished by the technique. For the CAD detection utilizing ECG signals, a signal processing structure was propounded by Khan et al. [22]. By means of Empirical Mode Decomposition (EMD), ECG signals were initially denoised. To execute classification, Multi-Domain Features (MDFs) were extracted by utilizing SVM. One of the largely budding fields in Machine Learning (ML) is Deep Learning (DL). By deploying 2 and 5 s ECG segments, automated discovery of CAD was carried out via the 1-dimensional version of CapsNET [23]. From ‘7’ CAD and ‘40’ normal subjects, these signals were amassed. Higher-order statistics bi-spectrum and cumulant features were extracted as of ECG beat to differentiate CAD as well as healthy subjects in other research [20]. Through Principal Component Analysis (PCA), the feature dimensions were lessened. For training Decision Tree (DT) along with K-Nearest Neighbours (KNN) classification approaches, reduced features were wielded that achieved 98.9% and 98.1% accuracies, correspondingly. Important signatures that are related to cardiac disorders were carried by the PCG signals. By utilizing the openly obtainable datasets Physio-Net/CinCChallenge [24, 25, 26, 27, 28, 29] along with PASCAL [30, 31], the majority of the current works on PCG classification meant for cardiac disorders were done. For valvular heart disorder detection, many works amassed PCG datasets [32, 33, 34]. On the contrary, a comparatively finite amount of research on CAD detection via PCG signal analysis was present [5, 35, 36, 37, 38]. The ML pipeline’s traditional steps, that is, FE and classification, were pursued by these works. To identify feeble murmurs produced by CAD utilizing acoustic features, an approach was propounded by Semmlow et al. [15]. A digital electronic stethoscope for the CAD diagnosis was tested by the authors in Ref [35]. From 161 patients who had numerous cardiac diseases, they amassed data. By utilizing PCG signals, a lower-cost CAD detection model was propounded by Schmidt et al. [36]. From ‘5’ overlapping frequency bands, ‘9’ features were extracted and categorized via quadratic Discriminant investigation. CAD subjects’ 204 recordings together with 231 recordings from Non-CAD subjects were encompassed in the self-accumulated dataset. By means of extorting Cross-Power Spectral Density (CPSD) characteristics as of the heart’s sounds, CAD was diagnosed in [39]. A classification accuracy of 84% was obtained via the SVM classifier. To differentiate normal together with CAD subjects, a PCG-centered multi-channel data acquisition setup was wielded in another similar study [40]. Spectral entropy (SE), PSD function’s moments, Spectral Moments (SM), Autoregressive (AR) parameters, along with Instantaneous Frequency (IF) feature were the ‘5’ diverse features, which were calculated from the PCG signal’s frequency domain transformation. To execute classification, an Artificial NN (ANN) was deployed. For multi-channel as well as signal-channel data, accuracies of 74.2% and 69.6% were attained. For CAD detection, a 4-channel PCG signal acquisition system was developed by Samanta et al. [41]. To recognize CAD along with normal classes, time and frequency domain features were scrutinized. The finest outcome of 82.5% accuracy was generated by the sub-band features with the ANN classifier. [42] Researched the impact of noise on CAD detection via PCG signals. By utilizing an imaginary part of CPSD, the heart sound spectrum was extracted. To differentiate normal and CAD classes, Spectral Features (SFs) calculated from sub-bands were classified by utilizing SVM. For CAD detection via PCG signals, a feature fusion methodology was propounded [5]. From diverse domains, 110 features were obtained, which were lessened via PCA. For extracting Deep Features (DFs), spectrogram images calculated as of MFCCs were fed to the CNN. These DFs were fused with the decreased MDFs as well as categorized via a Multilayer Perceptron Network (MLP). The experiment was carried out on a dataset amassed from 175 subjects. Accuracy of 90.4%, a sensitivity of 93.6%, along with a specificity of 83.3% were accomplished via the propounded fused structure. For the recognition of diverse kinds of CAD, a PCG-based ‘2’-stage classification strategy was propounded recently [43]. Via EMD, PCG signals were pre-processed. By extracting MFCC as well as statistical features with a KNN classifier, normal and CAD signals were classified in the 1
The following are the major contributions of this study.
A novel methodology is proposed that deploys a two-stage Low pass filter (LPF) and WT-centered pre-processing, Wavelet Scatter Transform-centered FE, along with classification steps utilizing SVMs. The classification performance was significantly ameliorated by the proposed two-stage LPF-WT-based denoising and Wavelet Time scattering. Regarding accuracy, sensitivity, along with specificity, the proposed technique provides a considerably 3% enhanced performance for CAD detection via PCG signals when analogized to the prevailing literature. Centered on the severity level, the proposed methodology can classify the kind of CAD. By utilizing a Binary Class (BC) Support Vector framework, this classification is carried out, and it accomplished 96.02% specificity, sensitivity 94.2%, and 93.26% F1 score for abnormal, and 97.41% specificity, sensitivity 96.16%, and 96.78% F1 score for Normal classes.
Overview
Block Diagram of the CVD diagnostic system.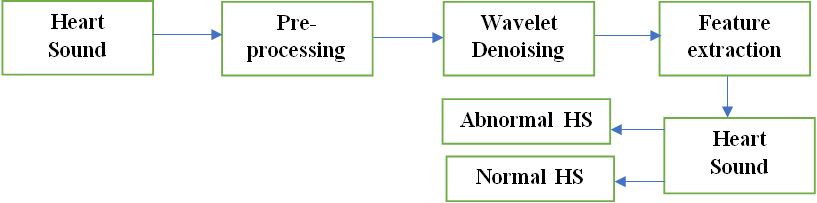
Figure 1 depicts the proposed computer-aided diagnosis scheme’s architecture for CVD categorization via PCG signals. PCG signals obtained from the Physionet database are exhibited as a 1st stage; they are initially pre-processed to eliminate redundant information together with noise. To remove most of the noise present in the signal up to a limit of 98%, a 6
Low pass filtering and Wavelet Threshold method
Here, a two-stage filtering strategy was espoused to remove unwanted noise and other artifacts hidden underneath the signal. In the first stage, LPBF with a cut-off frequency of 160 Hz is wielded for removing higher-frequency noise from the signal. In the second stage, a WT is applied to the signal. WT is used to identify and remove hidden noise from a signal by decomposing the signal into its component wavelets at different scales. The wavelets that contain noise can be isolated and removed, while the remaining wavelets are recombined to reconstruct a clean signal. The advantage of using WT for hidden noise reduction is that it can preserve important features of the signal while removing noise.
Two methods are popular in the WT denoising procedure. They are the Hard Threshold and the Soft threshold [44].
Hard thresholding
Hard thresholding involves setting the wavelet coefficients to zero if they are below a certain threshold value. This method is more aggressive than soft thresholding and can lead to a loss of signal features. The mathematical interpretation of the hard threshold is indicated as,
Soft thresholding
Soft thresholding involves shrinking the wavelet coefficients toward zero using a threshold value. This method allows the coefficients to have a continuous transition towards zero, which can help to preserve the signal features and reduce the noise. The mathematical interpretation of the soft threshold is denoted as,
The soft threshold method is a lot finer and is also called the wavelet-shrinkage method. The hard threshold is much cruder. The basic principle behind the wavelet shrinkage method is to apply a thresholding function to the wavelet coefficients. There are various sorts of thresholding functions; however, the most common ones are hard thresholding and soft thresholding.
The wavelet shrinkage method has several properties that make it useful for signal denoising, which is given as follows.
It is a non-parametric technique that does not require any assumptions about the noise distribution or the signal characteristics. It is a computationally efficient method that can be applied to large signals. It can be applied to different types of signals, including stationary and non-stationary signals. It can be used for both denoising and compression purposes. The thresholding function can be adapted to the specific characteristics of the signal, such as its sparsity or smoothness.
The denoised signal is represented by
Original signal (pane 1), hard threshold signal (pane 2), soft threshold signal (pane 3).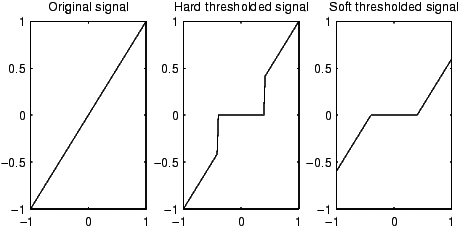
The examination of the WT model’s performance is carried out on the PCG signal that is corrupted with noise with high and low input SNR levels. By utilizing statistical metrics, the performance of the algorithm can be quantitatively assessed.
Mean Square Error (MSE) is indicated by
Signal to Noise Ratio (SNR) (in dB) is indicated by
Peak Signal to Noise Ratio (PSNR) (in dB) is indicated by
The Correlation Coefficient (CC) is symbolized by,
Translation Invariant (TI), stable, along with informative signal representations are constructed by a WST. The WST is a signal-processing technique that is used for feature extraction. The scattering transform aims to extract features that are invariant to translations and small deformations from the signal. The modulus non-linearities in the scattering transform provides a way to capture features that are invariant to translations, and the multiple layers of the transform make the neural network learn complex features. Moreover, it is efficient for deformations as well as protects against class discriminability, which makes it predominantly effectual for classification. For classification, [44, 45, 46, 47, 48] is referred to as its outstanding practical performance. The notations in [46] are followed. Assume
The second-order SCs
By averaging
Figure 3 portrays the scattering process. To elucidate the input signal’s features, SCs of the entire orders are aggregated by the final scattering matrix
Tree view of the scattering network.
Wavelet filters. (a) The LPF with 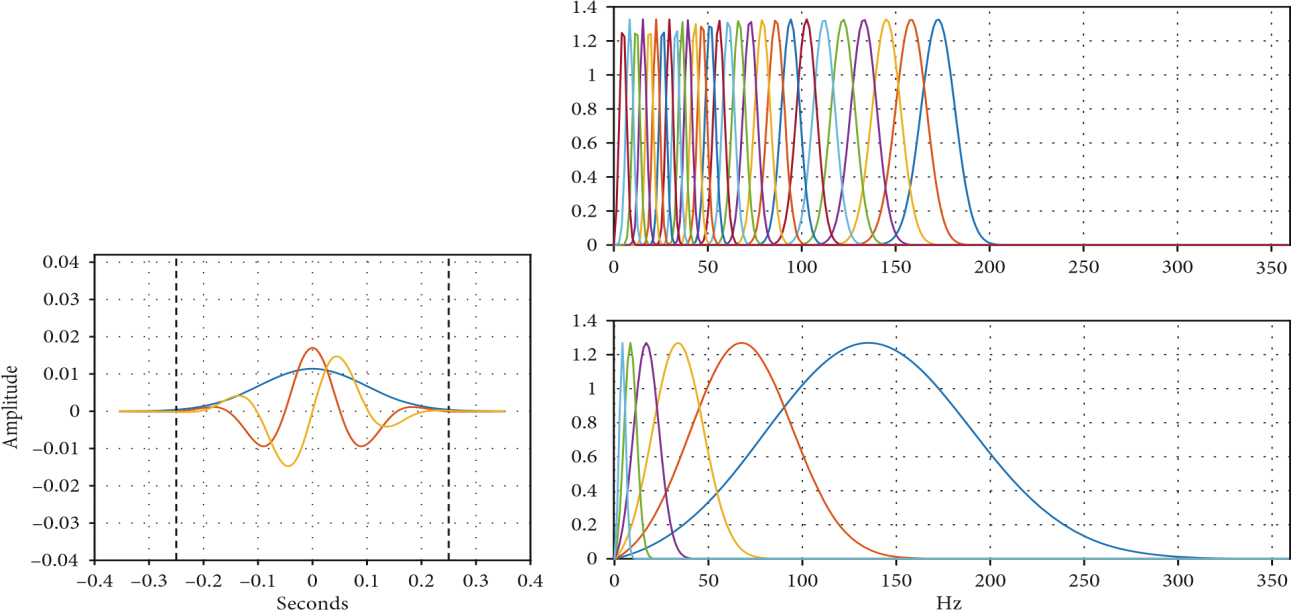
By employing top-notch classification techniques, namely SVMs, the classification of healthy, along with Abnormal PCG signals is carried out. Via a 10-fold Cross-Validation (CV) system, the classifiers were trained and authenticated. The classifier’s performance with the feature set is scrutinized. For distinguishing the ‘2’ classes of PCG signals, the pre-eminent performance is produced by means of the SVM-C. The better-performing classifier is tested by utilizing 5, 15, and 20 folds CV and via 80–20% and 70–30% train-test schemes to additionally merge the classification outcomes.
The process of classifying PCG signals as normal or pathological using machine learning typically involves the following steps.
Feature extraction
The PCG signal is analyzed to extract a set of features that can be used to differentiate between normal and pathological signals. These features may include time-domain and frequency-domain features like the duration of different heart sounds, the heart sounds’ intensity, or the spectral content of the signal.
Model training
A classification model is trained on a labeled dataset of PCG signals. The dataset consists of PCG signals that have been classified as either normal or pathological based on clinical criteria.
Model testing
The trained classification model is then tested on a separate dataset of PCG signals to evaluate its accuracy and performance. This dataset consists of PCG signals that were not used during the model training phase.
Model evaluation
The classification model’s performance is evaluated utilizing metrics, such as specificity, sensitivity, and accuracy, which measure the ability of the model to correctly classify true positives (pathological signals) and true negatives (normal signals), respectively.
Results
Here, for the detection along with the classification of cardiac disorders, the proposed computer-aided diagnosis scheme’s outcomes are exhibited. The proposed technique is trained as well as tested on the Physionet PCG signal database.
PCG signals are generated from the depolarization wave that travels through the heart during the cardiac cycle. The depolarization wave causes the heart muscles to contract, which produces mechanical vibrations that can be heard through a stethoscope. To generate PCG signals from the depolarization wave, a microphone or an electronic sensor is placed on the chest to capture the mechanical vibrations produced by the heart. PhysioNet is the database that provides open access to a large collection of PCG signals recorded from various sources, including healthy individuals and patients with different cardiac conditions.
Preprocessing
The two-stage low-pass filtering and WT method were tested on the Physionet database. For denoising sounds, soft and hard threshold methods are used. The TVs were limited to
The accuracy of every TW categorized by the SVM
The accuracy of every TW categorized by the SVM
Classification metrics for various SVM classifiers
The confusion matrix for 5-TWsmerged with the SVM across 5 folds
To execute wavelet decomposition, Gabor Wavelets (GWs) are utilized. The equivalent LPF
For only 2 classes, namely Healthy and Abnormal, the PCG signal dataset was labelled in the BC experiments.
Classification metrics for various SVM classifiers with different folds and hold out
Classification metrics for various SVM classifiers with different folds and hold out
Previous classification works mentioned in literature
Previous classification utilizing physionet database
Performance comparison with previous studies.
Figure 5 compares the accuracy rates of the proposed method and the existing works. From the comparison analysis, it is known that the proposed method remains to be more accurate as compared to the existing research methodologies. In the proposed work, the PCG signals are efficiently denoised and the more appropriate feature extraction phase is carried out, that significantly extracts the hidden features from the signal. Due to this, the proposed method withstands better accuracy (99.63%).
The earlier work’s outline for CAD detection utilizing PCG signals is provided in Tables 5 and 6. For the proposed algorithm’s training along with corroboration, these studies deployed self-amassed private datasets of diverse sizes. Thus, the one-to-one comparison is not reasonable. The majority of the earlier work just carried out the classification of normal vs abnormal types. For superior CAD diagnosis, the PCG signals were obtained from 4 diverse sites in Ref. [39]. From PCG signals, CPSD features are extracted as well as decreased via the ReliefF algorithm. For this binary classification issue, SVM is utilized as a classifier. To execute the CAD classification and normal PCG signals, ‘5’ diverse features are extracted by utilizing an ANN classifier in other research [40] and it accomplished 74.2% accuracy with AR features. For CAD detection via PCG signals, a feature fusion methodology is propounded by Li et al. [5]. The feature fusion framework is a machine learning approach that combines multiple features extracted from PCG signals for enhancing the accuracy of CAD detection. The merits of utilizing the feature fusion framework are listed below.
Improved accuracy
By combining multiple features extracted from PCG signals, the feature fusion framework can improve the accuracy of CAD detection. This is because different features capture different aspects of the signal, and combining them can provide a more comprehensive and accurate representation of the signal.
Reduced dimensionality
The feature fusion framework reduces the dimensionality of the feature space by combining multiple features into a single feature vector. This could aid in enhancing the efficacy of the machine-learning approach utilized for CAD detection.
A variety of MDFs is extracted and lessened from PCG signals. The input for the CNN is MFCC’s images. The MFCCs are two-dimensional images, with time on one axis and frequency on the other axis. Each MFCC coefficient corresponds to a pixel in the image, and the overall MFCC image reflects the temporal and spectral characteristics of the PCG signal. These attributes were merged with multidomain PCG signal features as well as categorized via MLP. The multidomain PCG signal features are listed in Table 7.
Multi-domain PCG signal features
Multi-domain PCG signal features
From 175 subjects, PCG’s dataset is amassed and 90.4% of accuracy was obtained. For the recognition of normal, DVCAD, SVCAD, together with TVCAD, a ‘2’-stage classification system is proposed [43]. By utilizing EMD, PCG signals are denoised followed by FE via a blend of statistical, spectral, along with MFCC. The EMD, which decomposes a complex signal into simpler components named Intrinsic Mode Functions (IMFs), is a signal processing technique. The important application of EMD is signal denoising and feature extraction from signals. EMD decomposes the PCG signal into its different frequency bands and then filters out unwanted noise from each band individually. After denoising the signal using EMD, the different IMFs can be analyzed to extract features that can be used for further analysis of heart conditions. KNN was utilized in the 1
Utilizing the 4th TW as a feature, it offers the highest average accuracy of 99.8% amongst all methods that wield the SVM classifier. Table 2 depicts the confusion matrix for 5-TWs. A sensitivity of 94.536%, specificity of 92.021%, and F1-score of 93.261% are displayed by the abnormal sounds whilst a sensitivity of 96.169%, specificity of 97.413%, along with F1-score of 96.787% is exhibited by the Normal sounds as per the confusion matrix. SVM-L, which expresses Linear Kernel, SVM-C, which expresses Cubic Polynomial Kernel, and SVM-G, which expresses Gaussian Kernel, were the utilized ‘3’ variants of SVM. The description for the SVM variants,
SVM-L
The purpose of SVM-L is to find the hyperplane that separates the data in a linearly separable way. The linear kernel is a simple dot product between the input features and is computationally efficient. SVM-L is commonly used for binary classification problems.
SVM-C
The purpose of SVM-C is to find a non-linear decision boundary using a cubic polynomial kernel. The cubic polynomial kernel maps the input features to a high dimensional space, allowing for a non-linear decision boundary to be found. SVM-C is useful for problems, where the data is not linearly separable.
SVM-G
The purpose of SVM-G is to find a non-linear decision boundary using a Gaussian kernel. The Gaussian kernel is a popular non-linear kernel that maps the input features to an infinite-dimensional space. SVM-G is commonly used for problems, where the data is not linearly separable.
In heart sound analysis, SVM is used with different types of features and classification methods. Some of the feature classification methods that SVM can handle contain:
Time-domain features: Features that are extracted directly from the raw signal, such as the amplitude, duration, and frequency content of the signal. Frequency-domain features: Features that are extracted using Fourier transform or other spectral analysis techniques, such as the power spectrum or spectral entropy. Wavelet transforms features: Features that are extracted using wavelet transform, which can capture the time-frequency characteristics of the signal. MFCCs: Features that are extracted using the Mel frequency cepstral coefficients (MFCCs) technique, which is commonly used in speech recognition and can be adapted for heart sound analysis.
The Classification metrics for the above ‘3’ variants of SVM are articulated in Table 1. Regarding performance metrics like 96.45% Sensitivity, 95.9% Specificity, and 96.3% F1-score, SVM-C surpasses the other ‘2’ variants. By utilizing the ‘3’ variants of SVM, the K-Fold Validation along with Hold-out tests are also carried out on the dataset. For 5, 10, 15, and 20 K-Fold Validations, the SVM-C surpasses the other ‘2’ variants regarding the Accuracy of 99.4%, 99.6%, 99.72%, and 99.7% as of Table 3. In the Hold-out evaluation with metrics of 99.8% accuracy, the 80%–20% Train-test dataset outperformed the 70%–30% Train-test dataset as per the simulation results in Table 3.
Conclusion
Prominent characteristic information regarding human cardiac states is comprised in the PCG signals as per the study. So, to identify heart disorders, this information is extracted. Centered on PCG signal analysis, a computer-aided diagnosis system is proposed to efficiently differentiate healthy and abnormal classes. To pre-process the raw PCG signals, the proposed methodology deployed WT. For the binary experiment, the WS features are classified. Better performance of 99.63% accuracy, 95.9% sensitivity, along with 96.2% specificity is generated by the proposed technique for a binary experiment (Healthy versus CAD).