
Abstract
The number of patients with skin diseases reported a dramatic increase which is a major concern and should be addressed. The evaluation of skin is crucial to the correct diagnosis during the follow-up. Through technological advances and partnership, skin disorders can be identified and predicted.
PROBLEM:
The manual detection of skin diseases may sometimes lead to misclassification due to the same intensity and color levels, which is crucial to the correct diagnosis.
SOLUTION:
An automated system to identify these skin diseases is applied. An IoT-based skin monitoring infrastructure is imposed that links the entire system.
METHOD:
In this study, a Retracing-efficient IoT model for identifying the moles, skin tags, and warts using Automatic lumen detection with the help of IoT-based Variation regularity is proposed with the technique imposed IoMT, Automatic lumen detection, Variation regularity, and trigonometric algorithm.
RESULTS:
The intensity and edge width based on moles, skin tags, and warts edge width heightened intensity accuracy is 56.2% on the image group with image count is 500 to 10000, and the enhanced low-level total sample accuracy is 95.9%. The pixel analysis for intensity with wavelength and intensity with time wavelength is improved from 4.2% to 54.6%, and accuracy is 70.9% formulated. Periodic classification on image count and classification accuracy image count is 87% against the 500 to 10000 image. Correlation performance analysis of lumen detection resolution image pixel and enhanced correlation performance accuracy is 23.50% on the 480
CONCLUSION:
The approach is tested for varying datasets, and comparative analysis is performed that reflects the effectiveness of the proposed system with high accuracy, thus contributing to the development of a perfect platform for skincare to the early detection and diagnosis of skin conditions.
Introduction
Skincare is a potential area for development in medicine that requires a lot of research. The best strategy for early detection of skin diseases is to promote and enable more efficient skin monitoring systems. This work contributes to developing a perfect platform for identifying the moles, skin tags, and warts using Automatic lumen detection with the help of IoT-based Variation regularity. Automatic lumen detection is fundamental for detecting moles and skin tags; the term lumen refers to the image region that depicts the imaged piece of tissue relating to the camera [1, 2, 3, 4, 5]. In this study, the dataset images processing idea is investigated in which the concept behind identifying the moles, skin tags, and warts from the existing dataset images and creating the IoT model with a trigonometric algorithm for imaging and analysis is carried out. The trigonometric algorithm is a simple and efficient algorithm to calculate trigonometric functions, square roots, multiplications, and other functions. The proposed system functions on the two-input logic gate for computation in moles, skin tags, and warts availability. In this study, the Statistical analysis for predicting the moles, skin tags, and warts was implemented, and the periodic classification for classifying the predicting results was performed [6]. Here the result ferments the two-input logic gate used for computation in moles, skin tags, and warts availability. Spatial transcriptomic is a groundbreaking molecular profiling method that allows measuring the gene activity in a tissue sample and mapping where the action is going on. The ability to record the spatial context of gene transcription within intact tissue, whether for areas or single cells, is known as spatial transcriptomics. The barcoded primers and collect nearby mRNAs from the tissue whenever a tissue cryosection is fastened to a spatial transcriptome slide. With the help of the ground-breaking molecular profiling technique known as spatial transcriptomics, researchers can map the locations of all the genes that are active in a tissue sample. This is used to define the transcriptional patterns and the Turn-key mapping heterogeneity, which is applied to show the structured illumination of the moles, skin tags, and warts [7]. In order to collect patient data from the IoT, we designed Generalize Approximate Reasoning Base Intelligence Control (GARIC) with regression rules. Additionally, to train the data for artificial intelligence (AI), a Boltzmann belief network deep learning technique is used. Genome wide association study (GWAS) is then utilised to forecast the diseases after regularisation. Then, people who have certain ailments will receive notifications by SMS, emails, etc., followed by medical care and advice [8]. The statistical analysis predicts the moles, skin tags, and warts using the Periodic classification. From this discussion, the following are the significant contributions made by this study:
Retracing-efficient IoT model for identifying the moles, skin tags, and warts using Automatic lumen detection with the help of IoT-based Variation regularity is proposed. We promote the best strategy for early detection of skin diseases, and more efficient skin monitoring systems are enabled. Spatial transcriptomic is used to define transcriptional patterns. Turn-key mapping heterogeneity is applied to show the structured illumination of the moles, skin tags, and warts. The general algorithm for the two-input logic gate, Spatial Transcriptomic, the periodic classification enabled for classifying the predicting results were implemented.
The paper is divided and laid out into the following chapters as follows. Chapter-2 discusses the literature and previous research on Automatic lumen detection of the skin analysis, Chapter-3 presents the design and implementation of the proposed system, Chapter-4 performs the Statistical analysis, Chapter-5 reveals the results and discussion, Chapter 6 concludes the superiority of the proposed method with the future studies.
In the table below, the existing reviews have been mentioned for easy access for future readers to gain the knowledge for identifying the moles in the skin and the detection of the automatic lumen. Also, the variation of the skin disease and the moles, tags, and warts are identified by some of the methods mentioned below.
Literature review for various services article
Literature review for various services article
The mole of the skin is defined as the nevus, which is not harmless. The mole can be of any size and color. The mole can appear anywhere on the skin. It can occur in childhood or adulthood at the age of below 20 and after 40. The mole can be present in the human body is about 50 years. There are types of moles that are present the common nevi, congenital nevi, dysplastic nevi, etc. Common nevi look tan and pink and occur small on the skin. The congenital nevi appear when we are born and develop into melanoma. Also, dysplastic nevi appear larger than a pencil eraser, and it looks like an abnormal shape. A mole that differs from a typical mole in appearance is called a dysplastic nevus. A elbow dysplasia nevus may be larger than a typical mole and have a distinct colour, surface, and border. Familial atypical multiple mole-melanoma (FAMMM) syndrome, also known as dysplastic nevus syndrome, is a hereditary cutaneous disorder that has been reported in some families and is characterised by several hereditary melanomas and odd nevi. Also, this type of mole should check whether it is a cancer skin tag or a normal skin tag [9].
Trigonometric algorithm for the analysis of skin tags
The arithmetic trigonometric optimization algorithm makes the inspiration for the SCA and AOA algorithms [10]. Instead of using variables, the proposed ATOA makes use of four arithmetic operators. The existing AOA’s architecture and position updating mechanism are maintained by the ATOA as well. The acronym ATOAsc denotes the employment of the sin function during exploration and the sin function during exploitation. The recently created metaheuristic search method known as the “arithmetic optimization algorithm” (AOA) models the distribution properties of the fundamental arithmetic operations. Here, the design structure and the parameters of the flexibility modification are based on the engineering problems’ requirements. The sine cosine algorithm is the technique that is initiated for the random solution of the objective functions. A population-based optimization approach called the Sine Cosine Algorithm (SCA) can be used to solve a variety of optimization issues. Using a computational formula based on the sine and cosine functions, the SCA creates a variety of initial random answers and asks them to go in the direction of the optimum solution [11].
The sine cosine algorithm is a population-based optimization algorithm. Initialized the group of population with a random solution. Here, the group of a population refers to a group of the image dataset [12]. These datasets are necessary to evaluate to find the optimal solution based upon the required objective function. The optimal solution is a set of points in the feasible area of the objective function’s graph that provide either the requisite maximum or minimum value for the optimization problem. Once the functional form reaches its highest (or least) value, a solution is said to be optimum. The algorithm is consisted of exploration and the exploitation phase to reach the global minima. Exploration is the process of exploring the uncharted territory of a viable region, whereas exploitation is the process of searching the immediate vicinity of an opportunity to attract. During the exploration phase, the position updating equation is,
When the area is located by exploration, the random solution is reduced in the exploitation phase due to the fluctuation. Then, the position updating equation is,
For T
T and t denote the current and maximum iteration, respectively. The random variable R
During the exploration and exploitation, the parameter R
Similarly, if the R
The random variable R
The SCA algorithm is the metaheuristics algorithm. Which is used in the population-based optimization algorithm [13]. A metaheuristic algorithm is a search method created to locate a suitable answer to an optimization issue that is complex and challenging to solve. Strategies that direct the search process are known as metaheuristics. Finding solutions that are close to ideal requires effective search space exploration. Metaheuristic algorithms use a variety of methods, from straightforward local search techniques to intricate learning procedures. This helps in finding the best options and the single running of the metaheuristic algorithm. This position updating looks like the equation during the region of the optimal research.
The switching condition makes the system’s formation produce the SCA in the formula mentioned above. Where,
Identifying the moles, skin tags, and warts from the existing image dataset.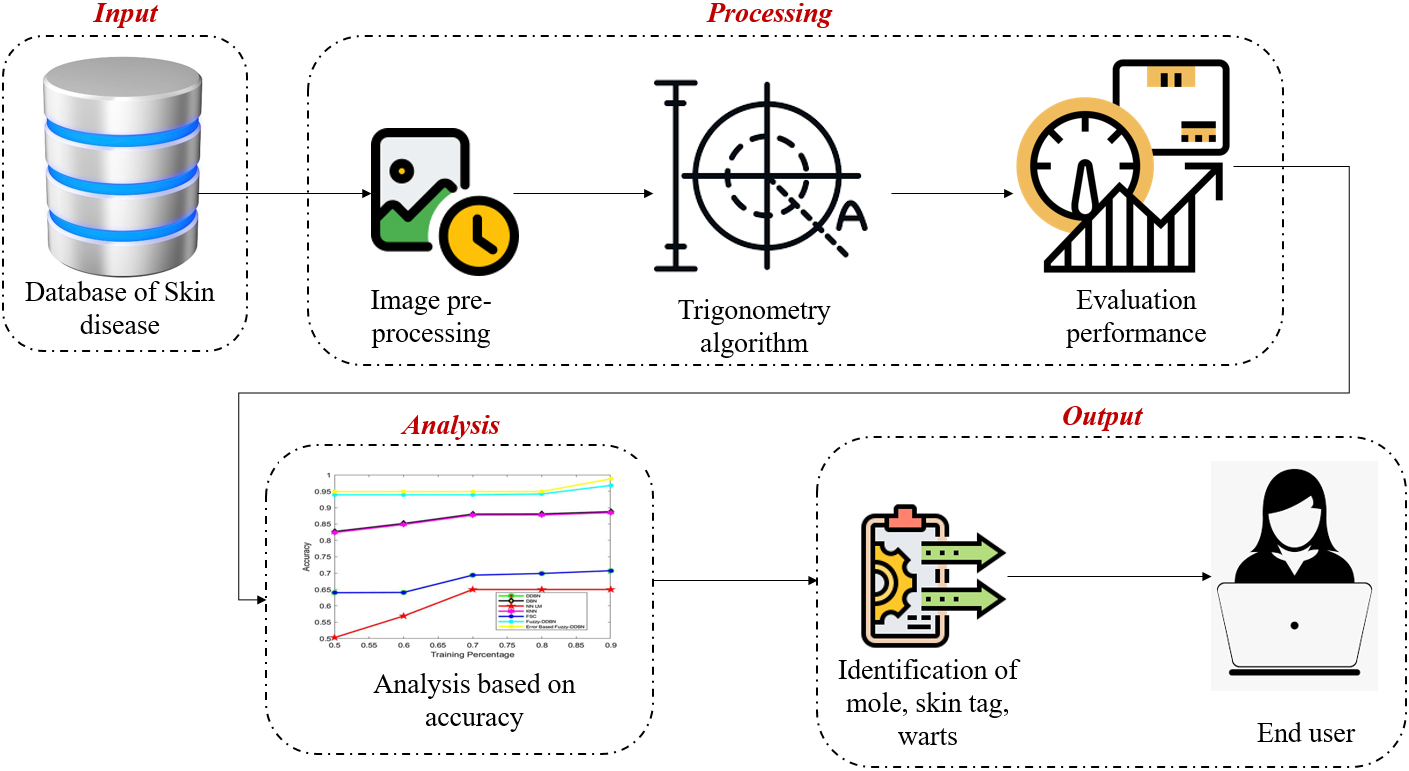
Spatial transcription is a method for delivering the cell types to their locations in the histological sections. The sample of the individual tissues is kept to capture mRNA for all the types of modifications and improvements. It is also known as the profiling method of the molecules to measure the gene activity of the sample tissue. Criminal profiling is the practise of drawing conclusions about the character and other traits of the likely criminal based on the type of a crime. Instrumentation profilers come in two different varieties are binary profiler and source-code altering profiler. The spatial sequencing makes the transcriptional process capture the bar code for the tissue. Electrophoresis is a method used in sequencing to separate DNA fragments that vary in length only by one nucleotide. Observing a particular area or region inside a tissue and then sequencing every transcript detected there is known as spatial sequencing. The use of spatial sequencing enables the mapping of gene expression variation within a tissue or area of interest. Here, the single-cell data for the proportion estimation for each cell type capture the location using spatial data [15]. For analysis, the skin of humans and animals is used to pair the cell data. The Single Cell Spatial Program Schedule aims to establish the University of Michigan as a recognised leader in the application of high-resolution spatially-resolved multi-omic analysis inside of single cells and in cells inside of tissues to advance next-generation biological and medical technologies. Using an unstructured method, individual cells are clustered, and the clusters are then classified as belonging to various cell types using canonical indicators discovered in the cluster’s gene differentially expressed.This method makes the tissue development of the skin tags, and the warts are analyzed, and then the good skin texture and the skin texture that contains the tags are done. The heterogeneity of the single-cell profiling makes the computational approaches for the gene expression and the regeneration of the clinical pathology. This spatial transcription male the image capture of the certain area, and then the tissues in the area are spotted using the spatial transcription for analyzing the neighbor tissue acting. In single-cell transcriptomics, the RNA levels of a large number of genes are simultaneously measured in order to analyse the amount of gene expression in specific cells within a population. Gene expression is significant because a particular protein can only be created when its gene is activated. The process of creating proteins is a crucial step in the transcriptomic route that can be changed in cancer, but it requires and over one step to go from gene to protein. Differential expression analysis is the process of statistically analysing the adjusted read count data to identify quantifiable differences in expression levels between test group. The differential gene expression analysis is done using the sample skin [16].
Transcriptional patterns estimation of moles, skin tags, and warts using Spatial Transcriptomic.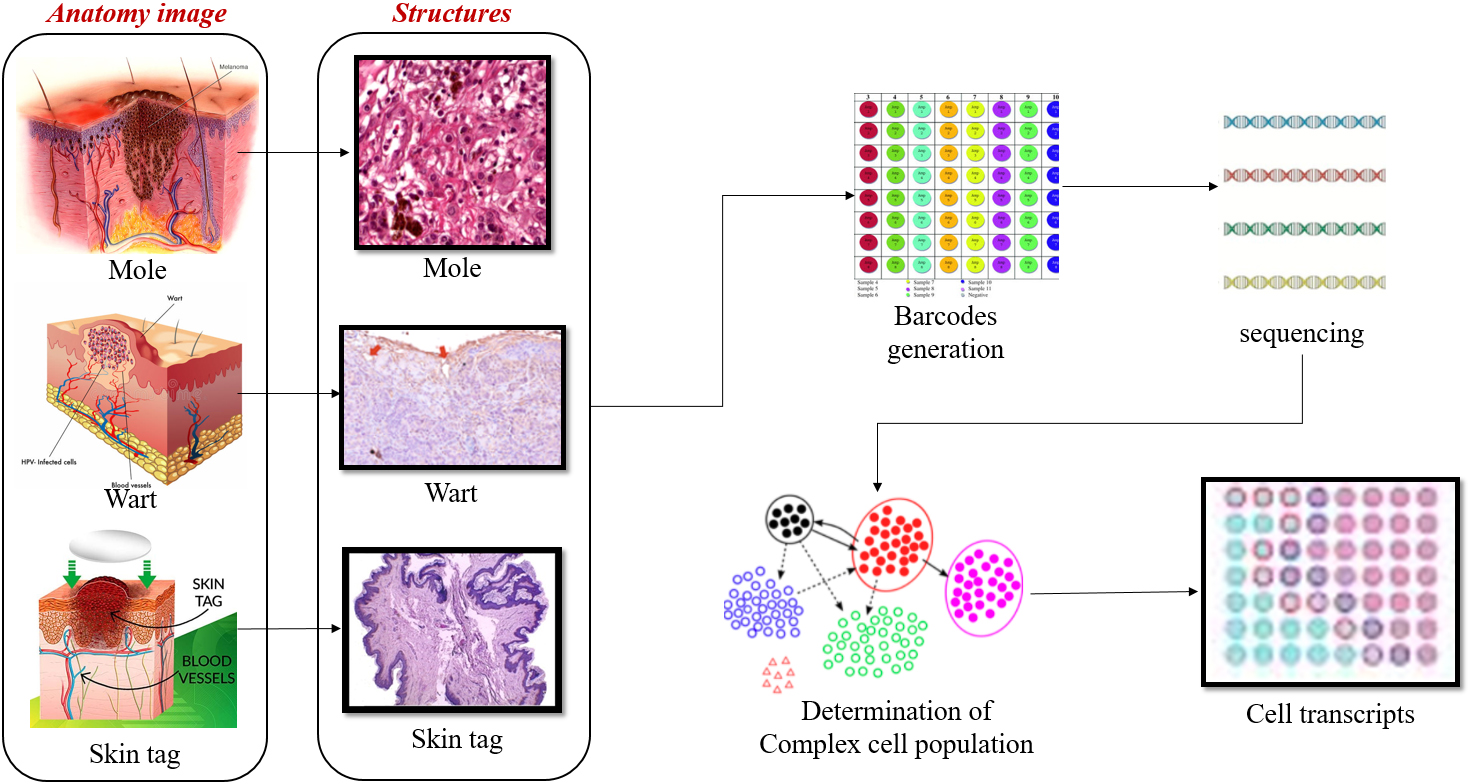
In this Fig. 2, the estimation of the transcriptional patterns of the skin tags, warts, and moles are elaborated. The image of the moles, skin tags and warts are given as the input, and then the image is viewed in the structure of the tissue [17]. Skin tags develop when extra cells proliferate in the epidermis. They are more prevalent in overweight people who have folds of skin because they tend to form is when skin rubs against itself. These tissues are analyzed with the barcodes, and the tissues in the barcode are sequenced to produce the clustering format. DNA sequences from a trademark area of the genome are used in the process known as “barcoding,” which enables species-level identifications. This cell grouping, related to the skin tags, warts, and moles, is separated. Then the differentiation of the individual cell color and the intensity is delivered as the output [18].
Generally, the spatial transcriptomic method assigns cell types to their locations in the histological section. This method is also used to find out the sub-cell place of an mRNA. The spatial distribution of mRNA molecules provides an opportunity to expose heterogeneity in tissues and immune cells and discover transcripts’ subcellular distribution in several considerations. This information allows for a unique chance to decrypt cellular and subcellular design in tissues and individual cells. These methodological analyses allow for essential deep perception in many fields. The capacity to perceive objects in 3 dimensions (containing length, width, and depth) and determine how far away they are is known as depth perception. We know the whole functioning of a cell when only we know the exact location in the body [23].
When the spatial transcriptomic slide is attached to the tissue cryosection. Cryosection is used to provide an immediate diagnosis of a malignant growth or tumour. The method minimises any morphological damage by rapidly freezing the tissue sample. It is also quite effective in finding antigens. The barcoded primers bind and capture the tissue’s adjacent mRNAs. While the mRNA is captured and tissue is attached to the slide. Initialize the mRNA reverse transcription primers and incorporate them with the spatially barcoded array. A codon is a set of three nucleotides found in mRNA that designates a certain amino acid. Thus, the sequence of amino acid residues that makes up a protein is assembled in order using the mRNA sequence as a template. Fixing with buffer methanol, implantation in wax, subdividing into slices of about 5 micrometres in thickness, and stained with eosin and hematoxylin are the most typical methods of regular tissue preparation (H&E). Each spot has a unique color to mention the barcode sequence. Each individual has a million transcripts of primers. Sequencing the data for each mRNA can be mapped back to its spot of origin on the array. The alignment of the collection with a previously captured image of the tissue section allows the spatial analysis of all tissue mRNAs. This determination of the cell population is identified by the sequence of the cells for skin tags, moles, and warts. These cell or tissue identification also can be made by the manual method using the microscopic preparation of the cell division identifications. And then, the tissues of the individual skin type are formed [19].
While processing the image, the specific details regarding the skin’s center point, which can be viewed in the form of the poured in the skin, are done in the existing approaches to lumen detections. This can only be considered in the B-mode ultrasounds [20]. It is used to identify the already capture data from the skin. The tissues and organs of interest are shown as points of changing brightness in a two-dimensional image produced by grey scale scanning in ultrasound. A-mode scans provide a signal with peaks or peaks at the junction of two separate tissues, whereas B-mode scans generate a this double image of the deeper tissues. Measurements of subcutaneous fat thickness have been made using both A-mode and B-mode ultrasonography. Usually, it is seen in the analysis of the endoscopy images.
Automatic lumen detection for detecting mole, wart, and skin tag.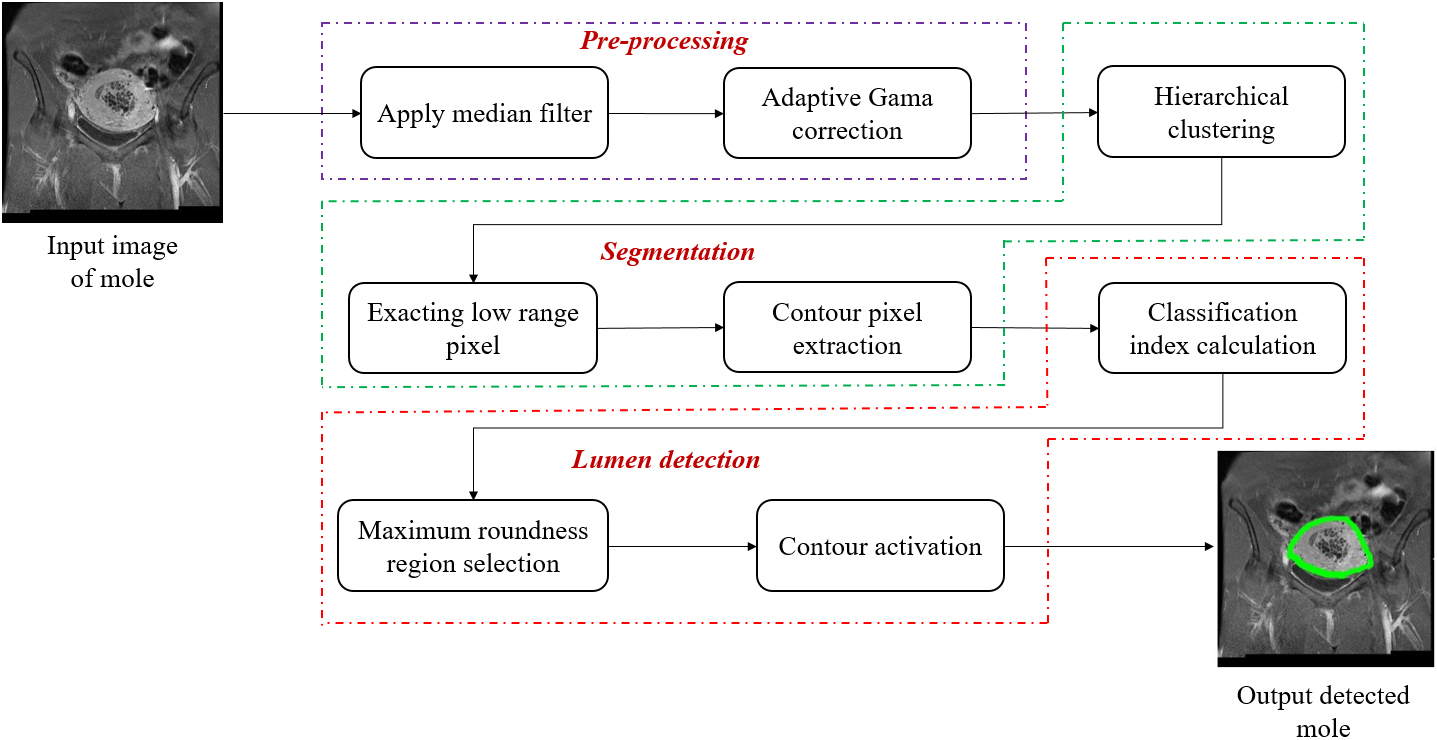
In this Fig. 3, the cells of the mole image are given as the input, and the pre-processing, segmentation, and lumen detection process are elaborated. The pre-processing section applies the filter and then adapts the Gama corrections to the images to the cluster. The process of using a function to change luminance or brightness values is known as gamma adjustment. Typically nonlinear yet monotonic, gamma functions are made to differentially affect the highlights, provides various types, and shadows. The image appears much darker when the gamma value is excessive. The image’s black portions entirely obscure any features there could have been. The high gamma has little effect on the image’s black and white, but it radically alters the colours. And then, the segmentation of the images is done. Often based on the properties of the picture’s pixels, image segmentation is a widely used method in electronic image processing methods to divide an image into various parts or areas. Pre-processing is intended to improve the image data by enhancing certain crucial visual features or suppressing unintentional distortions. In this segmentation, the image extraction process in a low pixel range is executed. Then the pixel extraction is done for the classification of the indexes is done [21]. Then the process of lumen detection is done. The affected region is marked, and the marked area is highlighted with color to show the affected part.
The cellular process that is the cell division and the migration of the cells involves the temporary combination of the cell surfaces. While building this new technology, the structures that analyze the microscopy radiations for the highest resolution of the magnitude and the orientation of cells [22]. The changes in the physical property of heterogeneous mechanical cells are widely used in the nanometre ranges for data analysis. Shape, size, surface properties, and internal structure are the main characteristics of nanoparticles. You may come across nanoparticles as aerosols, solutions, or emulsions. Many methods are used to measure the cellular properties, including the microplates for magnetic cytometry. The raw image is collected, and the image is illustrated using the SIM-MFM approach for finding the pattern orientations. This orientation makes the dipoles donate the specific region to denote the corresponding black number labels. The imaging of the super-resolution mapping is delivered for the nanoscale molecular forces. The SIM method lies in the modulation of the tissue requirements that make the pattern of the skin tissue, which is used to find the illustration of the skin tissues, and the analysis of the cells is done. The evaluation of the rapid analysis of every pixel is done by
Using this formula, the pixel value of the image is found by evaluating this equation. Here, 120, 77, and 137 are the degree of orientation, and Q refers to the loaded images.
Process of finding illumination of structure based on turn-key mapping heterogeneity.
Figure 4 shows the process of finding the structure of skin tags, warts, and the mole using the turn key mapping system. The image is taken in pixel format, and then the identification of where the skin disease is located is made. The segmentation of the affected part is viewed separately using the periodic separation process. Then it reaches the phase resolutions. The phase resolution may be defined as the number of pixel values for the basic resolution of the decreasing phase for the pixel size and the shape of the rectangular pixel. After finding the phase resolution, the frequency of the modulations makes the formation to make the changes in the image identification using the turn-key mapping method.
Resolution is the ability to differentiate one object from other objects. In the input MRI image, the resolution is found by computing the number of pixels. If the image resolution is high, then the image quality is better. So, the image quality is proportional to the resolution. The size of the pixel is calculated by dividing the matrix size. The basic resolution and the phase resolution are the parameters that are used in MRI. The signal-to-noise ratio is directly proportional to the pixel size but indirectly proportional to the basic resolution. The image quality will increase if the basic resolution rises [24]. Similarly, if the phase resolution is increased, then the pixel size of one direction has resulted in a rectangular shape. For each pixel are need to check if they have any abnormalities then. Then we apply the turn-key fashion, which is structured illumination. We were changing 0
Here, the place where the skin tags, moles, and warts are seen or appeared, the color of the skin, symptoms in the body, and the size are taken through a digital survey from the affected person. The questionnaire is given to predict the skin tags, moles, and warts for a quick skin texture analysis. This answer from the digital questionnaire is collected and then stored in the database for future study of the upcoming affected person. Then this redundancy information is neglected and then stored as raw data in the database for the future to identify the skin tags, warts, and moles. The periodic table is used in the identification of the skin tags etc. The molecule’s combination is analyzed, and then it is compared to the periodic table, and then the skin disease is identified. This is how the pre-defined data set is used to determine the data set is done [25].
Statistical analysis based on the digital survey collected from the affected person.
Figure 5 in the diagram mentioned above 5, the digital survey is used to collect some of the answers to the in-built questionnaire from the person who is already affected by skin tags, warts, and moles. Hence feature analysis will be quite easy to predict skin diseases. Also, The periodic table is used to analyze skin diseases. Descriptive research is used to measure the variance and the tendency. Then the interference of the population of the people, the number of samples collected for the questionnaire, and the range of each skin disease are analyzed. Then, the predictive analysis separates skin disease using the periodic table classifications.
A Random Forest (RF) algorithm was used to forecast the problems. The model’s growth was established with the intention of an election and a forest. There, each tree in the woods represents a voter. The set of votes and percentages by category is the basis for making the final decision by the algorithm. For each tree, RF implements the bagging method to generate a randomly trained dataset. The splitting features are also semi-randomly selected by the RF. The possible splitting features space provides a random subset of a specified proportion. RF’s algorithm is illustrated below.
Here the bagging method creates several training datasets from the sample dataset, with the final result being based on the majority voting. Initially, generate the N-number of random records that have a k dataset. For each sample, the decision tree is constructed, and the output of each decision tree is generated. The final result depends on the majority of voters for classifying the image dataset.
The Internet of Medical Things (IoMT) collects medical devices and applications that connect to healthcare IT systems through online computer networks. It tracks the real-time location of medical equipment like wheelchairs, defibrillators, nebulizers, oxygen pumps, and other monitoring equipment. The lumen is the SI-derived unit of luminous flux, a measure of the total quantity of visible light emitted by a source per unit of time. The proposed system focuses on a Retracing-efficient IoT model for identifying the moles, skin tags, and warts using Automatic lumen detection with the help of IoT-based Variation regularity. Automatic lumens detection model with endoscope and simulation datasets showed great precision and recall. This integrated approach, which coordinates the lumen detection algorithm with alignment control, might improve the effectiveness and performance of capsule colonoscopy. The variation regularity is concerned with the asymptotic behavior of a real function of a real variable x which is ‘close’ to a power of x. Such functions are much more than a convenient extension of powers. The trigonometric R method is a method of rewriting a weighted sum of sines and cosines as a single instance of sine. This paper has provided the factors are intensity, target group, classification accuracy, and correlation performance. This approximate result is 75% efficient Table 2.
The intensity and edge width based on moles, skin tags, and warts analysis
The intensity and edge width are based on moles, skin tags, and warts. Specifically, the edge width of W is the minimum number of edges in a non-contractible cycle in W. the edge width column can be used to set visual properties of the edges similarly as you have done for vertices.
The intensity and edge width based on moles, skin tags, and warts analysis.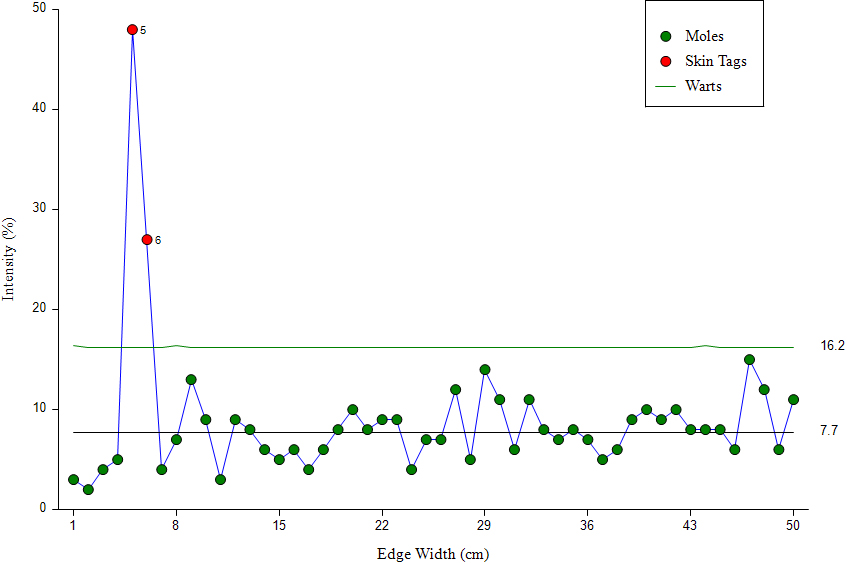
Given the graphical representation is intensity and edge width, The intensity is the quality of being very strong, concentrated, or difficult or the degree to which something is difficult or strong. For the Fig. 6 example, intensity is the ability to run miles on end at a top speed. This graph comparison result is moles, skin tags, and warts. This graph’s approximate result is 21.2% efficient Table 3.
The image group compared with the target groups for moles, skin tags, and warts
The image group with the target groups for moles, skin tags, and warts, Moles are flesh- to brown-colored macules, papules, or nodules composed of nests of melanocytes or nevus cells; skin tags are small, noncancerous growths that tend to be the same color as your skin and the common wart may appear as a popular growth with an irregular contour and surface.
Image count with the target groups by the total samples rate (wart alone).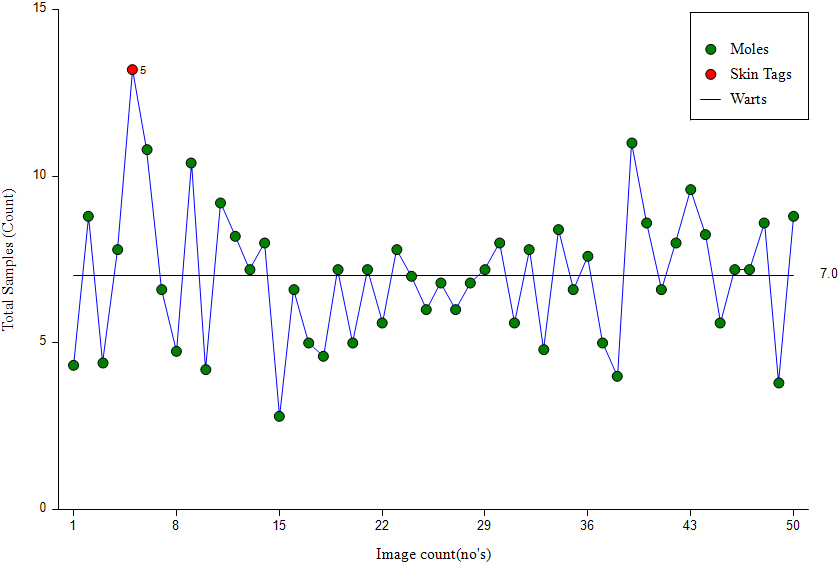
The pixels analysis for intensity with wavelength and intensity with time
As shown in Fig. 7, image count with the target group’s graph, image Count refers to the number of pixels contained in an image sensor or that a captured photograph is made up of. Target groups are moles, skin tags, and warts. The image count with the target group’s comparison result is compared to moles, skin tags, and warts; these approximate result is 32.2% efficient Table 4.
Intensity is equal to power unit multiplied by lumen area. The pixel analysis for intensity with wavelength and intensity with time, the passion is the quality of being very strong, concentrated, or difficult, or the degree to which something is difficult or strong. Wavelength is the distance between identical points in the adjacent cycles of a waveform signal propagated in space or along a wire.
The intensity with wavelength is described as the shorter the wavelength, the greater the energy per photon. The intensity is the total energy per time arriving in a unit area. The SI units are Watts/meters
The coded image with the periodic classification based on image count and classification accuracy
Where
The coded image with the periodic classification based on image count and classification accuracy, Periodic classification of elements is the method by which components are grouped based on their characteristics. A coded image is a process for representing an image with other representations because of reducing data for storage and/or transmission of this image.

Pixels analysis of intensity with wavelength and time.
The coded images with periodic classification, this graphical representation is based on image count and classification accuracy; classification accuracy is a metric that summarizes the performance of a classification model as the number of correct predictions divided by the total number of predictions. This Fig. 9 comparison’s approximate result is 46.6% efficient Table 6.
The resolution of image and correlation performance analysis of lumen detection
Coded images with the periodic classification.
Correlation performance analysis of lumen detection graph.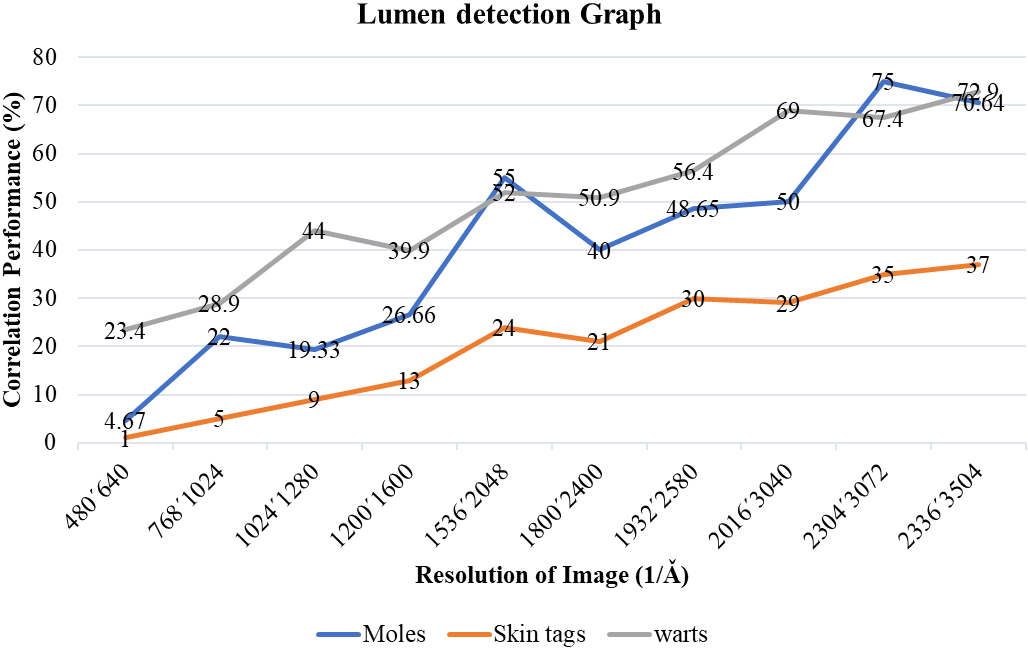
The resolution of the image and correlation performance analysis of lumen detection describes the image’s level of detail – higher resolution means more image detail. In digital imaging, the resolution is often measured as a pixel count, and the sign in a correlation tells you what direction the variables move. Two variables are move in the same direction are a positive correlation, and variables are move in the opposite direction are a negative correlation. Zero and one is a correlation.
Figure 10, The correlation performance analysis of lumen detection, the cavity of a tubular organ or part of the lumen of a blood vessel, and a unit of luminous flux equal to the emitted light. The emitted light is a unit solid angle by a uniform point source of one candle intensity. This graph comparison result is compared to the resolution of image and correlation performance; this approximate result is 23.25% efficient.
The proposed system Retracing-efficient IoT model for identifying the moles, skin tags, and warts using Automatic lumen detection with the IoT-based Variation regularity faced various challenges such as sharing information and increased cost of skincare, the merging of patients and doctors with the latest technology to improve communication. This study investigates the dataset images by identifying the moles, skin tags, and warts from the existing data sets and creates the IoT model with the trigonometric algorithm for imaging and analysis. The functional description of the proposed system is obtained, and the IoMT-based moles, skin tags, and warts prediction are established by applying the Statistical analysis. The Periodic classification is employed for predicting the results. The Automatic lumen detection approach provides a general methodology that integrates feature-based criteria and domain knowledge for the detection concern. From the comparison of several features, it can be concluded that the positive contrast provides excellent capabilities. The proposed method offers a brilliant automatic lumen detection method that is a robust, low-cost, and effective IoMT-based skin surveillance system, replaces manual work, is less weak to human error, providing a consistent route to forecast the performance. The achieved results indicate that the proposed result fulfills the requirement. This technique proposed a new method for automatic lumen detection.
Moreover, it is an excellent method of identifying skin diseases compared to other existing methodologies. The inference result is formalized as given below for a retracing-efficient IoT model for determining the moles, skin tags, and warts using automatic lumen detection with the help of IoT-based variation regularity. The intensity and edge width are based on moles, skin tags, and warts edge width level is 3.5% to 45%. The heightened intensity accuracy range is 56.2%. The image group with the target groups for moles, skin tags, and warts image count is 500 to 10000. The enhanced low-level total sample accuracy range is 95.9%. The pixel analysis for intensity with wavelength and intensity with time wavelength level is 4.2% to 54.6%, and the increased intensity accuracy range is 70.9%. The coded image with the periodic classification based on image count and classification accuracy image count is 500 to 10000, and raised classification accuracy range is 87%. The resolution of image and correlation performance analysis of lumen detection resolution image pixel is 480
Footnotes
Conflict of interest
The authors have no conflicts of interest to declare.