
Abstract
The numerous security loopholes in the design and implementation of many IoT devices have rendered them an easy target for botnet attacks. Several approaches to implement behavioral IoT botnet attacks detection have been explored, including machine learning. The main goal of previous studies was to achieve the highest possible accuracy in distinguishing normal from malicious IoT traffic, with minimal regard to the identification of the particular type of attack that is being launched. In this study, we present a machine learning based approach for detecting IoT botnet attacks that not only helps distinguish normal from malicious traffic, but also detects the type of the IoT botnet attack. To achieve this goal, the Bot-IoT dataset, in which instances have main attack and sub-attack categories, was utilized after performing the Synthetic Minority Over-sampling Technique (SMOTE), among other preprocessing techniques. Moreover, multiple classifiers were tested and the results from the best three, namely: J48, Random Forest (RF), and Multilayer Perceptron (MLP) networks were reported. The results showed the superiority of the RF and J48 classifiers compared to the MLP networks and other state-of-the-art solutions. The accuracy of the best binary classifier reported in this study reached 0.999, whereas the best accuracies of main attack and subcategories classifications reached 0.96 and 0.93, respectively. Only few studies address the classification errors in this domain, yet, it was assessed in this study in terms of False Negative (FN) rates. J48 and RF classifiers, here also, outperformed the MLP network classifier, and achieved a maximum micro FN rate for subcategories classification of 0.076.
Introduction
Undeniably, the Internet of Things (IoT) has become one of the core components of the Internet, as numerous organizations worldwide regard the seamless integration of IoT devices into their business infrastructure as a top priority. According to recent statistics, the number of active IoT devices will reach nearly 64 billion by 2020 [20]. With the accelerating rate of IoT devices deployment, the security risks, vulnerabilities, and threats will multiply, jeopardizing the integrity and soundness of countless systems worldwide. To further deepen this risk, a substantial proportion of IoT devices, used nowadays, fail to comply with security standards [23].
As many IoT devices do not adhere to security standards, they have become one of the easiest targets for botnet attacks. These attacks penetrate and recruit vulnerable IoT devices to create a massive network of “zombies”, which is controlled remotely by a “Bot master” and can generate dangerous malicious attacks against other online resources. Based on the Bad Bot Landscape 2019 report, in 2018 bot traffic, either benign or malicious, comprised 37.9% of the Internet traffic [7]. In recent years, IoT botnet attack threats have evolved remarkably. For example, almost 63 advanced versions of the Mirai botnet malware were reported since 2016 [30]. IoT botnets were also the cause of one of the most massive Distributed Denial of Service Attacks (DDoS) in recent history, which lasted 13 days [2].
Artificial intelligence in general, and machine learning, in particular, have been increasingly deployed to help detect and combat abnormalities in several mission-critical applications like Aerospace systems control, Electric grid management, and Nuclear reactor safety systems, to mention few [12,13,18,19]. Machine learning has been also applied in detecting and combating network attacks, including but not limited to IoT botnet attacks. Several machine learning approaches were applied to this problem, including Support Vector Machines (SVMs), neural networks, and decision trees. The main goal of previous studies was to achieve the highest possible accuracy in distinguishing benign from malicious IoT traffic, with minimal regard to the identification of the type of attack that is being launched. Another limitation was the lack of a proper realistic IoT botnet dataset, until the recent introduction of the Bot-IoT dataset reported in [25], which comprises legitimate and malicious IoT traffic. Malicious traffic in this dataset is classified into main categories, and each main category is further classified into subcategories. The dataset has several limitations, including being massive and imbalanced among other issues. Most recent studies that utilized the Bot-IoT dataset did not address its imbalanced nature.
In this study, we utilize machine learning to detect IoT botnet attacks, while not only distinguishing benign from malicious traffic, but also the categories and subcategories of the IoT botnet attacks reported in the Bot-IoT dataset. This study also aims at reducing the False Negative (FNR) rate; which designates attack instances not detected by the classifier. This metric is crucial for the proper operation of a given system; letting even few attack instances into the network may have devastating consequences on its operations. Moreover, a subset of the Bot-IoT dataset is compiled using proper preprocessing operations to clean it and address its imbalance. Multiple feature selection strategies and classification approaches were tested, and the ones that achieved the best results were reported. Using 19 out of the original 46 features from the Bot-IoT dataset, the accuracy rate of 0.999 in classifying benign from malicious traffic was achieved. Furthermore, the accuracies of main categories and subcategories classification reached 0.96 and 0.93, respectively. Only a few studies addressed main and subcategories classification, and experiments showed the superiority of the models proposed in this study compared to one of the best state-of-the-art classifiers. While the accuracy of this classifier reached 0.95 for normal and Reconnaissance classes, and 0.88 for the Information Theft class; the accuracy of the Random Forest (RF) classifier presented in this study, achieved almost 0.999 for normal and Reconnaissance classes and 0.95 for the Information Theft class. In terms of classification errors, J48 and RF classifiers achieved a maximum and a minimum micro FN rates of 0.076 and 0.001, respectively. In this study, it is assumed that no solution-relevant processing is performed on the IoT devices themselves, instead, it is assumed that packet traces are mirrored to a separate device that implements the proposed detection mechanism.
This paper is organized in the following manner: Section 2 sheds light on IoT botnets and highlights some common IoT botnet attacks, while Section 3 depicts recent studies and approaches that address IoT botnet detection. Section 4 illustrates the approach deployed in this study with emphasis on the construction of the dataset and its preprocessing and preparation. Section 5 presents and discusses the results obtained from the experimentation conducted in this study. Finally, the conclusions and future directions are illustrated in Section 6.
Background
An IoT botnet is a network of infiltrated smart devices and appliances known as “Bots” or “Zombies” that are remotely controlled by one or more servers known as the “Bot-master”, which perform malicious actions through a Command and Control (C&C) server. The “Bot-master” uses common communication channels, alongside network protocols such as IRC and Hypertext Transfer Protocol (HTTP), to communicate with the bots [11].
In order to create a functional botnet, the “Bot-master” performs a sequence of functions, split into 3 phases; namely the scanning phase, the recruiting phase, and the operating phase, as shown in Fig. 1. In the scanning phase, the “Bot-master” scans the Internet for vulnerable IoT devices and exploits their weaknesses in order to penetrate them. To achieve its goal, the “Bot-master” uses several penetration methods, such as dictionary, phishing, worm, and Trojan attacks [1]. In the recruiting phase, the “Bot-master” hijacks the compromised devices by injecting malware into them via classical protocols such as HTTP, File Transfer Protocol (FTP), or some peer-to-peer protocol. The injected malware comprises binaries that once executed on the victim IoT devices would connect them to the “Bot-master”, thus making them part of the botnet. In the last phase, each bot receives the commands from their “Bot-master” and executes them. Moreover, the “Bot-master” maintains its bots in this phase and tries to protect them from being detected [4,11,22].
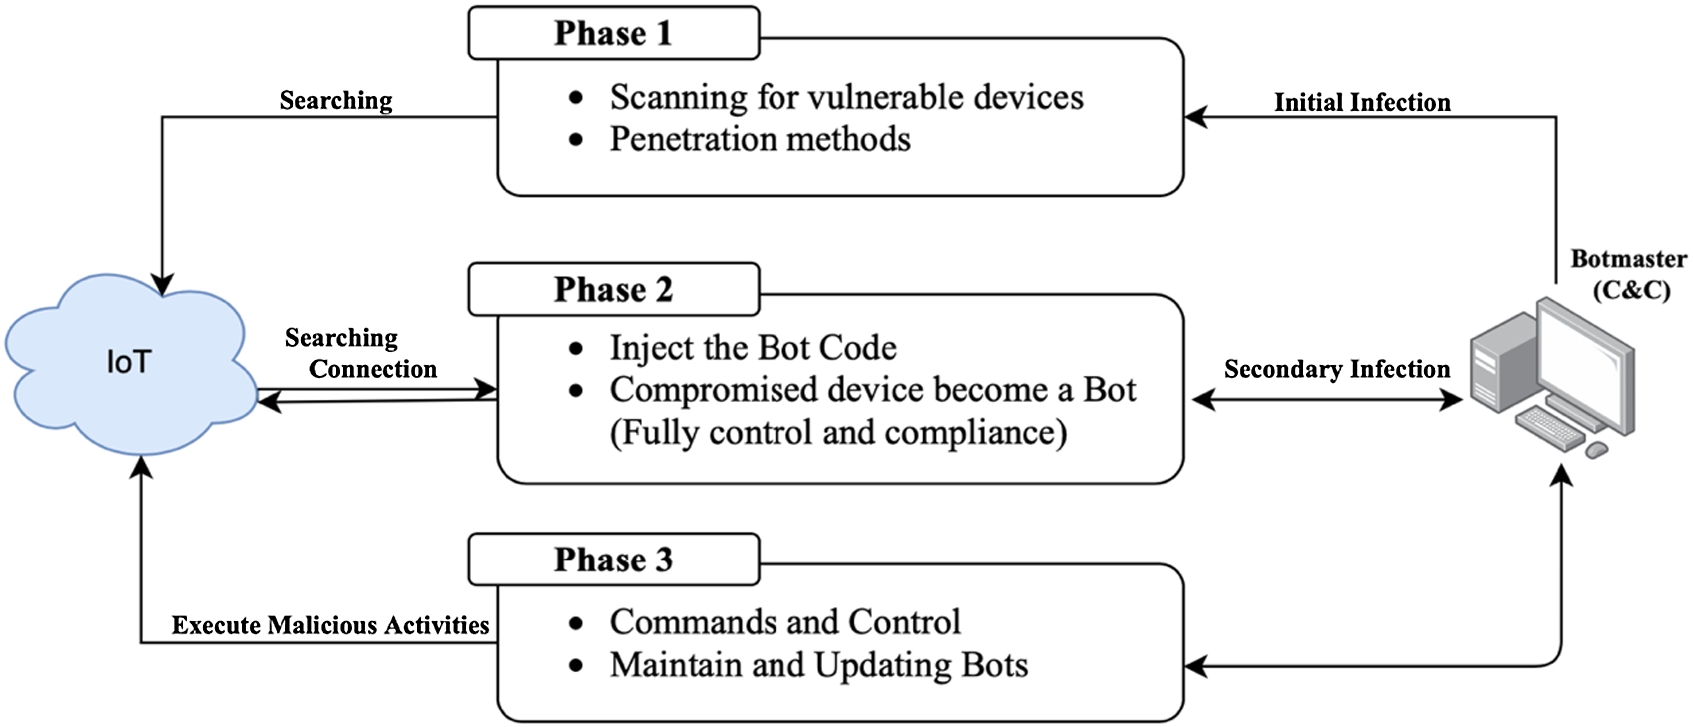
Botnet lifecycle.
IoT botnets have been utilized to launch several types of attacks. Here we shed light on some of these attacks, namely: Reconnaissance, Denial of Service, and Information Theft. Reconnaissance attacks aim at gathering information about victims by scanning online devices. This type of attack is also called fingerprinting and helps the attacker learn the vulnerabilities that could be used to perform breaches. Reconnaissance activities can be either passive or active, where passive Reconnaissance means capturing packets from the network traffic in a hidden manner. In active Reconnaissance, on the other hand, the attacker sends messages to the victim’s system to monitor its responses. This type of attack can be further classified into service fingerprinting/Port scanning and OS fingerprinting [25,29]. In service fingerprinting, the attacker tries to identify the services running on system’s ports (0-65535), whereas in OS fingerprinting, the attacker aims at identifying the operating system and platform-relevant information of the victim’s machine.
In Denial of Service (DoS) attacks, the aim is to disrupt a service by preventing authorized users from getting access to it. A recent variant of this attack is widely known as Distributed Denial of Service (DDoS) attack. In this attack, a group of compromised machines, or bots, generate massive amounts of network traffic targeting one or more victim servers. They overload the victims and deprive legitimate users from accessing them. While some DoS/DDoS attacks aim to disrupt services by consuming network bandwidth and/or overflow the designated victim machine with voluminous traffic, other DoS/DDoS attacks aim at exhausting the computational resources at the victim machine via establishing numerous application-layer sessions and/or issuing several compute-intensive requests [8,29].
In some Information Theft attacks, commonly known as Data Theft attacks, the aim is to harvest the victim’s confidential data. Alternatively, the victim’s keystrokes might be the target, where all victim’s keystrokes are communicated over the network to the attacker. This form of attack is commonly known as Keylogging [25].
Several recent studies explored the utilization of machine learning in order to help detect IoT botnet attacks. In this section, we shed light on some of the state-of-the-art related work.
Artificial Neural Networks (ANN) were utilized in the study depicted in [34] to detect DDoS attacks. As the Bot-IoT dataset is imbalanced, Synthetic Minority Over-sampling Technique (SMOTE) was used to increase the number of normal instances to match the size of DDoS records. The number of normal traffic instances became about 1.3 million for training, and about 656,000 for testing. The proposed system performed only binary classification, and was trained using 66% of the dataset and tested with the remaining 34%. Only 41 features were used from the original set of 46 features. The results showed that using the SMOTE technique, the detection accuracy for the DDoS attack was almost 100%.
The work depicted in [24] introduced a novel network forensics framework for discovering and tracing cyber-attacks in IoT networks using a Multi-layer Perceptron (MLP) neural network. Particle Swarm Optimization (PSO) was utilized for feature selection, where 13 out of the original 46 features from the Bot-IoT dataset were used. This solution performed binary classification with high accuracy and rather small False Positive (FP) and False Negative (FN) rates.
In the study depicted in [16], Ferrag et al. evaluated seven deep learning strategies split into two groups; the first of which comprised Recurrent Neural Networks (RNN), Deep Neural Networks (DNN), and Convolutional Neural Networks (CNN), whereas the second group comprised Boltzmann Machines (RBM), Deep Belief Networks (DBN), Deep Boltzmann Machine (DBM), and Deep Auto-encoder (DA). The study utilized both the Bot-IoT and the CSE-CIC-IDS2018 datasets, and showed the superiority of the CNN as it achieved the best binary classification accuracy rates and training times.
Baig et al. [9] proposed a framework to detect DoS IoT botnet attacks in wireless sensor networks (WSNs), using two approaches to combine the classification outcomes of a one-dependence (A1DE) and two-dependence (A2DE) estimators. In the first approach, designated as voting, the average of both estimators was considered, while in the second approach, referred to as multi-scheme, the outcome of either one of both estimators was considered. The proposed framework was compared to other classifiers, including A1DE, A2DE, Naïve Bayes, Bayesian Network, C4.5, and MLP networks. This study also utilized the Bot-IoT dataset, where only 477 normal samples and 3,668,045 attack samples were used. The experiments showed that using only 5 of the original features, the performance of the multi-scheme and A2DE classifiers was approximately the same in terms of detection accuracy. The multi-scheme classifier took significantly longer to train. Yet, it outperformed other classifiers in terms of accuracy.
Ansam et al. [6] introduced a Hybrid Intrusion Detection System (HIDS) that aimed at improving the binary classification accuracy of detecting IoT attacks. The proposed system deployed a boosting approach to combine the outcomes of two classification modules; a signature-based module and a behavioral module. The signature-based module, comprised a decision tree that utilized footprints of well-known IoT botnet attacks. The behavioral module, on the other hand, consisted of a One-class SVM that utilized only 13 of the original 46 features in the Bot-IoT dataset. Experiments showed that the detection accuracy using only the signature-based module was 93.30%, while it reached 92.50% for the behavioral module. The accuracy of both modules combined reached 99.97%.
Other recent studies that evaluate and contrast several machine learning approaches to detect IoT botnet attacks do exist. The reader is referred to the work depicted in [3,5,15,17,21,26–28,33], for further references. Most state-of-the-art approaches perform binary classification, without considering the detection accuracy of individual attack categories and their subcategories, or simply focus on the DoS/DDoS attacks. This justifies the remarkably high detection accuracy rates reported in several studies. Other drawbacks witnessed in recent work are the failure to address the imbalanced nature of the Bot-IoT dataset, as well as focusing mainly on the detection accuracy rate while paying much less regard to other crucial performance indicators, like false positive and false negative rates.
Methodology
This section describes the proposed approach and sheds light on the subset of the Bot-IoT dataset utilized for training the models chosen for classification. It also illustrates the feature engineering and feature selection techniques applied to the dataset.
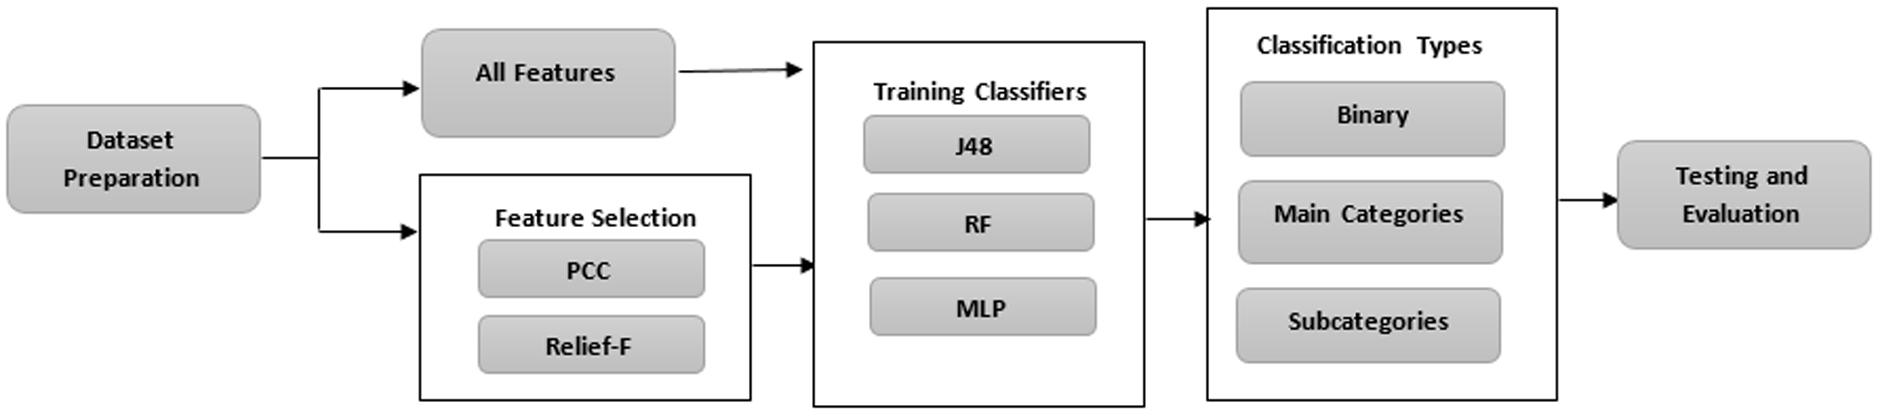
As illustrated in Fig. 2, a subset of the Bot-IoT dataset was generated and preprocessed. Next, two separate paths were explored; the first path considered 19 of the original 46 features, while the other comprised applying two feature selection techniques, namely: Pearson’s Correlation Coefficient (PCC) and Relief-F. For each path, three classifiers were utilized: J48 decision tree, Random Forest (RF), and Multi-Layer Perceptron (MLP) neural network. Each classifier was tested and evaluated for three scenarios: binary classification and two multi-class classification scenarios: one for main attack categories and the other for attack subcategories. This multi-tier classification approach aligns with the multi-tier labeling of attacks in the Bot-IoT dataset. Each of the trained classifiers was tested and evaluated, after that, in terms of accuracy, F-measure, and False Negative (FN) rates.
The original Bot-IoT dataset comprises two main classes of traffic, legitimate, and abnormal (or attack). The attack traffic is further split into three main attack categories, namely Reconnaissance, Denial of Service, and Information Theft. Each main attack category is further split into attack subcategories. The Reconnaissance attacks are split into OS fingerprinting and service scanning, while the Denial of Service attacks are split into DoS and DDoS attacks, with further subcategories for both attack types. The Information Theft attacks are classified into keylogging and Data Theft. Figure 3 visualizes the composition of the Bot-IoT dataset.
Methodology plan.
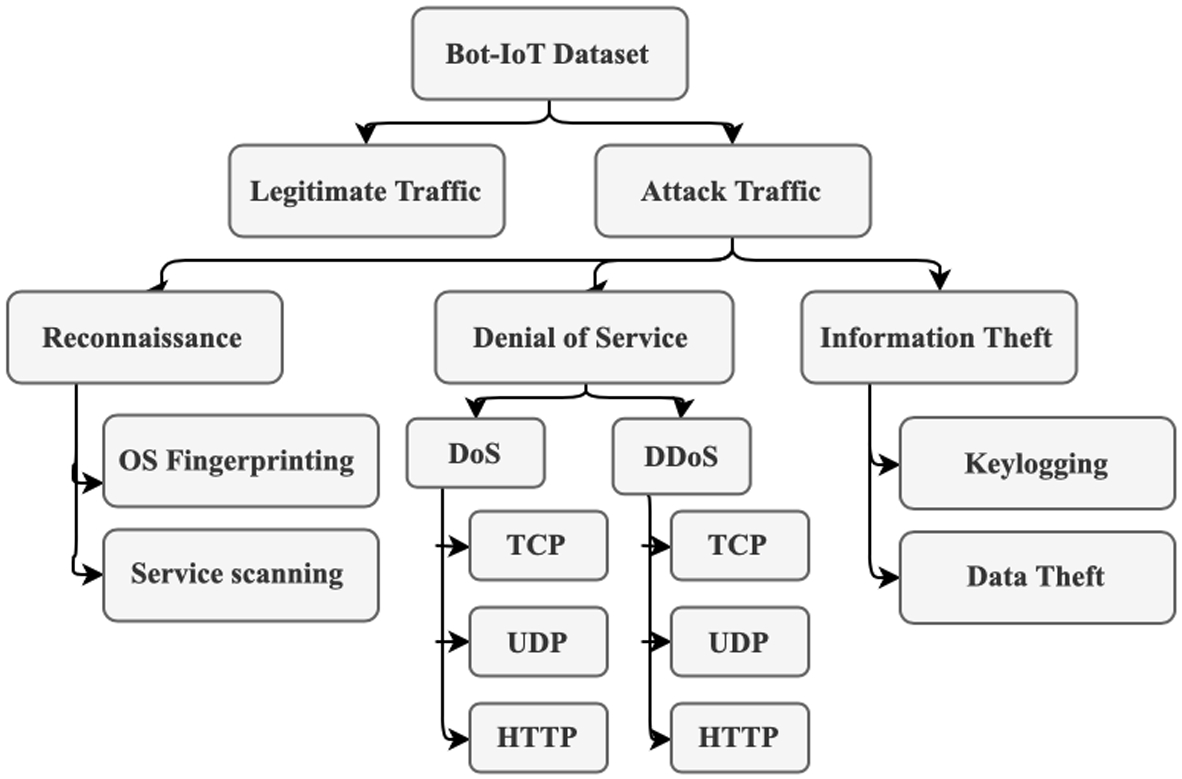
Attack composition of the Bot-IoT dataset.
A sub-dataset comprising 106952 instances from the Bot-IoT dataset, with all 46 features, was assembled. All normal instances from the original dataset were included in the sub-dataset and formed almost 9%, and the remaining 91% of instances pertained to the various attack categories. Figure 4 visualizes the percentages of normal and attack classes within the Bot-IoT sub-dataset, and emphasizes its imbalance. While some attack categories, like service scanning and DoS and DDoS UDP attacks, comprise sizable percentages, other attack categories are much less represented. For example, the Data Theft attack, which is the least represented attack in the dataset, comprises only 0.1% of the instances. DoS and DDoS HTTP attacks are also underrepresented and comprise only 2.8% and 1.8% of the instances, respectively. DDoS/UDP and DDoS/TCP attacks, however, comprise almost 1/3rd of the instances.
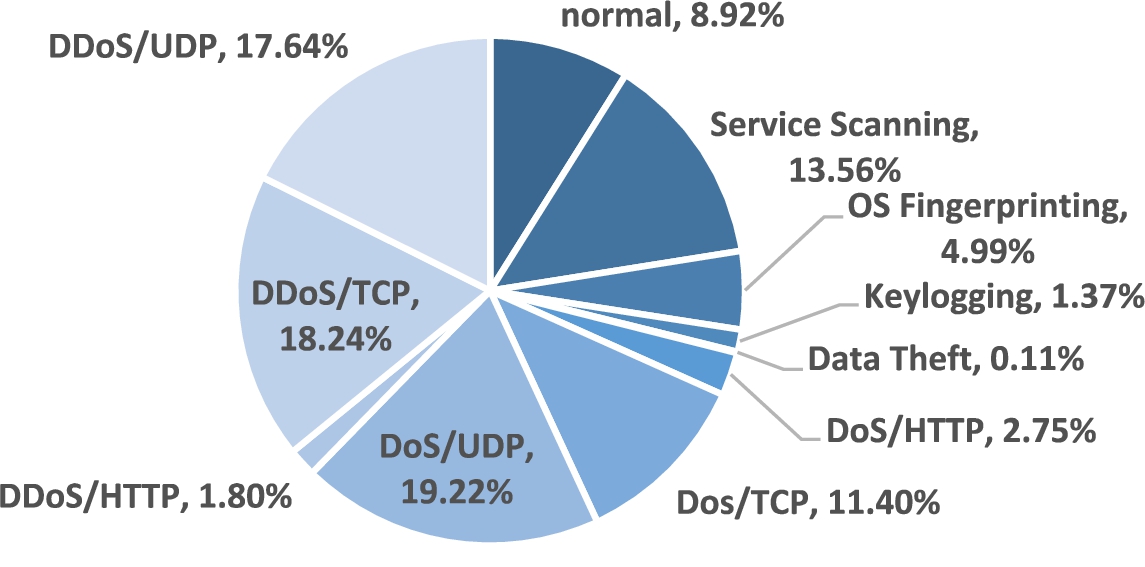
Attack categories distribution within the Bot-IoT sub-dataset.
Next, duplicate and missing values were resolved using the “RemoveDuplicated” and “ReplaceMissingValues” tools from the Weka data preparation library [32]. Missing values, in each feature, were replaced by the mean of the remaining values from the same feature. A remaining issue with the sub-dataset was its imbalanced nature. As illustrated in Fig. 4, Information Theft instances comprise a much smaller percentage of the sub-dataset, thus, the SMOTE technique [10], was applied to help resolve this issue. For each under-represented (or minority) class, the SMOTE technique produces several synthetic instances via applying a computational procedure. These synthetic instances were used only in the training phase for each of the classifiers. The number of synthetic instances is randomly chosen depending on the amount of over-sampling required. For the purpose of this study, SMOTE was used to increase the instances of the Data Theft class by 900%. Thus, this sub-category instances increased to 1180, and the total number of instances became 108014.
All features of the original Bot-IoT dataset are reported in [26]. As instances represent network flow statistics, some of their features can be eliminated without jeopardizing the quality of the classification process. After labeling each instance with its attack category and subcategory, features pertaining to the flow identity, like the IP addresses and port numbers of the flow’s endpoints, become useless and can thus be eliminated. Similarly, features pertaining to the flow start time, end time, and duration were eliminated together with the features like pkSeqID, state_number, flgs_number, proto_number and Seq. As a result, 19 of the original features of the Bot-IoT dataset were selected as depicted in Table 1.
The set of utilized features
Feature selection, in machine learning, helps improve the quality of classification via eliminating redundant or irrelevant features that would otherwise hinder the quality of classification. Elimination of such features also helps reduce training and classification times which is instrumental for datasets cursed with dimensionality. Several feature selection techniques exist in the literature; some of which are filter-based that rank features according to their relevance in classifying instances. Other techniques, referred to as Wrapper methods, deploy search algorithms that feed different subsets of features to their built-in learning methods and produce the best-performing features. Wrapper methods’ computational cost motivated the development of embedded feature-selection methods which try to produce relevant subsets of features while combating the cost of the exhaustive search. Due to the cost of exhaustive feature subset search, two filter-based methods were chosen: namely Pearson’s Correlation Coefficient (PCC) [14] and Relief-F [31]. The top 15, 10, and 5 features were chosen from PCC and Relief-F techniques, which produced 6 variants of the sub-dataset, in addition to the original sub-dataset with all 19 features.
This section describes the experiments that were conducted using three classifiers, J48, RF, and MLP. It also depicts and discusses the results of these experiments.
Experiments were conducted with several classifiers, and according to their results, the best performing classifiers were J48, RF, and MLP. Each classifier performed three types of classification on each variant of the sub-dataset: binary, main categories, and subcategories classifications. Moreover, the three types of classification were done on the original sub-dataset. Thus, each of the three classifiers performed 21 experiments in total. In each experiment, the accuracy, f-measure, and FN rates were measured.
Table 2 through Table 4 illustrate the performance of the binary, main categories, and subcategories classifications of the three classifiers in terms of accuracy and f-measure using the top 5, 10, and 15 features selected by PCC and Relief-F techniques, in addition to all 19 features. Table 2 depicts the binary classification results and shows that the best accuracy and f-measure values for each classifier were reported while using all or 15 features. It can be also noticed that the performance of the three classifiers using the top 10 and top 15 features were comparable and outperformed the performance obtained using only the top 5 features. Moreover, the performance of PCC and Relief-F feature selection techniques is rather comparable, yet, Relief-F appears to perform slightly better.
Table 3 illustrates the results of the main categories classification of all three classifiers, and shows that the best accuracy and f-measure values for each classifier were reported while using all 19 features. It can be also noticed that the performance of the J48 and RF classifiers using the top 15 features outperformed their performance using the top 10 and top 5 features, and was comparable to using all features. For the MLP network, however, the best performance was obtained using the top 10 features, but that was also comparable to the performance using all 19 features. Again, the performance of PCC and Relief-F feature selection techniques was rather comparable, yet, Relief-F appears to perform slightly better.
Table 4 depicts the results of subcategories classification of all three classifiers, and shows that the best accuracy and f-measure values for J48 and RF classifiers were reported while using all 19 features. It can be also noticed that the performance of the J48 and RF classifiers using the top 15 features outperformed their performance using the top 10 and top 5 features, and was comparable to using all 19 features. For the MLP network, however, the best performance was obtained using the top 15 or 10 features, and exceeded the performance obtained from using all 19 features. Table 4 also shows that the performance of the PCC feature selection technique exceeded that of the Relief-F technique.
Binary classification performance using Pearson’s correlation coefficient and Relief-F techniques
Binary classification performance using Pearson’s correlation coefficient and Relief-F techniques
Main categories classification performance using Pearson’s correlation coefficient and Relief-F techniques
Subcategories classification performance using Pearson’s Correlation Coefficient (PCC) and Relief-F techniques

Best accuracies for the three classifiers.
To contrast the performance of the classifiers, Fig. 5 depicts the best accuracies obtained for the three classifiers with PCC and Relief-F feature selection techniques, and also with all 19 features. It shows the superiority of the J48 and RF classifiers compared to the MLP classifier across almost all experiments. While all classifiers were almost 100% accurate for binary classification, their accuracy dropped in main categories classification, and dropped even further in subcategories classifications. For binary classification, while J48 and RF accuracies were near perfect (i.e. almost 1), the accuracy of the MLP classifier did not exceed 0.97. According to Fig. 5, in main categories classification, the best accuracies of the J48 and RF classifiers were 0.960 and 0.963 respectively, while the accuracy of the MLP classifier did not exceed 0.79. For subcategories classification, the accuracies of the J48 and RF classifiers were almost 0.93, but the accuracy of the MLP classifier did not exceed 0.73.
The False Negative rate is also crucial for assessing the error of a given classifier, and there are two well-known types of it: the macro FN rate, which we denote by (Macro-FN) and the micro FN rate, which we denote by (Micro-FN). While Macro-FN designates the arithmetic mean of the FN rates for all classes, and thus implies that all attack classes are equally important, Micro-FN designates the weighted mean of those values. It implies that errors in classifying more frequent attacks have higher penalties than errors in classifying less frequent attacks. Both types of error were calculated for each classifier in each type of classification; Fig. 6 depicts the Macro-FN rate and its standard deviation for all classifiers using all features and spanning binary (Binary), main categories (Main), and subcategories (Sub) classifications. The Micro-FN rates of these classifiers, on the other hand, are depicted in Fig. 7.
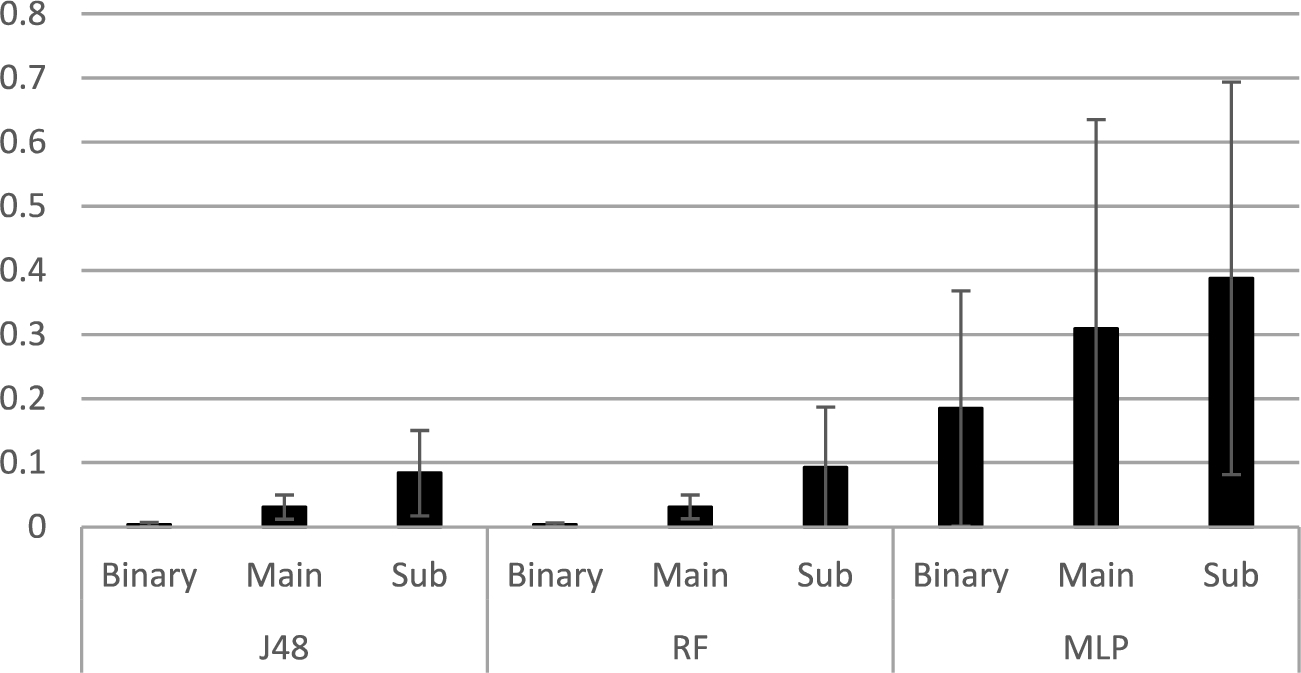
Macro False Negative Rates for J48, RF, and MLP classifiers with their respective standard deviations.
As Fig. 6 shows, the FN rate for each classifier increases from binary to main categories, and subcategories classifications. This is intuitive given that the probability of assigning an instance to its correct class decreases as the number of classes increases. It is also noticed that the J48 and RF FN rates are lower than the MLP network rates. While J48 and RF errors do not exceed 0.1 in the worst case, the MLP network FN rate for binary classification reached almost 0.2 and almost doubled for the subcategories classification. Standard deviation values, as depicted by the error bars in Fig. 6 are high, relatively speaking. This implies that Macro-FN is not representative of the overall performance of classifiers. This is mainly attributed to imbalanced nature of the sub-dataset(s).
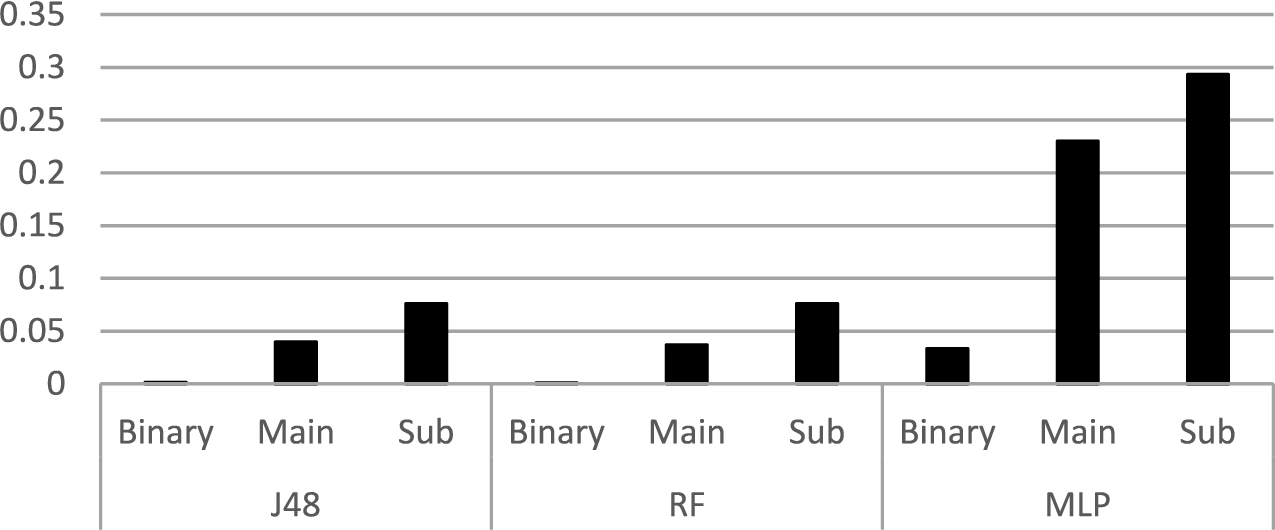
Micro False Negative Rates for J48, RF, and MLP classifiers.
Figure 7 offers an alternative perspective on the classification errors of the three classifiers provided by micro FN rates. As the figure shows, J48 and RF still perform better than MLP network, with a maximum and a minimum micro FN rates just about 0.076 and around 0.001, respectively. The MLP network micro FN rate, on the other hand, ranged from 0.03 for binary classification to almost 10 times fold for subcategories classification. It is noticed that the micro-FN rates are smaller than their respective macro-FN rates, due to the fact that errors that correspond to less frequent attacks are given smaller weight in micro-FN calculations. This would be considered a more realistic assessment of the classifiers performance from a practical point of view.
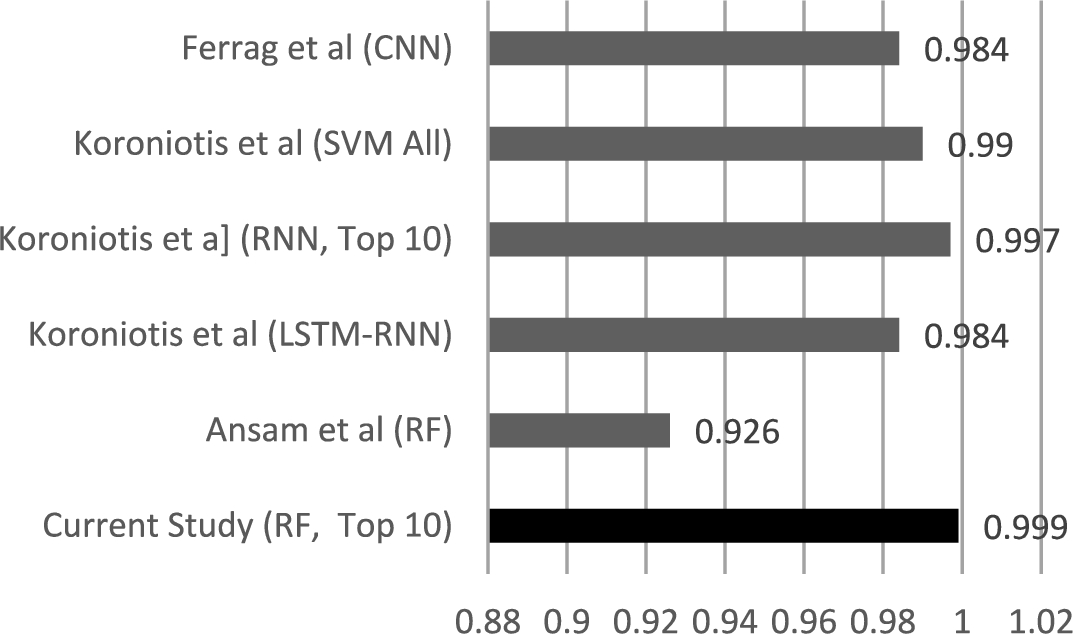
Comparison between the accuracies of best classifier for binary classification using the Top 10 features, and similar classifiers from literature.
To contrast the findings of this study with relevant studies from the literature, a comparison between the accuracy of the binary classification of the RF classifier and the accuracies of other binary classifiers reported in the literature is illustrated in Fig. 8. In [6], a Hybrid Intrusion Detection System (HIDS) that comprised both a signature-based component to help identify known attacks, and a behavioral component to help identify unseen (i.e. zero-day) attacks was proposed. While the signature-based component comprised a C5 decision tree, the behavioral part comprised a One-Class SVM classifier. Only 13 of the original 46 features of the Bot-IoT dataset were utilized, and the best accuracy obtained by the behavioral component was about 0.926. In [16], seven deep learning algorithms for intrusion detection were evaluated using a combination of the Bot-IoT and the CSE-CIC-IDS201 datasets. The classifier that produced the best accuracy, of 0.984, was a Convolutional Neural Network (CNN) classifier that utilized the Bot-IoT dataset. In the study illustrated in [24], three classifiers were utilized for binary classification: Support Vector Machines (SVM), Recurrent Neural Networks (RNN), and Long-Short-Term Memory Recurrent Neural Networks (LSTM-RNN), and the Bot-IoT dataset was also used. The experiments conducted in this study varied between utilizing all 46 features and utilizing subsets of the features selected by different feature selection techniques. As Fig. 8 shows, the RNN classifier with the top 10 features achieved the closest accuracy to the RF classifier depicted in this study.
Only few studies considered main attack categories classifications, let alone subcategories classification. In Fig. 9, the accuracy of the main categories classifier proposed in [17] is compared with the accuracy of the RF main categories classifier presented in this study. In [17], the study reported accuracy results for Normal, Reconnaissance, and Information Theft categories, and thus, we depict the corresponding results from the RF classifier. As shown in the figure, the accuracies of both classifiers are comparable in Normal and Reconnaissance categories; however, in the much-less-represented Information Theft category, the accuracy of the RF classifier presented in this study is significantly higher than that of the classifier proposed in [17]. The accuracy of the RF classifier reached 0.95, while the accuracy of the classifier in [17] did not exceed 0.89. This improvement in performance is attributed to the combination of SMOTE, feature selection, and classifier choice.
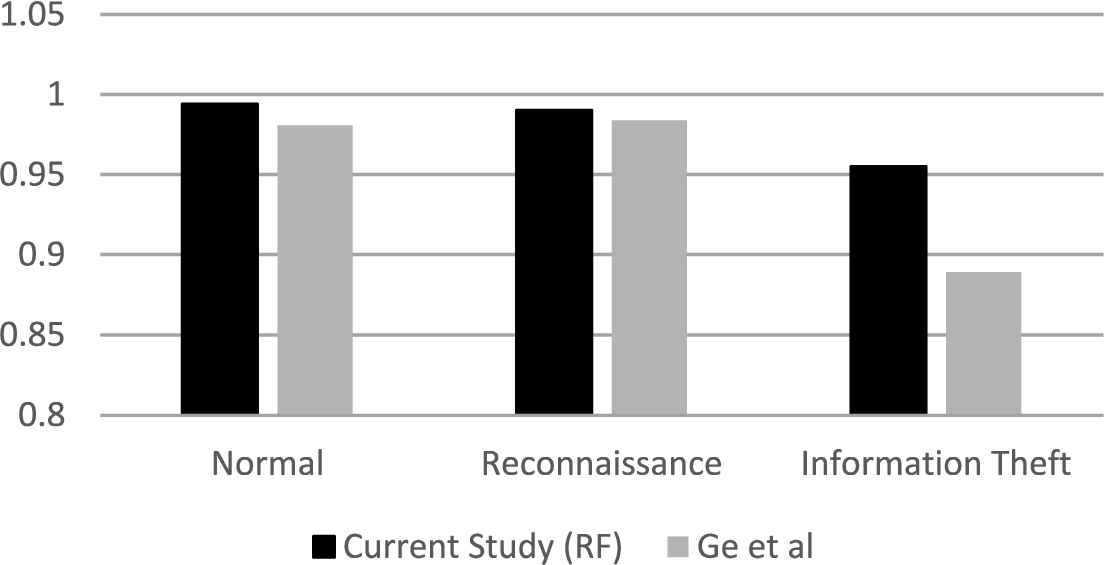
Comparison of the accuracies between the RF classifier in this study and the classifiers in [17].
It is believed that addressing the imbalanced nature of the sub-dataset using SMOTE played an instrumental role in the superiority of the presented classifiers compared to the results reported in the literature for both binary and multi-class classification. Figure 10 depicts the subcategories classification accuracies of the J48 classifier before and after applying SMOTE to the dataset. While the accuracy of the well-represented classes was not affected by introducing SMOTE, it helped improve the accuracy of detecting the less-represented class. The accuracy of detecting Data Exfiltration attacks without SMOTE did not exceed 0.6, however after applying SMOTE, it increased by a factor of 1.5. This emphasizes the significance of balancing a dataset before performing classification.

J48 accuracy before and after using SMOTE technique for multi-class classification (subcategories).
A machine learning based solution for behavioral IoT botnet attacks detection is presented in this study. The proposed solution aims at distinguishing not only normal from attack classes, but also distinguish the category and subcategory of the attack class. This study utilized the Bot-IoT dataset, a recent comprehensive dataset for IoT botnet attacks. In this dataset, each instance has three types of labels: a binary normal/Attack label, a label for the attack main category, and a label for the attack subcategory. The experiments, in this study, utilized a subset of the Bot-IoT dataset after applying necessary preprocessing steps to address its imbalanced nature. Also, multiple techniques for feature selection were utilized.
Several classifiers were tested, and the best three were reported in this study, namely: J48, Random Forest (RF), and Multilayer Perceptron (MLP) network. Three types of classification were conducted for each classifier: binary, main categories, and subcategories classifications. Moreover, 19 of the original 46 features from the Bot-IoT dataset were chosen, and the top 5, 10, and 15 features were selected using two types of feature selection methods: Pearson’s Correlation Coefficient, and Relief-F. The performance of the classifiers, for each type of classification and using the different features combinations, was assessed in terms of accuracy and f-measure. Furthermore, the False Negative (FN) rate, was evaluated in each experiment as a means to assess the error in classification, since it measures the rate of attack instances that go undetected. The results showed the superiority of the RF and J48 classifiers in terms of accuracy, f-measure, and FN rates across all experiments and for all classification types compared to the MLP network, and other recent classifiers reported in state-of-the-art studies. For binary classification, the best accuracy achieved in this study reached 0.999, which outperforms the results achieved by the classifiers reported in recent literature. In main categories classification, the best accuracies of the J48 and RF classifiers were 0.960 and 0.963 respectively, while for subcategories classification, the accuracies of the J48 and RF classifiers were almost 0.93. Only few studies performed main categories classification, let alone subcategories classification. For main categories classification, the accuracy of the state-of-the- art classifier depicted in this study reached 0.95 for normal and Reconnaissance classes, and 0.88 for the Information Theft class. The accuracy of the RF classifier presented in this study, on the other hand, achieved almost 0.999 for normal and Reconnaissance classes and 0.95 for the Information Theft class. In terms of classification errors, J48 and RF classifiers outperformed the MLP classifier, with a maximum and a minimum micro FN rates just about 0.076 and around 0.001, respectively.
The Bot-IoT dataset is gigantic, which renders utilizing larger subsets of its instances, relatively speaking, impractical. It also introduces a trades-off between classification accuracy on one hand, and the computational cost on the other hand. Thus, different approaches to explore larger subsets of the Bot-IoT dataset will be examined, and their classification performance and computational cost will be evaluated and contrasted. This dataset is also highly imbalanced, and while this study attempted to combat this problem via applying SMOTE, additional approaches to help address the imbalance in this dataset need to be explored and evaluated.
Additional types of classifiers can be examined, especially deep learning classifiers, and their performance needs to be evaluated and compared to the classifiers depicted in this study. Also, the evaluation of additional classification performance metrics is worthwhile. A fundamental characteristic of some prominent IoT botnet attacks is irregularities in IoT devices power consumption rates. This calls for reengineering relevant datasets, which typically comprise statistical summaries of network flows, to address individual nodes profiling, instead. This would provide fresh insights, and open the door for experimentation with several machine learning models to help detect IoT botnet attacks.
Conflict of interest
None to report.