
Abstract
In this paper, we presented a simulation optimization approach toward optimizing resource allocation in Firoozgar Emergency Department, Tehran, Iran. Most of the departments have interactions in healthcare systems. Therefore, modeling one isolated department such as the emergency department is not acceptable. Since laboratories, radiology departments, and pharmacies have high interactions with emergency departments, clinical pathway was used as a key for the integrated simulation of the emergency department in this paper. Simulation model was validated using real data. In emergency departments, there are various patients with different priorities. Thus, there should be different response variables, i.e. a multi-response optimization problem. Here, a new approach using the design of experiments, data envelopment analysis, multi-layer perceptron artificial neural network, and radial basis function was presented for optimizing the resource allocation problem. Since resources in healthcare are costly and limited, budget and resource constraints were applied in the model. The framework presented in this study is applicable to any healthcare department.
Keywords
Introduction
Healthcare systems and managers face different challenges such as high costs, high demands for service, and limited budget and healthcare resources [1]. However, there is higher pressure on emergency departments (EDs), because the patient arrival rate into EDs is stochastic; their health status is critical or may become critical most of the time; and they need a fast examination [2]. Consequently, it is necessary to reduce the patients’ waiting time by considering resource constraints. Healthcare managers need to decrease patients’ waiting time (considering patients’ priorities), increase staff utilization, and patient’s satisfaction. They also need to evaluate the impact of staff level changes on the performance of the department; in other words, they require a tool for what-if analysis. Joustra et al. [3] reduced the access times of an endoscopy department using discrete event simulation (DES) and linear programming. They showed that it is possible to improve the department’s performance without requiring additional resources.
Researchers have used different methods, e.g. DES, mathematical programming, and queue theory to improve the performance of a single department. Nevertheless, some other have pointed out the importance of integrated evaluations, because there are interactions between departments, and modeling a single department without considering interactions will not be accurate [4]. Although there are many tools for planning, since healthcare systems are complicated and most of the parameters are stochastic, simulation is an acceptable tool [5].
There are several tools for evaluating, improving, and optimizing numerous types of processes, and computer simulation is one them. The use of simulation in healthcare systems is not new. Researchers, especially non-academic healthcare practitioners, have been using simulation as a decision support technique for almost four decades.
Kirtland et al. [6] simulated an emergency department in order to minimize the patients’ length of stay. Lowery [7] presented an introduction to simulation in healthcare and discussed challenging issues associated with conducting simulation in healthcare as well as the importance of simulation usage in healthcare. Rau et al. [8] employed DES as an effective tool for strategic capacity planning for an outpatient therapy clinic. They showed that average waiting time for new patients would decreased if they were given priority over returning patients. Jun et al. [9] presented a survey on the application of DES in healthcare and explained the successes and failures in some cases. Benneyan [10] discussed the use of simulation analysis for studying and improving healthcare systems through a case study concerning pediatric waiting times and illustrated the typical steps involved in a simulation study. Eldabi et al. [11] revealed that simulation may not be considered as a technique for deriving solutions to certain problems. In fact, via a case study in a cancer clinic, they concluded that simulation is a tool for understanding the problem and improving systematic debate between the problem owners. Sepúlveda et al. [12] incorporated Arena simulation package to evaluate the impact of alternative floor layouts in a cancer treatment center and, at the end, increased patient throughput by 30% with the same resources. Sanchez et al. [13] provided statements outlining several key factors for success in healthcare simulation projects. Weng and Houshmand [14] presented a system analysis of a clinic by considering variable expenses and patient revenues using Arena computer simulation package.
The ED is one the most important parts of healthcare systems. Since patients’ health status in EDs is critical or may become critical most of the time, the response time of EDs is highly important. Many researchers used simulation to minimize patient flow time or waiting time in EDs. Saunders et al.’s [15] computer simulation is a potentially useful tool that can help predict the results of changes in an ED system without actually altering it, and may have implications for planning, optimizing resources, and improving the efficiency and quality of care. Robert et al. [16] compared the performance of DES and artificial neural network (ANN) for estimating the mean and variance of patients’ waiting time in an EDs.
Characteristic comparison chart
Characteristic comparison chart
DES: Discrete Event Simulation; DEA: Data envelopment analysis; ANN: Artificial neural network; MRO: Multi response optimization.
Draeger [17] utilized simulation to evaluate the process performance and preview the effects of nurse staffing and patient flow changes on an ED system. Rossetti et al. [18] tested alternative ED attending physician staffing schedules and analyzed the corresponding impacts on patient throughput and resource utilization in an ED using computer simulation. Samaha et al. [19] presented a computer simulation model of the operations in an ED in order to reduce the length of stay. They concluded that the main problem was process-related not resource-dependent. Yeh and Lin [20] used computer simulation and genetic algorithm in order to make appropriate adjustments to the nurses’ schedules and reduce patients’ queue time in an ED. They first incorporated simulation for modeling the problem. After gathering simulation results, they used genetic algorithm to find a near-optimal nurse schedule based on minimizing the patients’ queue time. Zeng et al. [21] presented a simulation model to estimate the optimal number of resources and equipment in order to minimize patients’ waiting time. Taboada et al. [22] introduced an agent-based decision support system for a hospital ED. Eskandari et al. [23] proposed a new framework which integrated the simulation model of patients’ flow process with the group analytical hierarchy process (AHP) and the technique for order preference by similarity to ideal solution (TOPSIS) decision models in order to evaluate and rank scenarios based upon desired performance measures. They reduced the average waiting time of non-fast-track patients by 42.3%. Konrad et al. [24] created a DES model and tested 17 scenarios to estimate the likely impact of a split-flow process redesign, including staffing level changes and patient volume changes. The scenarios were compared in terms of door-to-doctor time and length of stay (LOS) for different patient acuity levels. Finally, the best scenario for the ED was determined. Ghanes et al. [25] utilized DES in order to optimize the resource staffing levels of an ED in France. They minimized average LOS by integrating the staffing budget constraint and a constraint securing that the most severe incidents will see a doctor within a specified time limit. Weng et al. [26] adopted computer simulation to find the optimal allocation of resources in an ED to smoothen the flow of ED. Cabrera et al. [27] presented an agent-based modeling simulation to design a decision support system (DSS) and used exhaustive search (ES) optimization to find out the optimal ED staff configuration. Abo-Hamad and Arisha [28] proposed a new simulation-based decision support framework. They incorporated simulation to examine the impact of potential alternatives and balanced score card (BSC) to support continual and sustainable improvement in an ED. Since there are interactions between departments in the healthcare system, most of the researchers in this field acknowledged that modeling one department without considering interactions and relations between departments is not acceptable, and there is a need for integrated modeling of the healthcare system.
Hulshof [4] presented some challenges in integrated decision making in health care. Ghanes et al. [29] proposed a simulation-based optimization algorithm to minimize average LOS in an ED under a budget constraint. Wang and Lee [30] introduced a multi-objective simulation optimization model for a resource allocation problem in an ED. Keshtkar and Moradi [31] used DES software Arena to compare four different scenarios in an ED in order to reduce the patients’ waiting time. Besides quantitative criteria, they considered some qualitative criteria in their model. Zeinali et al. [32] utilized a simulation-based meta-modeling approach to optimize an ED resource level. They compared their model results with OptQuest
Table 1 presents the characteristics of this study and compares it with studies which merely considered capacity planning in only one department without taking into account other departments’ interactions. In this study, we considered multiple departments, other departments’ interactions, and multi-response variables which transformed the problem into multi-response optimization (MRO).
The rest of this paper is organized as follows: Section 2 presents the method employed in this study including simulation phase and MRO phase. Section 3 discusses the results and explains the performance of the approach used in this study. Finally, Section 4 concludes the paper.
In this paper, a new approach was presented to optimize resource allocation in an ED. Figure 1 presents the structure of this study.
Simulation
EDs are complicated systems and uncertainty is one of their major characteristics. Using DES in order to test the results of changes to resource levels is accepted and reported in the literature. In this paper, we employed DES for modeling the problem. Because integrated modeling was among the objectives of this study, clinical pathway method was adopted in order to consider multi-departments. The data required for simulation were gathered from an ED in Tehran, Iran. Some of the collected data such as the input rate of patients and processing times of each section were earned by historical data, and some other data were gathered by expert judgment method from department experts. The problem was simulated in Rockwell Automation’s Arena
T-test results for simulation base model validation
T-test results for simulation base model validation
Process flow chart of this study.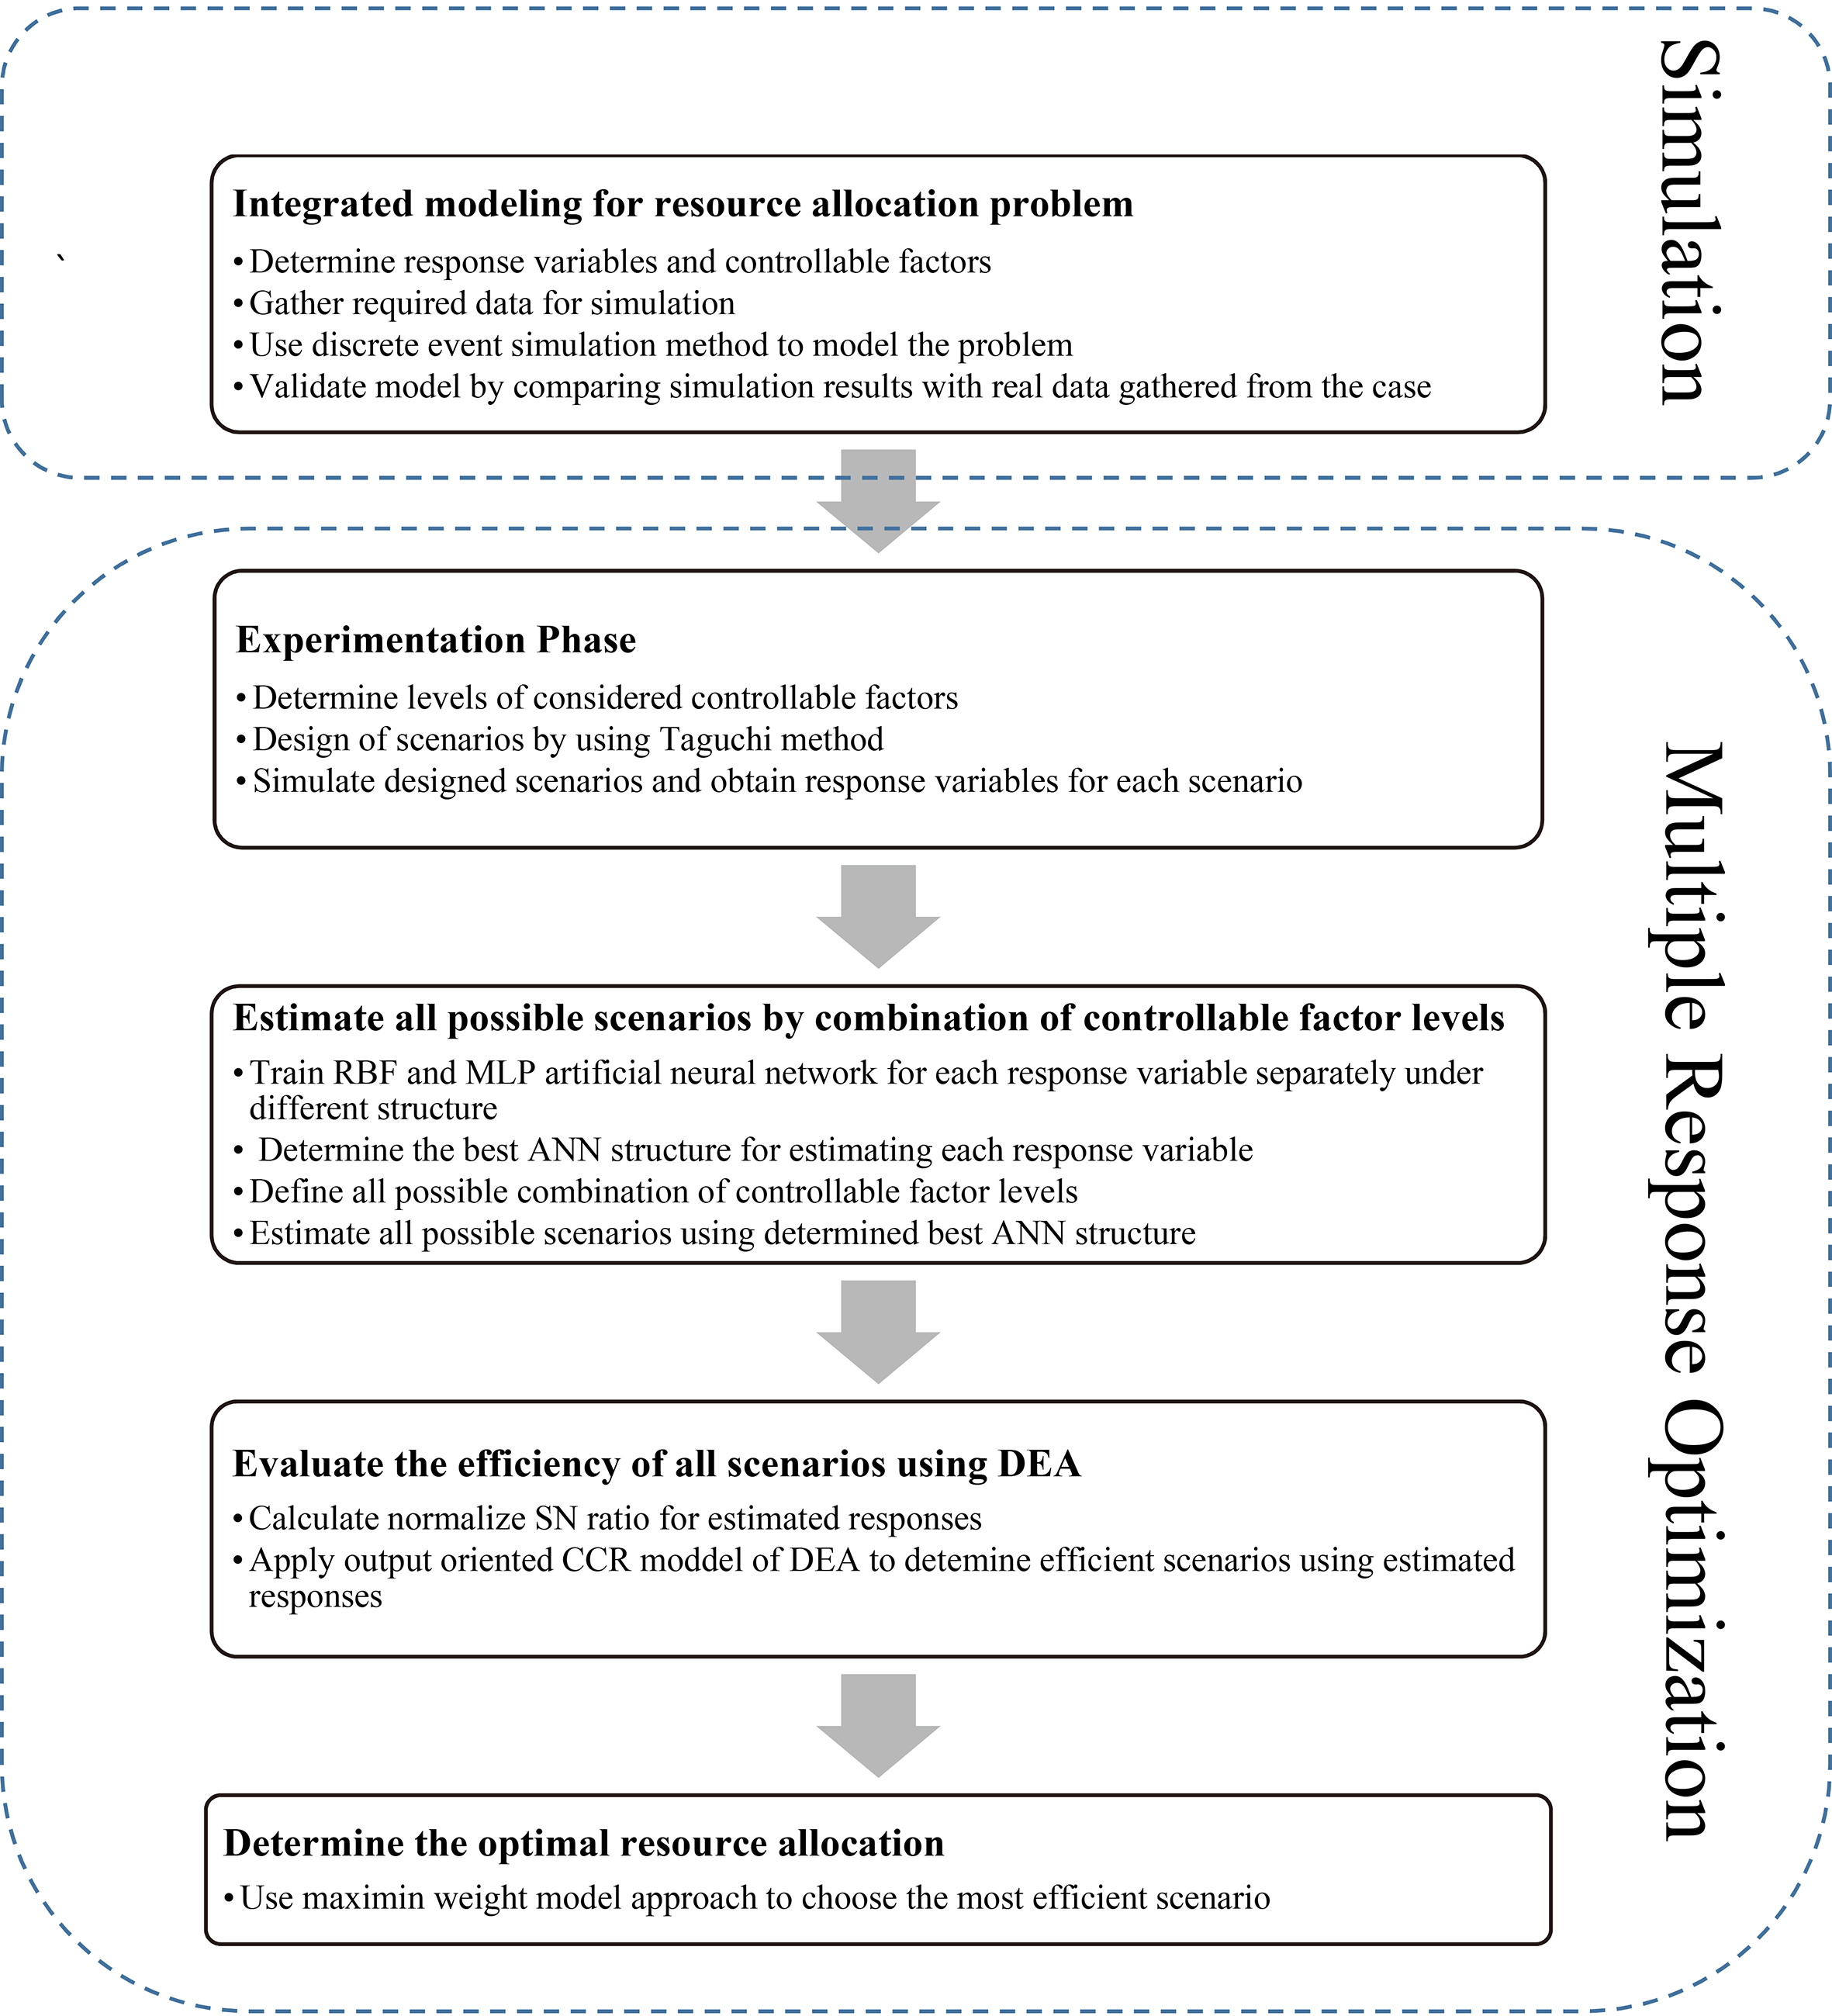
Integrated decision making in healthcare has been introduced by some researchers in the past decade. After determining several challenges in integrated decision making in healthcare, Hulshof [4] presented a new approach toward integrated decision making based on clinical pathways. In the healthcare system, departments have interactions with one another and it is important to consider these interactions in modeling. The most important interaction between departments in healthcare is patients. Patients are an entity in health care system; they move from one department to another to receive service. Figure 2 presents the schematic view of departments and their interactions in the considered ED.
Response variables and controllable factors
Patients flow through departments under study.
Controllable factors and response variables are the key parameters of the model, determined based on expert judgment and the objectives of the problem. Controllable factors represent resource levels and response variables represent the objectives of the model [34]. Since radiology and laboratory equipment are expensive and do not fit the department’s budget constraint, no additional resource allocation is possible. Response variables and controllable factors are shown in Table 3.
Since we considered multi-response variables in our model, we require an MRO method to optimize the problem. Finding the optimal combination of controllable factors in multi-objective problems to obtain appropriate response variables is one of the common problems in healthcare. The differential and often opposite direction of response variables is a usual problem in the simultaneous optimization of multi-responses [35]. Consequently, optimizing one response may cause non-optimal values of others. In order to obtain the optimal points of the problem, it is essential to find a proper method for MRO. Most of the studies on MRO consist of three main steps to find the optimal treatment. In the first step, a model is built for describing the relation between controllable factors and responses. In the second step, an aggregation approach of responses is applied. In the third step, an optimization method is used for optimizing the single response which was obtained from the last step. Some authors have compared response surface and regression models with ANN in model building, and verified the superior performance of ANN in their results [36, 37, 38, 39, 40].
A number of researchers studied the use of ANN and data envelopment analysis (DEA). to model the relationships between controllable factors and response variables and to obtain the optimal value for controllable factors, respectively. Liao and Chen [41] incorporated ANN to estimate the signal-to-noise (SN) ratio of responses for all treatments. Afterwards, efficient treatments were determined by Charnes, Cooper, and Rhodes (CCR) DEA model [42]. Gutierrez and Lozano used a similar approach in order to find the most efficient decision making unit (DMU) among efficient DMUs. Bashiri et al. [35] proposed the neuro-data envelopment analysis approach to find the most efficient treatment in the MRO problem when controllable factors were the smaller-the-better (STB) type.
Controllable factors of this study
Controllable factors of this study
In this study various controllable factors and response variables existed (Table 2). It was our goal to obtain the best combination of controllable factors in order to obtain optimal response variables. We attempted to minimize response variables using minimum resources (controllable factors), so that both controllable factors and response variables would be the STB type. In this study, we applied the approach proposed by Bashiri et al. [35]. The first design of experiments was employed to develop various experimental scenarios. Then, using simulation model, each scenario was experimented and response variables were extracted. After that, we used ANNs in order to estimate all possible combinations of controllable factors’ levels. At the end, data envelopment analysis was utilized to determine the most efficient scenario.
In this phase, we determined the controllable factors’ levels based on the problem. Afterwards, Taguchi method was used to design experimental scenarios. After that, we estimated the responses of all possible scenarios. Eventually, the most efficient combination of controllable factors was determined.
2.2.1.1. Determining the levels of considered controllable factors
The levels of considered controllable factors are presented in Table 4. These levels were determined based on case problem, expert judgment, and limitations (e.g. financial and scarcity limitations for the controllable factors that represented resources).
2.2.1.2. Design of experimental scenarios using Taguchi method
Design of experiments (DOE) is a systematic method to determine the relationship between factors affecting a process and the output of that process. Taguchi method is a broadly accepted method of DOE which has been proven to produce high-quality products at a low cost. For this study, we first determined the controllable factors and their levels by considering case situation and expert judgment. Then, experimental scenarios were developed using the Minitab Statistical Software. The designed experimental scenarios are presented in Table 5.
Designed scenarios by Taguchi method
Designed scenarios by Taguchi method
2.2.1.3. Simulating designed experimental scenarios
After developing scenarios using DOE Taguchi method, the simulation-based model was updated based on each scenario. Then, by running the simulation model for each scenario, the related response variables were extracted and gathered.
In order to expand the results of experimental scenarios into all possible combinations of controllable factors, we need an estimation tool. There are many estimation tools such as linear regression, quadratic regression, exponential regression, and ANNs (i.e. MLP and RBF) that try to find some patterns in the data at hand. Using the discovered patterns, it is possible to estimate the new scenarios’ response variables. In order to find the best estimation model for this study, we compared the mean absolute percentage errors (MAPE) of various models.
The data are divided into three subsets: training, validation and testing sets. The training set is used for computing the gradient and updating network weights and biases. As the network begins to over-fit the data, the error on the validation set typically begins to rise. After the specified number of iterations (which can be defined by the researcher) and the increase in validation error, the training is stopped and the weights and biases of the epoch, with minimum validation errors, are returned as the final ANN structure [46].
In this study, 70% of the data were randomly selected for training the network, while 25% and 5% of the data were randomly selected for testing and validating, respectively. The MAPE of testing and validation sets was considered as the ANN’s performance criteria in the estimation of responses. The MAPE is regarded as one of the standard statistical performance measures, shown in Eq. (1) [47].
where
Data envelopment analysis (DEA) was adopted to evaluate the relative efficiency of a group of decision making units (DMUs), while there were several inputs and outputs for each DMU. The efficiency computed in this problem equaled the ratio of the weighted sum of outputs to the weighted sum of inputs. Therefore, to maximize the DMUs’ efficiency, inputs had to be minimized while the outputs were fixed (input-oriented model), or outputs had to be maximize while the inputs were fixed (output-oriented model). In healthcare environments, the optimization of objectives (outputs) is much more important than the use of minimum resources (inputs). As a result, we incorporated the DEA output-oriented model in this study. The DEA model used in this study was the CCR output-oriented model proposed by [42]. Assume that there are
in which
In this study, each scenario was considered as a DMU, each controllable factor was regarded as an input variable, and each response variable was considered as an output variable.
Before using DEA, it is important to understand that input variables should be the STB type and output variables should be the larger-the-better (LTB) type. However, we must note that this condition does not necessarily hold in all problems. Thus, before using DEA, it is essential to check if controllable factors are the STB type and response variables are the LTB type. Based on the properties of controllable factors and response variables, we can assure whether they are the STB or LTB type. In this study, response variables were the STB type. For example, patients’ mean waiting time for bed was one of the variables that we wanted to minimize. Consequently, before using DEA, we had to transform response variables into the LTB type using Eq. (3):
where
Architectures of the 10 ANN-RBF models and their associated relative error (MAPE)
Architectures of 11different ANN-MLP models and their associated relative error (MAPE)
Note: TF: Transfer function; HL: Hidden layer; OL: Output layer; LM: Levenberg-Marquardt back propagation; BFG: BFGS Quasi-Newton; CGB: Conjugate Gradient with Powell/Beale Restarts, SCG: Scaled Conjugate Gradient.
Efficiency takes a value between 0 and 1, and sometimes more than one DMU can become efficient. In this paper, we used Maximin weight model to determine the most efficient DMU among efficient DMUs. The Maximin weight model was presented by Wang et al. for ranking DEA efficient units [48]. We utilized this model for all efficient DMUs. The model is presented in Eq. (2.2.4):
in which
In this section, we applied the steps presented in Section 2 on the problem under study. The required data were collected from Firoozgar ED in Tehran, Iran. The simulation-based model was created in Arena
Simulating the designed scenarios and obtaining response variables for each scenario
As mentioned before, Taguchi method was incorporated to design the experimental scenarios (Table 4). Afterwards, we used simulation modeling to obtain the related response variables of each scenario. Since stochastic data were employed in simulation modeling, results were not constant. Thus, each scenario was simulated five times. The response variables of experimental scenarios are presented in Table 13 in Appendix.
MAPE values of optimum estimation networks and regression methods
MAPE values of optimum estimation networks and regression methods
Response variables of all possible scenarios
As the performance of ANNs strongly depends on their effective parameters and structure [49], we had to determine the best structure first and then extract the related MAPE of each structure for comparison. In this study, we considered MLP, ANN, and radial basis function (RBF) as estimation models for the problem.
RBF is an estimator function which can also be interpreted as an ANN. Spread and maximum number of neurons are the most important factors influencing the network’s performance. Table 6 shows the MAPE of different RBF architectures for each response variable (output) of the problem.
An MLP is a feed-forward ANN model that maps sets of input data onto a set of appropriate outputs. It consists of multiple layers of nodes in a directed graph, with each layer fully connected to the next one. Except for the input nodes, each node is a neuron (or processing element) with a nonlinear activation function. MLP utilizes a supervised learning technique called back-propagation for training the network. MLP is a modification of the standard linear perceptron and can distinguish data which are not linearly separable. Different architectures of ANN-MLP models and their related MAPE are presented in Table 7. In order to demonstrate the application of ANNs for this study, we also used conventional regression models for the problem. Results of MAPE and the comparison between all models used for the problem are given in Table 8.
Using optimal estimation functions for each output of the problem, it was possible to estimate all possible scenarios’ response variables. The response variables of all possible scenarios are depicted in Table 9. To enhance the accuracy of the results, some new levels between the initial factor levels (i.e. 22 and 24 beds and 4 and 6 nurses) could be defined. Therefore, the number of treatments that had to be estimated by ANN equaled 5
Evaluating the efficiency of all scenarios using DEA and determining the optimal resource allocation
After evaluating the efficiency of all scenarios using ANN, it was time to use DEA-CCR output-oriented model in order to calculate the efficiency of all scenarios. The results for the efficiency of all 675 scenarios are given in Table 14 in Appendix. Sixty-seven scenarios were efficient (i.e. had an efficiency equal to 1). In order to find the most efficient scenario among the efficient ones, we employed Wang model which was explained in Section 2.
After computing
Maximin weight model results for efficient DMUs
Maximin weight model results for efficient DMUs
Based on the results, DMU Number 63 among efficient DMUs (which is Number 14 among efficient DMUs) was the best scenario for this ED. Table 11 demonstrates the best resource allocation level for the ED.
Most efficient scenario for the emergency department resource level
Response variables in optimal point are presented in Table 12.
Response variables for optimal point
By comparing these results with the ED’s current condition, it appears that if the ED adds 3 more beds and 1 more pharmacy employee, it is possible to decrease patients’ waiting time for bed by 32%, reduce mean waiting time in triage queue by about 16%, and decrease mean waiting time in the drugstore by 64%. This additional resource allocation in within the department’s budget constraint.
In this paper, we optimized resource allocation in an ED using simulation-multi-response optimization. First, we integrated the simulation of the problem modeled in Arena by considering clinical pathway method for integration. Next, using the design of experiments method, Taguchi, different scenarios were developed for experimentation. After gathering experimental scenarios, the simulation model was updated based on each scenario and run. After gathering the required results (response variables), the response variables of other possible scenarios were estimated by ANN. Finally, using data envelopment analysis, the most efficient DMU was determined. After running the simulation model of the current ED and the most efficient DMU determined in this paper, we concluded that the new resource level decreases patients’ waiting time for bed by 32%, reduces mean waiting time in triage queue by about 16%, and decreases mean waiting time in the drugstore by 64%. Since we assumed that all equipment and staff are present and ready to work all day, future studies can take into account equipment breakdown and staff absence.
Footnotes
Acknowledgments
Authors thank Dr Poorshirazi, the head of Firoozgar Emergency Department for his medical and information support.
Appendix
Response variables of experimental scenarios
Scenario
Iteration
Y
Y
Y
Y
Y
1
1
5.25790
0.31640
1.08620
0.01061
0.05821
2
5.45831
0.36574
1.04584
0.02759
0.06784
3
5.02938
0.32857
1.14739
0.01348
0.04858
4
5.67384
0.39894
1.10848
0.00985
0.53848
5
4.98753
0.29847
1.09859
0.01139
0.6184
2
1
4.87530
0.36420
1.05940
0.00014
0.04938
2
4.28384
0.39858
1.06893
0.00019
0.06839
3
4.98473
0.29853
1.04857
0.00009
0.05473
4
3.98753
0.40853
1.03958
0.00019
0.04874
5
4.45858
0.38758
1.05423
0.00013
0.04573
3
1
5.13940
0.32540
1.00530
0.00000
0.07432
2
5.58382
0.38574
1.01384
0.00000
0.05438
3
5.23849
0.29847
1.00857
0.00000
0.06857
4
4.98574
0.38674
1.03859
0.00000
0.05738
5
4.87664
0.34382
1.12384
0.00000
0.06583
4
1
0.07135
0.05689
0.76730
0.01852
0.00548
2
0.09847
0.07583
0.67583
0.02737
0.00637
3
0.05868
0.06747
0.87482
0.01838
0.00599
4
0.08474
0.07473
0.75832
0.02384
0.00843
5
0.13845
0.05647
0.84741
0.01576
0.00736
5
1
0.06733
0.04414
0.81730
0.00679
0.00468
2
0.08482
0.05673
0.67484
0.00874
0.00757
3
0.07382
0.06372
0.86527
0.00737
0.00674
4
0.09388
0.04573
0.82949
0.00475
0.00567
5
0.08747
0.05732
0.73848
0.00674
0.00563
6
1
0.07844
0.05312
0.72440
0.00000
0.00704
2
0.08473
0.06748
0.84853
0.00000
0.00938
3
0.06784
0.04758
0.67843
0.00000
0.00783
4
0.09748
0.05768
0.73848
0.00001
0.00586
5
0.08732
0.08394
0.98374
0.00000
0.00768
7
1
0.08094
0.03973
1.14310
0.02149
0.00154
2
0.09382
0.04658
1.21738
0.03473
0.00327
3
0.13849
0.03758
1.17683
0.02475
0.00237
4
0.11938
0.05385
1.38573
0.02894
0.00278
5
0.09485
0.04758
1.74735
0.03827
0.00173
8
1
0.08338
0.03563
1.09483
0.00783
0.00104
2
0.09483
0.04657
1.12748
0.00984
0.00272
3
0.09374
0.04658
1.12849
0.00874
0.00184
4
0.08239
0.03645
1.09385
0.00657
0.00374
5
0.07583
0.05839
1.12738
0.00783
0.00137
9
1
0.09347
0.03634
1.16394
0.00000
0.00184
2
0.08938
0.04757
1.12841
0.00000
0.00284
3
0.08937
0.03475
1.09385
0.00000
0.00194
4
0.10273
0.04895
1.12748
0.00000
0.00238
5
1.28384
0.05372
1.14858
0.00000
0.00174
10
1
0.04743
0.06107
0.11870
0.01467
0.00564
2
0.06372
0.07382
0.10938
0.01765
0.00764
3
0.04573
0.05673
0.09848
0.01235
0.00638
4
0.06738
0.06473
0.14678
0.01986
0.00459
5
0.05678
0.08978
0.13786
0.01367
0.00764
11
1
0.06432
0.05746
0.15420
0.00345
0.00646
2
0.07864
0.07834
0.18734
0.00289
0.00873
3
0.06578
0.05647
0.13847
0.00475
0.00475
4
0.04586
0.04589
0.16574
0.00346
0.00578
5
0.07864
0.05893
0.14837
0.00318
0.00679
Table 13, continued
Scenario
Iteration
Y
Y
Y
Y
Y
12
1
0.04574
0.05685
0.13550
0.00001
0.00523
2
0.06478
0.06748
0.15834
0.00002
0.00674
3
0.06738
0.05382
0.17484
0.00001
0.00586
4
0.05783
0.04986
0.14583
0.00002
0.00674
5
0.07637
0.06839
0.15837
0.00001
0.00475
13
1
2.04120
0.36560
0.10860
0.01534
0.00114
2
2.18384
0.34724
0.12483
0.01748
0.00283
3
2.37483
0.28947
0.14748
0.01388
0.00183
4
2.36532
0.27894
0.19474
0.01573
0.00283
5
2.00384
0.37483
0.10938
0.01485
0.03844
14
1
2.45432
0.42152
0.12902
0.00464
0.00214
2
2.89731
0.47853
0.14758
0.00573
0.00283
3
2.27842
0.38958
0.13858
0.00475
0.00382
4
2.47854
0.35783
0.11938
0.00683
0.00294
5
2.89737
0.49884
0.15738
0.00394
0.00208
15
1
2.32160
0.34210
0.12142
0.00000
0.00159
2
2.18384
0.38728
0.13738
0.00000
0.00284
3
2.28310
0.28947
0.10938
0.00000
0.00184
4
2.01838
0.27493
0.15728
0.00000
0.00285
5
2.47573
16.58
0.14853
0.00000
0.00287
16
1
0.00305
0.00040
0.11394
0.01428
0.05813
2
0.00472
0.00035
0.13457
0.01674
0.07345
3
0.00389
0.00043
0.10976
0.01367
0.06452
4
0.00412
0.00041
0.10975
0.01785
0.09124
5
0.00336
0.00035
0.13462
0.01236
0.04565
17
1
0.00463
0.00053
0.10435
0.00623
0.06244
2
0.00567
0.00075
0.12426
0.00736
0.05783
3
0.00347
0.00047
0.11745
0.00578
0.04782
4
0.00784
0.00056
0.12840
0.00578
0.07837
5
0.00567
0.00068
0.11983
0.00475
0.06793
18
1
0.00503
0.00042
0.11259
0.00000
0.06138
2
0.00674
0.00063
0.13762
0.00000
0.07863
3
0.00457
0.00047
0.14637
0.00000
0.06489
4
0.00487
0.00086
0.12835
0.00000
0.05376
5
0.00593
0.00046
0.10985
0.00000
0.08637
19
1
0.01598
0.00289
0.00934
0.01059
0.00114
2
0.01783
0.00387
0.00863
0.01283
0.00128
3
0.01479
0.00278
0.00784
0.01492
0.00118
4
0.01873
0.00190
0.00893
0.01238
0.00148
5
0.01578
0.00289
0.00683
0.01183
0.00139
20
1
0.01753
0.00349
0.01033
0.00035
0.00185
2
0.01892
0.00478
0.01284
0.00038
0.00218
3
0.01673
0.00572
0.01372
0.00042
0.00273
4
0.01783
0.00478
0.01283
0.00039
0.00179
5
0.01578
0.00893
0.01384
0.00042
0.00278
21
1
0.01577
0.00321
0.01234
0.00000
0.00153
2
0.01783
0.00378
0.01424
0.00000
0.00167
3
0.01893
0.00428
0.02893
0.00000
0.00187
4
0.01539
0.00389
0.01783
0.00000
0.00147
5
0.01483
0.00289
0.02184
0.00000
0.00178
22
1
0.03548
0.07149
0.01424
0.01295
0.04986
2
0.03873
0.08723
0.01658
0.01473
0.05783
3
0.02894
0.06274
0.01378
0.01378
0.04984
4
0.03893
0.09734
0.01478
0.01783
0.05382
5
0.03894
0.05783
0.01674
0.01347
0.06293
23
1
0.03224
0.06143
0.01104
0.00735
0.05294
2
0.04382
0.07845
0.01287
0.00839
0.07364
3
0.03893
0.08364
0.01562
0.00683
0.08743
4
0.04284
0.06573
0.01293
0.00918
0.06753
5
0.05782
0.08743
0.01487
0.00473
0.07384
Table 13, continued
Scenario
Iteration
Y
Y
Y
Y
Y
24
1
0.02985
0.06534
0.01313
0.00025
0.05596
2
0.03783
0.07384
0.01572
0.00042
0.06373
3
0.02845
0.05673
0.01482
0.00038
0.05892
4
0.03874
0.06783
0.01294
0.00382
0.04883
5
0.04108
0.08384
0.01783
0.00028
0.05838
25
1
2.94280
0.34250
0.01248
0.00000
0.00789
2
2.84835
0.41783
0.01472
0.00000
0.00893
3
3.48520
0.32894
0.01683
0.00000
0.00793
4
3.28341
0.38938
0.01398
0.00000
0.00983
5
2.78342
0.48291
0.01109
0.00000
0.00783
26
1
3.54320
0.36750
0.01482
0.00000
0.00784
2
3.89273
0.39828
0.01793
0.00000
0.00789
3
2.98355
0.31993
0.01893
0.00000
0.00938
4
3.20841
0.38941
0.01488
0.00000
0.00683
5
3.39021
0.29842
0.01873
0.00000
0.00589
27
1
3.87320
0.29840
0.01094
0.00000
0.00817
2
3.78394
0.37482
0.01382
0.00000
0.00784
3
3.28938
0.21884
0.01284
0.00000
0.00783
4
2.98384
0.27893
0.01572
0.00000
0.00578
5
3.78831
0.31894
0.01372
0.00000
0.00793
Efficiency of all scenarios calculated by DEA-CCR output oriented
Inputs (controllable factors)
Outputs (response variables)
Scenario
Bed
Nurse
Doctor
Triage
Pharmacy
1
2
3
4
5
Efficiency
nurse
employee
1
4
2
2
22
3
3.14900
0.27603
0.79426
0.00000
0.03813
2
3
1
3
23
2
0.06251
0.27115
0.99626
0.00000
0.00030
3
5
2
2
25
2
1.75351
0.27119
0.14309
0.00645
0.00056
4
3
1
1
24
1
2.33024
0.00000
1.10682
0.00827
0.05060
5
4
2
2
24
1
1.39253
0.10569
0.34794
0.01278
0.00559
6
5
2
2
21
2
3.19671
0.36040
0.00000
0.00594
0.01528
7
4
1
3
21
2
0.00000
0.28898
0.88121
0.00000
0.00000
8
6
3
3
22
1
1.22829
0.13748
0.00000
0.01736
0.00000
9
6
3
2
21
1
2.84073
0.28397
0.00000
0.01168
0.01542
10
4
1
1
22
2
4.11921
0.25537
0.31809
0.00631
0.04726
11
6
2
1
24
2
0.00000
0.04923
0.07669
0.00993
0.05223
12
5
3
3
22
1
0.73262
0.07861
0.00000
0.01742
0.00000
13
3
2
1
21
1
2.02553
0.24378
0.03059
0.00994
0.04465
14
3
2
3
21
1
0.00000
0.25672
0.67432
0.00571
0.00000
15
3
3
2
22
3
0.00000
0.05004
1.19814
0.00126
0.06427
16
7
3
1
25
1
0.00000
0.00000
0.10692
0.00840
0.05759
17
5
2
3
23
1
0.00000
0.08799
0.01892
0.01508
0.00000
18
3
3
3
24
3
0.57577
0.10696
1.07396
0.00368
0.00936
19
4
3
2
22
3
0.92463
0.15128
0.36749
0.00374
0.03213
20
4
3
2
24
2
0.00000
0.03345
0.31985
0.00809
0.02884
21
5
1
2
25
1
0.42479
0.09001
0.08629
0.00818
0.00280
22
6
3
3
24
2
1.69234
0.18060
0.02664
0.01182
0.00000
23
7
1
3
21
2
0.12845
0.03727
0.02608
0.00515
0.00250
24
3
3
2
23
2
0.00000
0.00780
0.58959
0.00652
0.03424
25
7
3
2
22
1
2.85456
0.26041
0.00000
0.01287
0.01672
26
6
3
3
21
3
3.19422
0.36041
0.00000
0.00525
0.00691
27
6
1
3
23
1
0.00000
0.00000
0.32661
0.00881
0.00000
28
7
3
3
24
3
3.06812
0.29065
0.04832
0.00488
0.00570
29
4
3
1
25
3
0.00000
0.00000
0.21176
0.00384
0.06411
30
3
2
2
21
1
1.15227
0.27478
0.60824
0.00727
0.01238
31
4
1
1
24
1
2.80086
0.07009
0.29563
0.00933
0.04212
32
6
3
2
25
1
2.58630
0.08745
0.05356
0.01722
0.02455
33
4
2
1
22
2
0.00000
0.09732
0.12117
0.00923
0.05373
Table 14, continued
Inputs (controllable factors)
Outputs (response variables)
Scenario
Bed
Nurse
Doctor
Triage
Pharmacy
1
2
3
4
5
Efficiency
nurse
employee
34
5
1
3
22
3
0.18114
0.15195
0.82538
0.00128
0.00160
35
3
2
1
25
3
0.83671
0.00000
1.33244
0.00000
0.08789
36
3
2
1
22
2
0.53858
0.14244
0.63453
0.00621
0.06096
37
7
2
1
22
3
1.18080
0.09144
0.02183
0.00249
0.05625
38
7
3
1
24
2
0.18233
0.04499
0.08961
0.00630
0.05332
39
5
3
2
21
2
2.85094
0.32124
0.00000
0.00702
0.01254
40
7
1
3
24
2
0.00000
0.00000
0.09720
0.00539
0.00050
41
7
1
3
24
1
0.00000
0.00000
0.10284
0.00834
0.00108
42
7
1
2
25
2
0.89885
0.00000
0.00000
0.00567
0.00968
43
3
3
3
25
1
0.00000
0.03619
0.83544
0.01264
0.00000
44
4
1
2
25
2
0.06278
0.04803
0.67147
0.00119
0.01922
45
7
2
1
21
3
1.62876
0.11444
0.00064
0.00195
0.05515
46
3
3
2
23
1
1.10893
0.05849
0.30640
0.01441
0.02099
47
5
2
3
25
3
0.62368
0.18065
0.25438
0.00585
0.00000
48
6
1
3
24
2
0.00000
0.00000
0.31264
0.00527
0.00000
49
6
3
1
23
3
0.16613
0.04461
0.10707
0.00395
0.05010
50
6
1
1
25
1
2.81247
0.12135
0.00000
0.00544
0.03189
51
3
3
1
25
3
0.00000
0.00000
0.47052
0.00191
0.06568
52
6
3
3
22
2
2.54357
0.30593
0.00000
0.00886
0.00000
53
6
3
1
25
2
0.00000
0.00000
0.11728
0.00573
0.06032
54
5
2
2
21
3
3.75947
0.31879
0.13651
0.00363
0.03280
55
4
3
2
25
3
0.00000
0.00000
0.73756
0.00131
0.03921
56
5
1
1
22
2
3.38695
0.19969
0.00000
0.00834
0.03733
57
5
3
3
23
1
0.23123
0.04134
0.00000
0.01768
0.00000
58
7
3
3
21
3
3.30991
0.34966
0.00000
0.00462
0.01096
59
5
1
2
21
1
1.54764
0.20562
0.09533
0.00669
0.01358
60
4
2
1
23
1
2.05982
0.12524
0.00626
0.01261
0.04642
61
3
2
3
23
1
0.00000
0.04299
0.70339
0.01128
0.00000
62
4
3
1
24
2
0.00000
0.00000
0.13259
0.00490
0.06175
63
4
2
2
25
2
0.99130
0.2063
0.000216
0.00201
0.06251
64
3
2
3
21
3
2.09638
0.32657
1.12744
0.00000
0.01577
65
6
2
2
23
2
3.09492
0.34130
0.00000
0.00640
0.00974
66
4
3
1
23
1
0.83246
0.03035
0.08317
0.01208
0.05104
67
4
2
3
23
3
1.28546
0.27398
0.69646
0.00063
0.00671
68
4
1
2
21
3
2.30972
0.21751
0.59148
0.00133
0.02553
69
7
1
3
22
3
0.13728
0.03211
0.02951
0.00423
0.00076
70
6
2
3
25
2
0.30766
0.17720
0.02213
0.01089
0.00000
71
7
2
3
25
3
0.60237
0.08063
0.00000
0.00611
0.00066
72
3
3
3
21
2
0.76947
0.15357
0.87479
0.00676
0.00000
73
3
1
2
24
3
1.86320
0.22343
1.12511
0.00000
0.03481
74
5
3
1
25
1
0.12965
0.00000
0.12507
0.00981
0.05667
75
6
1
3
23
2
0.00000
0.00526
0.23265
0.00496
0.00000
76
4
2
3
21
2
1.08836
0.44094
0.39982
0.00026
0.00000
77
3
1
2
21
2
2.38891
0.32218
1.24029
0.00000
0.02755
78
4
1
2
22
2
1.73788
0.22333
0.69132
0.00031
0.02261
79
4
2
3
21
1
0.24530
0.24453
0.07159
0.01011
0.00000
80
7
1
3
23
3
0.04514
0.00733
0.01289
0.00440
0.00029
81
7
2
1
24
1
0.80182
0.13636
0.00000
0.00854
0.04496
82
4
3
3
23
3
1.46969
0.23410
0.55770
0.00451
0.00050
83
3
2
1
22
1
1.68652
0.17586
0.04645
0.01083
0.04603
84
4
1
3
25
1
0.00000
0.00000
0.49022
0.01271
0.00000
85
4
2
3
22
1
0.00000
0.10545
0.14643
0.01326
0.00000
86
7
3
2
21
1
2.90716
0.30405
0.00000
0.01138
0.01552
87
6
2
3
24
3
0.61056
0.15649
0.00000
0.00682
0.00000
88
5
3
2
21
3
4.07405
0.33633
0.00475
0.00380
0.01218
89
4
2
2
22
1
2.59518
0.23964
0.09603
0.01032
0.01504
90
4
3
1
24
3
0.00000
0.00000
0.17302
0.00413
0.06430
91
4
3
2
21
1
2.24619
0.11439
0.00000
0.01457
0.03169
92
5
2
3
25
1
0.00000
0.02116
0.13113
0.01611
0.00000
Table 14, continued
Inputs (controllable factors)
Outputs (response variables)
Scenario
Bed
Nurse
Doctor
Triage
Pharmacy
1
2
3
4
5
Efficiency
nurse
employee
93
5
2
1
22
3
1.95359
0.07927
0.11998
0.00320
0.06328
94
7
3
1
22
3
0.41312
0.10378
0.11391
0.00241
0.03628
95
5
3
1
24
1
0.00000
0.00000
0.12700
0.01030
0.05595
96
5
3
3
22
2
2.06202
0.23468
0.01680
0.00985
0.00000
97
7
3
2
24
1
2.75541
0.13321
0.02021
0.01585
0.02327
98
4
1
3
23
2
0.00000
0.17056
0.75383
0.00142
0.00000
99
5
3
2
24
3
0.17265
0.09992
0.26459
0.00276
0.02435
100
5
2
1
23
1
1.98487
0.12669
0.00000
0.01265
0.04609
101
7
3
2
21
3
3.03965
0.23083
0.07336
0.00242
0.01902
102
6
2
3
22
2
2.03329
0.27587
0.00000
0.00615
0.00000
103
4
3
1
22
3
0.02276
0.00215
0.15531
0.00420
0.06475
104
5
3
2
23
3
1.71731
0.17579
0.17595
0.00339
0.01939
105
6
3
1
24
1
0.00000
0.00000
0.12654
0.00894
0.05828
106
3
1
1
22
3
4.77621
0.29832
1.48507
0.00000
0.06753
107
4
2
1
22
1
2.31335
0.16229
0.00000
0.01212
0.04639
108
5
1
1
24
2
3.39164
0.09810
0.00000
0.00850
0.04167
109
6
3
2
23
3
2.21017
0.18580
0.12196
0.00260
0.02068
110
5
1
2
23
2
1.06391
0.07727
0.08952
0.00414
0.01223
111
5
3
2
24
1
2.37600
0.08480
0.03523
0.01693
0.02575
112
6
1
2
25
2
0.68276
0.00000
0.00000
0.00555
0.00900
113
5
1
3
22
1
0.00000
0.00000
0.52533
0.00871
0.00000
114
7
2
3
21
1
0.84985
0.17621
0.00000
0.01154
0.00000
115
4
1
2
24
1
0.46611
0.04644
0.34405
0.00778
0.01424
116
6
2
2
24
1
2.73013
0.30092
0.00000
0.01054
0.00845
117
6
3
2
23
2
3.03102
0.25442
0.02883
0.00677
0.01512
118
4
1
3
21
3
1.06685
0.20840
1.09384
0.00000
0.01224
119
3
1
2
24
1
0.50156
0.00000
1.19010
0.00651
0.03444
120
4
1
1
23
1
3.12505
0.12321
0.20538
0.00921
0.04162
121
6
2
2
24
2
3.00816
0.33261
0.01809
0.00666
0.00694
122
3
1
1
25
2
0.23479
0.00000
1.51962
0.00247
0.06163
123
7
3
1
25
2
0.07684
0.03108
0.09457
0.00685
0.05493
124
7
3
3
22
3
3.34728
0.34198
0.00000
0.00470
0.00878
125
4
2
3
22
2
0.72762
0.34608
0.34934
0.00341
0.00000
126
6
3
1
23
2
0.04627
0.01452
0.11336
0.00522
0.05733
127
4
2
3
24
3
0.99025
0.22461
0.65201
0.00185
0.00702
128
3
1
3
25
1
0.00000
0.00000
0.67543
0.01103
0.00000
129
7
3
3
25
1
0.47188
0.05600
0.00000
0.02090
0.00000
130
3
3
3
24
2
0.25092
0.04723
0.93572
0.00862
0.00057
131
4
1
2
21
1
2.16255
0.25644
0.22077
0.00666
0.02100
132
6
1
1
23
1
2.69953
0.16452
0.00000
0.00678
0.02467
133
4
2
1
24
3
0.09718
0.00000
0.51137
0.00255
0.07343
134
5
1
2
21
3
1.91505
0.14670
0.21757
0.00440
0.01738
135
6
2
3
24
1
0.00000
0.09822
0.00000
0.01546
0.00000
136
6
2
3
23
3
0.92648
0.17980
0.00000
0.00633
0.00081
137
4
1
3
24
3
0.56195
0.11041
0.74712
0.00087
0.01742
138
6
1
1
24
3
2.71400
0.00000
0.00000
0.00466
0.04314
139
6
3
2
22
3
3.19151
0.24267
0.07207
0.00290
0.01591
140
4
3
3
21
2
2.02432
0.25011
0.18424
0.00847
0.00000
141
6
1
2
25
1
0.64640
0.10767
0.05482
0.00642
0.00000
142
5
1
3
25
2
0.00000
0.00000
0.42246
0.00538
0.00000
143
4
3
2
24
1
1.75815
0.06956
0.12677
0.01625
0.02253
144
5
1
3
24
1
0.00000
0.00000
0.59967
0.01125
0.00000
145
3
3
3
25
2
0.13382
0.04418
0.98832
0.00857
0.00066
146
3
3
1
23
1
0.36039
0.02650
0.06619
0.01183
0.05089
147
4
2
3
23
1
0.00000
0.04393
0.21350
0.01437
0.00000
148
7
2
2
22
2
3.15643
0.30670
0.00000
0.00581
0.01986
149
7
3
2
24
2
2.61413
0.15651
0.09932
0.00663
0.03179
150
3
1
3
22
1
0.00000
0.27426
0.69019
0.00275
0.00000
151
7
3
1
21
2
0.40443
0.10280
0.06615
0.00442
0.04535
Table 14, continued
Inputs (controllable factors)
Outputs (response variables)
Scenario
Bed
Nurse
Doctor
Triage
Pharmacy
1
2
3
4
5
Efficiency
nurse
employee
152
4
1
3
24
1
0.00000
0.00000
0.48785
0.01215
0.00000
153
7
3
3
24
2
2.43211
0.24569
0.00000
0.01098
0.00000
154
6
1
3
22
2
0.00000
0.03786
0.20810
0.00465
0.00000
155
5
3
2
22
3
3.15699
0.25981
0.08257
0.00371
0.01490
156
7
2
3
22
1
0.62051
0.16033
0.00000
0.01253
0.00000
157
3
3
1
24
3
0.00000
0.00000
0.43109
0.00252
0.06702
158
7
2
2
24
2
3.28028
0.27720
0.01210
0.00668
0.02236
159
7
3
3
23
3
3.33544
0.32633
0.00000
0.00476
0.00682
160
6
1
2
21
3
1.34315
0.07448
0.01369
0.00478
0.01250
161
5
3
2
24
2
1.47538
0.12678
0.12839
0.00823
0.02234
162
3
1
3
22
2
0.12256
0.30968
1.08801
0.00000
0.00000
163
7
1
1
24
3
2.48179
0.00000
0.00000
0.00657
0.03521
164
7
3
2
24
3
1.21440
0.12317
0.15347
0.00203
0.03021
165
7
2
3
24
2
0.96162
0.20411
0.00000
0.00772
0.00000
166
3
2
3
22
3
2.13415
0.31138
1.15687
0.00000
0.01874
167
7
3
2
25
3
0.91501
0.10756
0.16771
0.00195
0.03144
168
4
3
3
21
3
2.33133
0.34039
0.49673
0.00144
0.00605
169
3
3
2
23
3
0.00000
0.00000
1.24472
0.00092
0.06141
170
7
2
1
22
2
1.60354
0.14159
0.00035
0.00727
0.04607
171
6
1
2
21
1
0.93028
0.14186
0.08497
0.00604
0.00743
172
7
2
1
22
1
2.16689
0.24395
0.00000
0.00881
0.03553
173
7
1
3
22
1
0.07022
0.02039
0.00325
0.00714
0.00325
174
6
1
2
24
3
1.15275
0.00000
0.00000
0.00420
0.01310
175
3
1
3
21
2
0.05211
0.32509
1.09743
0.00000
0.00000
176
6
3
1
22
2
0.11530
0.02816
0.10860
0.00503
0.05448
177
7
1
2
24
2
0.78282
0.00000
0.00000
0.00565
0.00839
178
4
3
3
22
1
0.24365
0.03034
0.13319
0.01617
0.00000
179
4
1
1
23
3
3.73308
0.22183
0.52332
0.00195
0.05329
180
6
1
1
23
2
3.02248
0.04731
0.00000
0.00808
0.03551
181
5
3
1
21
1
0.60532
0.04500
0.03238
0.01211
0.05047
182
3
3
1
24
1
0.00000
0.00590
0.18733
0.01100
0.05245
183
4
1
2
22
1
1.66632
0.20443
0.19296
0.00675
0.01718
184
6
2
3
24
2
0.89278
0.21952
0.00157
0.00922
0.00000
185
6
3
3
22
3
2.99023
0.34122
0.00000
0.00545
0.00357
186
5
1
3
24
2
0.00000
0.00000
0.43772
0.00487
0.00000
187
4
1
2
24
2
0.35369
0.09214
0.64516
0.00087
0.01855
188
4
1
2
25
1
0.05638
0.00000
0.45499
0.00850
0.01522
189
7
3
3
23
1
1.04790
0.12173
0.00000
0.01877
0.00000
190
4
2
1
21
3
4.63475
0.16667
0.65865
0.00021
0.07909
191
4
2
3
24
1
0.00000
0.01669
0.28837
0.01456
0.00000
192
7
2
3
21
3
1.13057
0.17523
0.00000
0.00555
0.00758
193
4
1
2
25
3
0.00000
0.07586
0.51607
0.00107
0.01990
194
7
3
1
21
1
0.00000
0.07307
0.04056
0.00901
0.04922
195
5
2
3
22
2
1.62585
0.29968
0.09937
0.00640
0.00000
196
5
2
1
22
1
2.46428
0.17984
0.00000
0.01200
0.04450
197
6
2
1
22
3
1.38909
0.08645
0.03246
0.00354
0.05807
198
4
1
3
22
2
0.00000
0.25386
0.89018
0.00000
0.00000
199
5
1
2
22
2
1.43361
0.12339
0.10153
0.00435
0.01459
200
5
1
2
22
3
1.68885
0.11766
0.19177
0.00391
0.01750
201
4
2
2
25
1
0.63793
0.06417
0.45046
0.01407
0.00041
202
6
2
1
23
2
0.49398
0.09274
0.05121
0.00969
0.04880
203
4
2
2
25
3
0.00000
0.03528
1.08219
0.00000
0.03953
204
5
3
1
22
2
0.00000
0.01148
0.09669
0.00520
0.05776
205
4
2
3
25
1
0.00000
0.00181
0.35597
0.01457
0.00000
206
3
1
1
23
1
3.22153
0.07633
1.06032
0.00839
0.05177
207
3
3
3
24
1
0.00000
0.03406
0.75299
0.01296
0.00000
208
3
3
3
22
3
1.18473
0.28272
1.05586
0.00000
0.00583
209
6
3
3
23
3
2.65146
0.31092
0.06540
0.00582
0.00060
210
4
3
2
25
2
0.00000
0.01404
0.49113
0.00689
0.02880
Table 14, continued
Inputs (controllable factors)
Outputs (response variables)
Scenario
Bed
Nurse
Doctor
Triage
Pharmacy
1
2
3
4
5
Efficiency
nurse
employee
211
5
3
3
21
1
1.24565
0.12989
0.00000
0.01643
0.00000
212
6
2
2
22
1
2.96025
0.32254
0.00000
0.00921
0.01615
213
7
1
3
23
2
0.00000
0.00098
0.02173
0.00526
0.00161
214
5
1
2
23
3
1.19173
0.06353
0.11657
0.00335
0.01646
215
6
1
3
22
3
0.00000
0.07942
0.35322
0.00334
0.00000
216
4
2
1
25
1
0.37095
0.01789
0.16698
0.01297
0.04880
217
5
1
2
25
2
0.34811
0.01743
0.28208
0.00378
0.01240
218
4
3
2
21
2
2.08258
0.24790
0.00000
0.00834
0.02565
219
3
3
2
21
2
0.17053
0.16684
0.28955
0.00744
0.03335
220
5
2
3
23
2
0.99973
0.23094
0.11083
0.00843
0.00000
221
6
2
3
23
2
1.51793
0.25258
0.00000
0.00756
0.00000
222
3
1
1
21
3
5.42046
0.32743
1.22149
0.00035
0.06405
223
4
2
2
23
3
1.90148
0.21603
0.88283
0.00000
0.03468
224
6
1
2
23
1
0.96237
0.11421
0.05664
0.00563
0.00480
225
5
1
1
23
3
3.31337
0.13248
0.00000
0.00453
0.04257
226
3
1
1
23
3
3.39640
0.21627
1.66479
0.00000
0.07206
227
3
3
3
21
3
1.45576
0.32511
0.98568
0.00000
0.00673
228
5
1
3
23
1
0.00000
0.00000
0.56475
0.01030
0.00000
229
6
2
2
21
2
3.15905
0.34231
0.00000
0.00583
0.01713
230
6
3
2
24
2
2.70574
0.18917
0.09317
0.00679
0.02125
231
6
2
1
21
1
2.84845
0.28964
0.00000
0.01010
0.03402
232
7
1
1
24
1
2.92481
0.10070
0.00000
0.00297
0.02887
233
3
3
1
25
2
0.00000
0.00000
0.45494
0.00275
0.06453
234
4
1
1
21
3
4.87725
0.30696
0.41762
0.00299
0.05027
235
6
2
1
23
3
0.87797
0.06314
0.05378
0.00372
0.05840
236
3
2
2
22
1
0.58172
0.14529
0.70097
0.00921
0.01242
237
3
3
1
21
3
1.40267
0.05885
0.61321
0.00132
0.07904
238
4
1
1
22
1
3.42050
0.19279
0.17004
0.00918
0.04191
239
3
2
1
25
1
0.00000
0.00000
0.45386
0.01078
0.04730
240
3
2
1
25
2
0.00000
0.00000
0.89541
0.00454
0.05919
241
6
1
3
21
1
0.00000
0.05035
0.23312
0.00692
0.00072
242
3
2
2
21
3
4.04988
0.30236
1.42408
0.00000
0.05376
243
7
3
2
25
1
2.89627
0.10113
0.04403
0.01631
0.02634
244
4
3
2
24
3
0.00000
0.00201
0.67990
0.00192
0.03774
245
3
3
2
25
3
0.00000
0.00000
1.33131
0.00039
0.05521
246
7
3
1
22
1
0.00000
0.03297
0.07105
0.00869
0.05296
247
6
1
1
21
3
3.38715
0.13100
0.00000
0.00597
0.02985
248
3
3
2
25
1
0.27342
0.03898
0.60096
0.01379
0.01201
249
3
1
2
23
2
1.44441
0.25165
1.36861
0.00000
0.02945
250
3
3
3
23
2
0.36712
0.05630
0.90813
0.00856
0.00069
251
4
1
1
21
2
4.37058
0.29735
0.35305
0.00600
0.04807
252
6
1
3
25
2
0.00000
0.00000
0.38939
0.00564
0.00000
253
7
1
3
21
1
0.12521
0.03966
0.00000
0.00688
0.00367
254
6
2
2
21
1
3.00472
0.32706
0.00000
0.00874
0.01836
255
6
3
2
24
1
2.50626
0.11130
0.02800
0.01685
0.02184
256
3
2
1
24
1
0.40366
0.04921
0.29983
0.01122
0.04607
257
3
3
1
22
1
0.73871
0.05880
0.00000
0.01191
0.04959
258
3
2
3
22
1
0.00000
0.13706
0.72155
0.00860
0.00000
259
3
1
3
25
3
0.80787
0.15485
0.67953
0.00034
0.02347
260
3
2
1
23
3
2.41238
0.00440
1.46691
0.00086
0.09846
261
3
1
3
23
3
1.69582
0.21824
1.00904
0.00000
0.02552
262
6
1
3
24
1
0.00000
0.00000
0.44863
0.00988
0.00000
263
3
3
1
22
3
0.33289
0.00723
0.50138
0.00235
0.07366
264
4
1
1
24
3
1.15182
0.04308
0.62342
0.00195
0.05584
265
6
2
2
25
2
2.75902
0.30337
0.06053
0.00696
0.00621
266
4
2
2
23
2
1.72711
0.25032
0.33195
0.00405
0.01384
267
7
3
1
25
3
0.31080
0.07792
0.10278
0.00323
0.04335
268
4
3
1
25
2
0.00000
0.00000
0.15695
0.00469
0.06240
269
4
2
2
21
3
3.64838
0.29810
0.64913
0.00000
0.04049
Table 14, continued
Inputs (controllable factors)
Outputs (response variables)
Scenario
Bed
Nurse
Doctor
Triage
Pharmacy
1
2
3
4
5
Efficiency
nurse
employee
270
6
1
2
25
3
1.00212
0.00000
0.00000
0.00427
0.01427
271
5
3
1
21
3
0.19727
0.03366
0.09138
0.00444
0.05707
272
3
3
3
22
1
0.00000
0.03762
0.61966
0.01363
0.00050
273
4
2
1
24
2
0.00000
0.00000
0.27373
0.00958
0.05608
274
6
1
2
23
3
1.24573
0.00000
0.00000
0.00427
0.01302
275
4
1
1
21
1
3.72885
0.26100
0.21612
0.00914
0.04343
276
3
3
2
21
1
1.77046
0.09610
0.12039
0.01439
0.02774
277
7
3
2
22
2
3.06678
0.25978
0.02474
0.00649
0.01861
278
5
1
3
25
3
0.00000
0.00000
0.40428
0.00237
0.00829
279
3
3
3
23
3
0.89194
0.19480
1.05739
0.00193
0.00750
280
3
3
2
25
2
0.00000
0.00000
0.98540
0.00485
0.03159
281
4
3
3
24
1
0.00000
0.01188
0.36517
0.01484
0.00000
282
5
3
3
25
3
0.78215
0.16847
0.47546
0.00676
0.00000
283
4
3
3
21
1
0.72527
0.06415
0.03478
0.01661
0.00000
284
7
1
1
21
1
2.03414
0.14738
0.00000
0.00570
0.01812
285
5
2
1
25
3
0.00000
0.00000
0.17478
0.00393
0.06162
286
6
1
1
25
3
2.25847
0.00000
0.00000
0.00536
0.04626
287
7
1
2
24
1
0.78353
0.08711
0.03790
0.00516
0.00115
288
6
3
1
21
1
0.00000
0.02365
0.06838
0.01070
0.05237
289
4
3
2
22
2
1.11593
0.14828
0.00000
0.00896
0.02788
290
7
2
1
25
3
0.36994
0.06747
0.02991
0.00441
0.05648
291
5
3
3
24
3
1.30746
0.21726
0.38629
0.00637
0.00000
292
3
3
3
25
3
0.34240
0.06081
1.12983
0.00431
0.01050
293
5
3
1
23
2
0.00000
0.00308
0.10723
0.00504
0.05989
294
5
3
3
21
3
3.01345
0.35831
0.09838
0.00441
0.00537
295
3
2
3
24
3
1.48365
0.23844
1.00740
0.00000
0.01997
296
3
1
3
21
3
1.68558
0.22365
1.07031
0.00000
0.02401
297
7
2
2
24
1
2.77674
0.29436
0.00000
0.00949
0.01548
298
5
1
1
21
2
3.39129
0.23520
0.00000
0.00864
0.03829
299
7
3
2
23
2
2.86183
0.20605
0.06847
0.00650
0.02537
300
6
1
3
25
1
0.00000
0.00000
0.55152
0.01076
0.00000
301
6
3
3
23
1
0.81085
0.09446
0.00000
0.01876
0.00000
302
4
3
1
22
2
0.00000
0.01245
0.08651
0.00555
0.05844
303
4
3
3
24
3
1.07882
0.17889
0.62294
0.00547
0.00006
304
3
2
1
21
3
5.25268
0.16448
1.30095
0.00076
0.09389
305
6
1
1
21
1
2.20150
0.19275
0.00000
0.00845
0.02219
306
6
1
3
21
2
0.00000
0.09105
0.26781
0.00421
0.00000
307
3
2
2
23
3
2.70439
0.21711
1.65714
0.00000
0.05867
308
7
2
2
22
3
4.37629
0.24093
0.00000
0.00219
0.02919
309
7
3
1
23
3
0.37974
0.09560
0.11182
0.00264
0.03833
310
4
2
2
21
2
2.99082
0.36601
0.13583
0.00438
0.01766
311
4
1
3
22
1
0.00000
0.12732
0.63635
0.00714
0.00000
312
5
1
3
21
2
0.00000
0.20077
0.56292
0.00197
0.00000
313
7
3
1
24
3
0.34782
0.08724
0.10776
0.00292
0.04068
314
3
1
1
23
2
2.99316
0.16575
1.62368
0.00196
0.05834
315
7
1
2
21
1
0.77750
0.11736
0.00000
0.00610
0.00517
316
6
3
2
22
2
3.10811
0.30272
0.00000
0.00669
0.01095
317
7
2
2
21
1
2.60345
0.30393
0.00000
0.00798
0.01734
318
4
3
3
24
2
0.33982
0.04815
0.50695
0.01075
0.00000
319
6
1
2
21
2
0.68321
0.08408
0.01828
0.00569
0.00800
320
6
3
3
23
2
2.22394
0.25357
0.00000
0.01017
0.00000
321
7
2
3
23
2
1.33294
0.21673
0.00000
0.00666
0.00000
322
5
2
1
23
3
0.87860
0.02510
0.12932
0.00383
0.06330
323
7
2
1
25
1
0.32261
0.09295
0.02311
0.00847
0.04839
324
5
1
1
25
1
2.93247
0.13334
0.00000
0.00806
0.03635
325
5
1
3
23
3
0.00000
0.07472
0.72903
0.00174
0.00516
326
4
3
1
24
1
0.62868
0.01808
0.11677
0.01137
0.05288
327
3
1
2
25
1
0.20171
0.00000
1.18178
0.00789
0.03471
328
3
2
2
21
2
2.03764
0.33321
1.24511
0.00000
0.03335
Table 14, continued
Inputs (controllable factors)
Outputs (response variables)
Scenario
Bed
Nurse
Doctor
Triage
Pharmacy
1
2
3
4
5
Efficiency
nurse
employee
329
5
3
2
22
1
2.48368
0.13838
0.00000
0.01507
0.02633
330
6
3
3
25
2
1.03576
0.10952
0.09486
0.01327
0.00000
331
5
1
2
24
1
0.87768
0.12168
0.03524
0.00742
0.00537
332
3
3
3
22
2
0.47546
0.08495
0.92293
0.00803
0.00036
333
6
1
1
22
1
2.42431
0.17885
0.00000
0.00764
0.02285
334
3
3
1
25
1
0.00000
0.00000
0.31976
0.00949
0.05518
335
7
2
1
23
3
0.89686
0.08082
0.02726
0.00304
0.05679
336
5
3
2
23
1
2.41336
0.10251
0.00000
0.01627
0.02658
337
7
3
1
23
1
0.00000
0.00747
0.08907
0.00849
0.05532
338
7
3
3
21
2
2.79584
0.34127
0.00000
0.00731
0.00428
339
6
1
1
25
2
3.14198
0.00000
0.00000
0.00784
0.04569
340
3
1
3
21
1
0.00000
0.34488
0.69540
0.00096
0.00000
341
4
3
2
25
1
1.38624
0.05939
0.25023
0.01627
0.01798
342
3
1
1
22
2
4.17242
0.29411
1.52169
0.00169
0.05566
343
4
1
3
24
2
0.00000
0.07805
0.55261
0.00336
0.00000
344
5
2
2
23
3
2.59515
0.25392
0.36486
0.00251
0.02395
345
6
1
1
23
3
3.03288
0.00000
0.00000
0.00433
0.03846
346
3
3
3
23
1
0.00000
0.03290
0.66845
0.01333
0.00000
347
6
3
1
22
3
0.25160
0.05840
0.10903
0.00371
0.04668
348
5
3
2
25
1
2.33255
0.07601
0.07661
0.01719
0.02462
349
3
1
1
25
1
1.69148
0.00000
1.21211
0.00781
0.05043
350
4
2
2
21
1
2.95687
0.31240
0.00000
0.00926
0.01867
351
6
1
2
22
1
0.98505
0.12093
0.06291
0.00566
0.00630
352
7
2
3
23
1
0.39162
0.14734
0.00000
0.01337
0.00000
353
6
3
3
24
1
0.36948
0.05663
0.00000
0.01972
0.00000
354
5
3
1
25
2
0.00000
0.00000
0.11830
0.00504
0.06198
355
5
3
1
24
2
0.00000
0.00000
0.11328
0.00499
0.06120
356
3
3
3
21
1
0.00000
0.06173
0.63053
0.01351
0.00062
357
4
1
3
22
3
1.11397
0.20065
1.12285
0.00000
0.01478
358
6
3
1
25
1
0.00000
0.00000
0.12570
0.00879
0.05858
359
3
3
1
24
2
0.00000
0.00000
0.37301
0.00374
0.06351
360
5
3
3
23
2
1.39482
0.15335
0.10383
0.01142
0.00000
361
6
1
3
22
1
0.00000
0.00000
0.23540
0.00774
0.00000
362
3
1
2
22
2
2.02782
0.30684
1.37489
0.00000
0.02780
363
6
1
1
22
2
2.67840
0.07940
0.00000
0.00884
0.03073
364
5
3
3
25
2
0.21096
0.05181
0.29574
0.01256
0.00000
365
3
1
2
23
3
2.35998
0.25336
1.20413
0.00000
0.03502
366
5
2
3
21
2
2.15192
0.37094
0.10945
0.00404
0.00000
367
5
2
2
24
1
2.38873
0.24249
0.02331
0.01153
0.00402
368
5
3
1
24
3
0.00000
0.00015
0.11300
0.00445
0.06193
369
7
2
2
24
3
3.95826
0.17681
0.04323
0.00138
0.03591
370
3
2
2
22
3
3.62406
0.27980
1.61247
0.00000
0.05628
371
4
2
2
23
1
2.07332
0.16501
0.22422
0.01155
0.01070
372
4
2
3
21
3
1.77373
0.35258
0.73183
0.00000
0.00350
373
3
2
3
24
2
0.00000
0.07611
0.76987
0.00721
0.00000
374
6
3
2
25
3
0.47923
0.09787
0.20756
0.00188
0.02753
375
5
2
1
21
3
3.58951
0.17138
0.12643
0.00169
0.06279
376
6
2
3
22
1
0.81249
0.18317
0.00000
0.01336
0.00000
377
5
1
2
21
2
1.61751
0.17200
0.21021
0.00441
0.01589
378
7
2
3
22
2
1.59335
0.22538
0.00000
0.00589
0.00511
379
5
1
1
25
3
0.67105
0.00000
0.13231
0.00444
0.05185
380
4
2
2
24
3
0.34860
0.12097
0.98341
0.00000
0.03495
381
5
2
2
23
1
2.78229
0.29112
0.00000
0.01035
0.00898
382
7
1
2
23
1
0.76802
0.09075
0.02585
0.00526
0.00248
383
7
2
1
25
2
0.34663
0.07118
0.02990
0.00842
0.05190
384
5
3
1
25
3
0.00000
0.00000
0.12408
0.00439
0.06251
385
4
3
1
23
2
0.00000
0.00075
0.11111
0.00517
0.06051
386
3
2
1
21
2
2.10527
0.23331
0.60359
0.00549
0.06025
387
6
2
3
25
1
0.00000
0.05554
0.01652
0.01628
0.00000
Table 14, continued
Inputs (controllable factors)
Outputs (response variables)
Scenario
Bed
Nurse
Doctor
Triage
Pharmacy
1
2
3
4
5
Efficiency
nurse
employee
388
6
2
1
21
2
2.21221
0.22617
0.00000
0.00904
0.03720
389
4
1
1
25
1
2.29040
0.01735
0.42300
0.00944
0.04325
390
6
3
3
25
1
0.00000
0.02714
0.00000
0.02003
0.00000
391
5
2
2
23
2
2.81703
0.34085
0.02883
0.00603
0.00419
392
6
2
1
22
1
2.51824
0.24498
0.00000
0.01063
0.03750
393
5
1
1
24
1
3.17574
0.17260
0.00000
0.00815
0.03421
394
7
1
2
21
2
0.52704
0.05606
0.00000
0.00638
0.00617
395
5
1
3
23
2
0.00000
0.04700
0.48984
0.00415
0.00000
396
7
2
1
21
2
2.18758
0.18632
0.00000
0.00698
0.04180
397
4
1
2
22
3
2.00820
0.21036
0.72694
0.00034
0.02550
398
4
1
1
23
2
3.50832
0.16356
0.31034
0.00662
0.04570
399
5
2
2
22
3
3.33447
0.30017
0.23171
0.00303
0.02739
400
6
1
3
21
3
0.00000
0.14233
0.37771
0.00280
0.00000
401
3
2
3
23
2
0.00000
0.21748
0.77311
0.00362
0.00000
402
3
1
2
24
2
0.54676
0.14106
1.22663
0.00000
0.03143
403
6
2
2
21
3
3.82785
0.31470
0.00000
0.00446
0.02871
404
7
1
1
24
2
2.90750
0.00000
0.00000
0.00558
0.03885
405
3
3
1
21
1
1.13625
0.11495
0.00000
0.01132
0.04747
406
4
2
3
25
3
0.72457
0.18577
0.67429
0.00234
0.00747
407
7
1
1
23
1
2.78254
0.12548
0.00000
0.00396
0.02431
408
7
1
1
22
3
3.04709
0.00000
0.00000
0.00510
0.03199
409
5
3
2
21
1
2.60170
0.19432
0.00000
0.01331
0.02483
410
5
3
3
25
1
0.00000
0.00307
0.18009
0.01662
0.00000
411
6
2
2
22
2
3.12121
0.34152
0.00000
0.00612
0.01349
412
7
3
3
23
2
2.62268
0.29587
0.00000
0.00942
0.00000
413
6
1
1
24
2
3.24640
0.01641
0.00000
0.00776
0.04090
414
3
1
2
22
3
2.54879
0.26118
1.18352
0.00000
0.03465
415
4
3
2
22
1
2.14636
0.08805
0.00000
0.01551
0.02992
416
3
1
3
23
1
0.00000
0.14119
0.64879
0.00646
0.00000
417
6
1
2
24
2
0.78108
0.00377
0.00000
0.00545
0.00879
418
6
1
1
21
2
2.41012
0.12509
0.00000
0.00993
0.02789
419
6
2
3
21
3
1.55741
0.24690
0.00000
0.00504
0.00728
420
5
2
1
24
1
1.07765
0.06655
0.05776
0.01301
0.04824
421
7
1
3
25
3
0.00000
0.00000
0.14776
0.00448
0.00000
422
3
3
1
23
2
0.00000
0.00000
0.29783
0.00458
0.06255
423
4
2
1
24
1
1.50853
0.07999
0.08719
0.01296
0.04682
424
3
1
2
22
1
2.13590
0.21400
1.33449
0.00280
0.03432
425
4
3
2
23
1
2.01282
0.07754
0.02692
0.01602
0.02675
426
7
2
2
22
1
2.66608
0.30480
0.00000
0.00837
0.01695
427
7
3
3
25
2
2.14260
0.17812
0.03945
0.01271
0.00000
428
3
2
2
25
1
0.00000
0.01929
0.88140
0.01256
0.00358
429
6
2
3
25
3
0.36993
0.13868
0.00000
0.00723
0.00000
430
6
1
3
24
3
0.00000
0.00000
0.28260
0.00380
0.00000
431
7
2
1
24
2
0.72150
0.08852
0.02400
0.00799
0.05073
432
3
2
2
24
1
0.00000
0.04037
0.80604
0.01148
0.00575
433
3
2
2
25
2
0.00000
0.00000
1.41454
0.00036
0.04452
434
5
1
2
24
3
0.65681
0.01606
0.12324
0.00288
0.01535
435
3
1
3
22
3
1.72437
0.22356
1.05428
0.00000
0.02489
436
3
2
1
24
2
0.00000
0.00000
0.81676
0.00551
0.05959
437
3
3
2
24
2
0.00000
0.00000
0.79839
0.00553
0.03275
438
6
3
1
21
3
0.40542
0.07866
0.10390
0.00346
0.04299
439
5
2
3
24
1
0.00000
0.04642
0.06972
0.01583
0.00000
440
6
3
1
23
1
0.00000
0.00000
0.12206
0.00933
0.05733
441
5
1
2
22
1
1.52866
0.17425
0.02217
0.00656
0.01122
442
7
1
2
23
3
1.39289
0.00000
0.00000
0.00462
0.01268
443
4
1
2
23
3
1.45852
0.18098
0.70956
0.00018
0.02478
444
5
3
3
23
3
1.90471
0.26540
0.28705
0.00583
0.00000
445
6
2
3
22
3
1.27338
0.21239
0.00000
0.00577
0.00431
446
7
2
3
25
1
0.00000
0.10353
0.00000
0.01491
0.00000
Table 14, continued
Inputs (controllable factors)
Outputs (response variables)
Scenario
Bed
Nurse
Doctor
Triage
Pharmacy
1
2
3
4
5
Efficiency
nurse
employee
447
4
1
2
23
2
0.93822
0.15950
0.65867
0.00052
0.01982
448
6
2
2
25
1
2.47665
0.26851
0.00000
0.01154
0.00377
449
7
1
1
23
2
2.91973
0.00000
0.00000
0.00638
0.03392
450
3
2
3
24
1
0.00000
0.00979
0.72141
0.01224
0.00000
451
3
2
2
23
1
0.14854
0.07193
0.74541
0.01046
0.00938
452
5
2
2
25
1
1.77172
0.16772
0.08565
0.01319
0.00000
453
4
3
2
21
3
2.99135
0.27920
0.17774
0.00402
0.02850
454
6
3
2
21
2
3.07379
0.33298
0.00000
0.00657
0.00879
455
3
3
2
24
3
0.00000
0.00000
1.27692
0.00058
0.05704
456
4
3
2
23
3
0.00000
0.04714
0.55344
0.00291
0.03560
457
6
3
1
21
2
0.22542
0.05098
0.09664
0.00486
0.05018
458
3
1
1
24
2
1.38207
0.00000
1.57904
0.00242
0.06012
459
4
1
1
22
3
4.81197
0.29334
0.48387
0.00244
0.05230
460
3
3
2
22
1
1.51978
0.07195
0.17388
0.01471
0.02500
461
5
1
1
23
1
3.19451
0.19912
0.00000
0.00851
0.03296
462
7
1
1
23
3
2.74869
0.00000
0.00000
0.00573
0.03409
463
4
3
1
21
3
0.36462
0.02832
0.18066
0.00370
0.06577
464
4
2
1
25
2
0.00000
0.00000
0.33042
0.00908
0.05697
465
7
3
2
25
2
2.45919
0.12071
0.11621
0.00700
0.03643
466
5
3
2
23
2
2.24829
0.20373
0.01734
0.00807
0.01812
467
7
3
3
21
1
1.60725
0.19626
0.00000
0.01570
0.00000
468
4
3
3
25
1
0.00000
0.01300
0.46753
0.01441
0.00000
469
3
2
2
23
2
0.00000
0.10678
1.44287
0.00000
0.04107
470
7
2
3
25
2
0.50347
0.18301
0.00000
0.00909
0.00000
471
7
2
3
23
3
0.94339
0.11628
0.00000
0.00550
0.00429
472
6
3
1
24
2
0.00000
0.00540
0.11564
0.00545
0.05918
473
4
2
1
22
3
2.64795
0.06069
0.60702
0.00158
0.07936
474
4
2
1
23
2
0.00000
0.00964
0.20369
0.00970
0.05512
475
3
2
2
25
3
0.00000
0.00000
1.55272
0.00000
0.06085
476
3
3
1
22
2
0.00000
0.01397
0.23962
0.00509
0.06135
477
3
2
3
21
2
0.42831
0.42850
0.80667
0.00000
0.00000
478
5
3
2
22
2
2.64245
0.27166
0.00000
0.00751
0.01481
479
6
3
2
23
1
2.57322
0.16302
0.00000
0.01555
0.01925
480
5
1
2
23
1
1.27971
0.14770
0.01213
0.00684
0.00844
481
5
3
3
21
2
2.58547
0.31609
0.00000
0.00836
0.00000
482
6
3
3
21
2
2.72432
0.33806
0.00000
0.00793
0.00159
483
6
2
1
24
3
0.52058
0.05047
0.06590
0.00390
0.05794
484
7
2
2
25
1
2.78758
0.27184
0.00000
0.01035
0.01486
485
6
2
1
22
2
1.34174
0.15240
0.01044
0.00944
0.04365
486
7
1
1
25
2
2.61212
0.00000
0.00000
0.00508
0.04276
487
5
1
2
25
3
0.22876
0.00000
0.18163
0.00269
0.01591
488
4
1
1
25
2
2.01064
0.00000
0.56472
0.00767
0.05228
489
3
1
3
24
3
1.45852
0.19759
0.89284
0.00000
0.02558
490
3
2
1
22
3
3.85656
0.08778
1.42371
0.00087
0.09791
491
4
2
1
21
2
1.33148
0.20349
0.06809
0.00808
0.05151
492
5
2
1
25
1
0.00000
0.00411
0.12197
0.01289
0.05112
493
4
2
3
23
2
0.38220
0.21689
0.30907
0.00728
0.00000
494
4
1
2
24
3
0.58340
0.12742
0.57637
0.00066
0.02203
495
7
1
3
21
3
0.03562
0.08550
0.13486
0.00380
0.00000
496
5
3
1
23
1
0.01858
0.00329
0.11774
0.01102
0.05445
497
6
1
3
25
3
0.00000
0.00000
0.31007
0.00367
0.00101
498
4
3
3
22
2
1.27319
0.13484
0.30073
0.01024
0.00000
499
5
2
2
22
2
3.02529
0.35106
0.00000
0.00594
0.00945
500
6
3
1
22
1
0.00000
0.00000
0.10655
0.00998
0.05546
501
6
2
3
23
1
0.35950
0.14440
0.00000
0.01444
0.00000
502
7
1
1
21
2
2.28513
0.02850
0.00000
0.00840
0.02437
503
7
3
2
23
1
2.77165
0.19467
0.00000
0.01455
0.01959
504
5
3
1
23
3
0.01452
0.00535
0.10739
0.00448
0.06093
505
4
3
3
22
3
1.91445
0.29579
0.53006
0.00284
0.00255
Table 14, continued
Inputs (controllable factors)
Outputs (response variables)
Scenario
Bed
Nurse
Doctor
Triage
Pharmacy
1
2
3
4
5
Efficiency
nurse
employee
506
7
2
3
22
3
1.04723
0.14001
0.00000
0.00547
0.00623
507
7
2
1
23
1
1.45407
0.18936
0.00000
0.00869
0.04050
508
7
1
2
21
3
1.13841
0.03774
0.00000
0.00491
0.01037
509
4
3
3
25
2
0.11637
0.03375
0.59768
0.01047
0.00000
510
6
2
1
21
3
2.33726
0.13796
0.00000
0.00315
0.05694
511
4
3
2
23
2
0.01374
0.07525
0.14776
0.00890
0.02889
512
5
3
3
22
3
2.50853
0.31660
0.18211
0.00505
0.00137
513
7
1
2
23
2
0.68265
0.00424
0.00000
0.00572
0.00738
514
5
1
1
22
1
3.14348
0.22524
0.00000
0.00913
0.03248
515
7
2
3
24
1
0.13040
0.13063
0.00000
0.01413
0.00000
516
4
3
3
23
1
0.00000
0.01607
0.25179
0.01545
0.00000
517
7
2
1
24
3
0.65044
0.07406
0.02862
0.00366
0.05686
518
7
3
3
24
1
0.75001
0.08612
0.00000
0.02000
0.00000
519
3
2
2
22
2
1.07739
0.24851
1.46433
0.00000
0.03756
520
3
1
2
23
1
1.18139
0.07167
1.27882
0.00480
0.03474
521
5
2
1
21
2
1.81161
0.22141
0.00000
0.00933
0.04249
522
5
2
3
22
3
1.47987
0.29267
0.19244
0.00376
0.00048
523
7
1
2
25
1
0.81419
0.08629
0.03849
0.00522
0.00009
524
7
1
1
21
3
3.35106
0.00000
0.00000
0.00507
0.02871
525
7
2
2
23
3
4.45277
0.21588
0.00000
0.00172
0.03267
526
6
1
2
24
1
0.85867
0.11210
0.05328
0.00589
0.00273
527
5
3
3
24
1
0.00000
0.01676
0.07671
0.01727
0.00000
528
5
1
1
23
2
3.40282
0.15273
0.00000
0.00816
0.03839
529
5
1
3
25
1
0.00000
0.00000
0.62175
0.01190
0.00000
530
5
2
3
22
1
0.51619
0.15104
0.00000
0.01375
0.00000
531
7
3
1
22
2
0.33601
0.07952
0.07710
0.00506
0.04868
532
7
3
1
23
2
0.26661
0.06087
0.08413
0.00569
0.05128
533
4
1
3
21
1
0.00000
0.24599
0.65153
0.00380
0.00000
534
7
1
3
23
1
0.00000
0.00644
0.03596
0.00765
0.00242
535
5
3
1
22
3
0.05747
0.01403
0.10312
0.00450
0.05936
536
3
2
3
23
3
1.99228
0.28406
1.11718
0.00000
0.02076
537
3
2
3
25
1
0.00000
0.00000
0.76818
0.01263
0.00000
538
3
1
1
25
3
0.00000
0.00000
1.61313
0.00000
0.08046
539
4
2
2
22
2
2.53424
0.32044
0.21872
0.00415
0.01500
540
6
2
3
21
1
1.23070
0.21599
0.00000
0.01215
0.00000
541
4
1
2
21
2
2.36912
0.26189
0.61476
0.00074
0.02428
542
3
2
1
23
1
1.16337
0.10998
0.15124
0.01130
0.04607
543
7
2
3
21
2
1.76930
0.23379
0.00000
0.00534
0.00937
544
6
2
2
22
3
3.69995
0.29177
0.00000
0.00450
0.02635
545
4
2
1
23
3
0.83017
0.00000
0.52445
0.00266
0.07612
546
6
3
3
25
3
1.04263
0.19205
0.29568
0.00686
0.00000
547
4
2
3
22
3
1.53591
0.32215
0.76222
0.00000
0.00499
548
7
2
3
24
3
0.79452
0.09903
0.00000
0.00572
0.00223
549
6
2
2
23
3
3.46950
0.26029
0.03372
0.00451
0.02524
550
6
3
1
24
3
0.10750
0.03337
0.10465
0.00414
0.05315
551
6
2
1
23
1
1.71983
0.17272
0.00000
0.01120
0.04209
552
5
1
1
25
2
3.10039
0.02092
0.00000
0.00927
0.04614
553
6
2
2
23
1
2.87963
0.31563
0.00000
0.00979
0.01284
554
5
1
2
24
2
0.66433
0.04346
0.16965
0.00395
0.01148
555
7
3
2
21
2
3.13616
0.30367
0.00000
0.00648
0.01337
556
7
2
2
23
1
2.72729
0.30290
0.00000
0.00886
0.01628
557
3
1
1
21
2
4.70253
0.34205
1.30791
0.00225
0.05371
558
6
3
2
22
1
2.71940
0.22944
0.00000
0.01362
0.01695
559
4
1
3
23
3
0.98948
0.17196
1.02954
0.00000
0.01688
560
7
1
3
25
1
0.00000
0.00000
0.20887
0.00920
0.00000
561
4
2
2
24
2
0.62337
0.17137
0.47695
0.00385
0.01530
562
7
3
3
22
1
1.34187
0.15981
0.00000
0.01728
0.00000
563
6
1
1
22
3
3.25075
0.04071
0.00000
0.00471
0.03331
564
6
2
1
25
3
0.15728
0.03937
0.07910
0.00416
0.05666
Table 14, continued
Inputs (controllable factors)
Outputs (response variables)
Scenario
Bed
Nurse
Doctor
Triage
Pharmacy
1
2
3
4
5
Efficiency
nurse
employee
565
3
1
3
25
2
0.00000
0.09189
0.67850
0.00274
0.00530
566
3
1
3
24
2
0.00000
0.18926
0.80738
0.00017
0.00358
567
7
2
2
25
3
2.84150
0.12515
0.09218
0.00125
0.03848
568
3
3
1
23
3
0.00000
0.00000
0.42906
0.00280
0.06915
569
6
2
1
24
1
0.53817
0.08967
0.03355
0.01145
0.04721
570
6
3
2
24
3
1.24182
0.13590
0.16657
0.00226
0.02493
571
4
1
1
24
2
2.83063
0.04332
0.41728
0.00722
0.04765
572
7
3
3
22
2
2.73142
0.32534
0.00000
0.00821
0.00205
573
4
1
3
23
1
0.00000
0.01081
0.55313
0.01058
0.00000
574
4
3
1
21
1
1.18484
0.07911
0.00000
0.01217
0.04839
575
7
3
2
23
3
1.63386
0.14647
0.13705
0.00211
0.02771
576
6
3
3
21
1
1.59191
0.18254
0.00000
0.01572
0.00000
577
5
2
3
21
1
1.24037
0.23419
0.00000
0.01198
0.00000
578
3
1
1
21
1
5.00611
0.28185
1.15811
0.00745
0.05620
579
4
3
3
23
2
0.71386
0.07637
0.40357
0.01084
0.00000
580
4
1
1
25
3
0.00000
0.00000
0.74563
0.00164
0.06064
581
4
2
3
24
2
0.00000
0.13003
0.32350
0.00958
0.00000
582
5
2
2
24
3
1.33704
0.17429
0.52629
0.00200
0.02565
583
5
2
1
24
2
0.00000
0.00000
0.14514
0.01019
0.05558
584
5
1
3
21
3
0.22874
0.18447
0.74464
0.00151
0.00000
585
5
3
1
21
2
0.07530
0.02782
0.07695
0.00551
0.05445
586
3
1
2
21
1
2.69800
0.29800
1.18397
0.00192
0.03187
587
3
3
2
24
1
0.64782
0.04665
0.46562
0.01400
0.01654
588
7
1
3
24
3
0.00000
0.00000
0.06642
0.00447
0.00000
589
3
2
3
25
3
0.88675
0.18023
0.95544
0.00000
0.01804
590
7
2
1
23
2
1.12452
0.11049
0.01551
0.00761
0.04892
591
4
3
1
22
1
1.01939
0.04945
0.02632
0.01237
0.04961
592
3
3
2
21
3
0.72175
0.13568
0.99914
0.00170
0.06046
593
7
1
2
25
3
1.57116
0.00000
0.00000
0.00500
0.01624
594
4
2
1
25
3
0.00000
0.00000
0.57165
0.00171
0.07223
595
3
2
1
24
3
1.32911
0.00000
1.41698
0.00000
0.09322
596
6
2
1
25
2
0.00000
0.01580
0.09415
0.01024
0.05437
597
5
2
3
25
2
0.02938
0.13432
0.15081
0.01132
0.00000
598
7
1
3
25
2
0.00000
0.00000
0.20392
0.00561
0.00000
599
7
1
1
25
3
2.23487
0.00000
0.00000
0.00742
0.03577
600
4
2
1
21
1
2.49066
0.20985
0.00000
0.01141
0.04518
601
3
2
2
24
2
0.00000
0.00000
1.39422
0.00011
0.04303
602
7
3
1
21
3
0.46174
0.11364
0.11191
0.00219
0.03445
603
3
1
1
22
1
4.33955
0.20302
1.12816
0.00789
0.05455
604
5
1
3
22
2
0.00000
0.13083
0.56136
0.00300
0.00000
605
4
3
1
21
2
0.00000
0.03994
0.05974
0.00595
0.05546
606
6
1
3
23
3
0.00000
0.01703
0.29262
0.00373
0.00000
607
6
3
2
21
3
3.93992
0.30103
0.01891
0.00313
0.01189
608
4
3
1
25
1
0.44374
0.01115
0.13119
0.01052
0.05461
609
5
3
1
22
1
0.25705
0.01875
0.08872
0.01173
0.05244
610
5
2
3
21
3
1.92789
0.33301
0.18209
0.00249
0.00265
611
4
3
1
23
3
0.00000
0.00000
0.15486
0.00426
0.06444
612
7
2
2
21
3
4.03250
0.25948
0.00000
0.00269
0.02599
613
3
1
1
24
3
1.60781
0.06680
1.70464
0.00000
0.07819
614
3
1
3
24
1
0.00000
0.01367
0.61766
0.01001
0.00000
615
6
2
1
25
1
0.00000
0.02236
0.09061
0.01128
0.05151
616
7
2
2
25
2
3.15767
0.23992
0.05539
0.00720
0.02425
617
6
2
2
24
3
2.77179
0.20795
0.09187
0.00435
0.02644
618
3
2
2
24
3
1.14014
0.10247
1.59011
0.00000
0.05956
619
6
1
1
24
1
2.90409
0.14669
0.00000
0.00598
0.02780
620
6
3
3
24
3
2.00092
0.25968
0.18450
0.00634
0.00000
621
5
3
2
25
2
0.40734
0.06838
0.21791
0.00755
0.02667
622
7
1
1
22
1
2.41337
0.14003
0.00000
0.00495
0.02057
623
3
2
1
23
2
0.00000
0.01722
0.70204
0.00645
0.06057
Table 14, continued
Inputs (controllable factors)
Outputs (response variables)
Scenario
Bed
Nurse
Doctor
Triage
Pharmacy
1
2
3
4
5
Efficiency
nurse
employee
624
5
2
1
24
3
0.28038
0.00000
0.14342
0.00399
0.06283
625
7
3
3
25
3
2.23646
0.22445
0.15172
0.00510
0.00640
626
5
2
2
24
2
2.45002
0.31826
0.08056
0.00618
0.00094
627
5
2
1
23
2
0.00000
0.04079
0.10192
0.01023
0.05242
628
7
3
1
24
1
0.00000
0.00000
0.10015
0.00839
0.05676
629
7
1
2
22
3
1.27840
0.00000
0.00000
0.00464
0.01162
630
4
1
2
23
1
1.03176
0.12258
0.23809
0.00716
0.01449
631
3
1
2
25
3
0.88085
0.16438
0.97460
0.00000
0.03255
632
7
2
2
23
2
3.25230
0.29809
0.00000
0.00622
0.02077
633
3
2
3
22
2
0.08437
0.36177
0.81071
0.00000
0.00000
634
7
1
2
22
2
0.60569
0.02232
0.00000
0.00592
0.00666
635
5
3
3
24
2
0.72399
0.09146
0.19348
0.01239
0.00000
636
6
3
2
25
2
2.12148
0.12543
0.14530
0.00670
0.02768
637
4
3
3
25
3
0.74302
0.12863
0.72145
0.00584
0.00086
638
7
3
2
22
3
2.25312
0.18195
0.11195
0.00224
0.02383
639
3
1
2
21
3
2.70332
0.26142
1.10497
0.00000
0.03474
640
6
1
2
22
3
1.32725
0.01921
0.00000
0.00451
0.01329
641
6
3
1
25
3
0.06010
0.02363
0.10427
0.00428
0.05571
642
5
3
2
25
3
0.00000
0.05247
0.32801
0.00210
0.02792
643
5
1
3
21
1
0.00000
0.10433
0.51289
0.00677
0.00000
644
7
1
2
22
1
0.77073
0.10024
0.00217
0.00556
0.00388
645
5
2
3
24
2
0.45199
0.17761
0.12952
0.01003
0.00000
646
7
1
1
25
1
2.66128
0.06782
0.00000
0.00224
0.03350
647
4
1
3
25
3
0.10524
0.04912
0.46598
0.00160
0.01582
648
5
1
1
22
3
3.93887
0.21700
0.00000
0.00499
0.04103
649
5
2
3
23
3
1.11161
0.24262
0.18522
0.00508
0.00000
650
6
2
2
25
3
1.13169
0.12393
0.16841
0.00395
0.03039
651
5
2
2
21
1
3.11707
0.33444
0.00000
0.00897
0.01683
652
5
2
1
22
2
0.50170
0.12022
0.02821
0.01002
0.04780
653
5
2
1
21
1
2.72657
0.22852
0.00000
0.01127
0.04277
654
3
1
2
25
2
0.00000
0.03097
1.14778
0.00000
0.03379
655
3
2
3
25
2
0.00000
0.01118
0.83222
0.00842
0.00000
656
7
2
1
21
1
2.66880
0.28533
0.00000
0.00882
0.03106
657
5
2
3
24
3
0.82530
0.20426
0.21160
0.00570
0.00000
658
7
1
3
22
2
0.13710
0.01252
0.00000
0.00517
0.00236
659
5
2
2
25
3
0.00000
0.07518
0.67305
0.00149
0.03131
660
7
1
1
22
2
2.65355
0.00000
0.00000
0.00739
0.02867
661
7
2
2
21
2
3.06164
0.30958
0.00000
0.00541
0.01962
662
5
1
1
21
1
3.10530
0.25354
0.00000
0.00991
0.03287
663
3
3
2
22
2
0.00000
0.06064
0.42278
0.00734
0.03494
664
7
1
2
24
3
1.51268
0.00000
0.00000
0.00472
0.01420
665
5
1
3
24
3
0.00000
0.00236
0.51891
0.00222
0.00697
666
6
2
3
21
2
2.38610
0.29737
0.00000
0.00504
0.00689
667
5
1
1
21
3
4.09809
0.25034
0.00000
0.00535
0.04015
668
4
1
3
25
2
0.00000
0.02300
0.46543
0.00446
0.00126
669
5
1
1
24
3
2.18947
0.01586
0.03341
0.00445
0.04687
670
3
3
1
21
2
0.00000
0.07965
0.20315
0.00495
0.05944
671
4
2
3
25
2
0.00000
0.07730
0.37794
0.01065
0.00000
672
5
2
2
22
1
2.99393
0.31721
0.00000
0.00954
0.01339
673
5
2
1
25
2
0.00000
0.00000
0.17237
0.01019
0.05735
674
6
1
2
22
2
0.82059
0.03979
0.00000
0.00540
0.00847
675
6
1
2
23
2
0.83194
0.01734
0.00000
0.00537
0.00865