
Abstract
Healthcare is an essential part of people’s lives, particularly for the elderly population, and also should be economical. Medicare is one particular healthcare plan. Claims fraud is a significant contributor to increased healthcare expenses, though the effect of it could be lessened by fraud detection. In this paper, an analysis of various machine learning techniques was done to identify Medicare fraud. The isolated forest an unsupervised machine learning algorithm which improves overall performance while detecting fraud based upon outliers. The goal of this specific paper is generally to show probable dishonest providers on the ground of their allegations. Obtained results were found more promising compared to existing techniques. Around 98.76% accuracy is obtained using an isolated forest algorithm.
Introduction
Government departments, companies, several businesses, or present day have embraced electric transactions to boost their convenience or profitability for the selling of services or goods; of fields including charge card, banking, health insurance, automobile insurance, online auctions, etc. [1]. Table 1 list the quantity of IC3 reports received from 2011 to 2014 the ensuring dollar losses. It can be observed that the volume of harm is continuously increasing, even though the number of issues is actually declining; this is because fraud is actually leading to far more destroys than in the past [2].
The fraud detection is one of Medicare’s most serious problems. The government claims that overall Medicare costs have significantly inflated related to Medicare abuse allegations. Health fraud is a structured offense including peers of providers, doctors and beneficiaries who work collectively in order to produce fraudulent claims. Careful review of data from Medicaid has proven fraud for many physicians. They use methods where the most expensive treatments and medicines are used through an undefined diagnosis code. The most prominent organizations impacted by such unethical practices are insurance companies [24, 25, 26]. As a result, medical providers continue raising their policy rates and health coverage is getting costly day-by-day. The aim of this paper is to show likely dishonest providers on the grounds of their allegations. In addition, substantial parameters helpful in identifying the activities of alleged providers of fraud are also discussed. In this paper, we propose an unsupervised machine learning approach for Medicare fraud detection utilizing publicly accessible claims labels and data for known fraudulent health-related providers across almost all medical providers or specialties types (e.g., cardiology or dermatology) [27, 28, 29, 30, 31]. The fraud and abuse of healthcare take several ways. Many of the most common forms of provider’s fraud are:
Internet crime IC3 report
Internet crime IC3 report
They produce fake bills for services which are not even provided to the customer. They submit duplicate claims for the same individual service. Wrongly presenting the services provided to the patients. To cast more money for facilities which are more challenging or expensive than currently offered. Claiming for those covered services where in practicality provider has not covered.
The main contributions of our study are as follows:
Outlier analysis was performed for detecting the fraud occurred in health care systems. Isolation Forest, K Means and Local Outlier Factor algorithms were used for fraud detection on the dataset. For Comparative analysis five performance metrics were used.
The remaining paper is ordered as follows as Section 2 provides an explanation literature survey. Section 3 focuses on dataset description and the workflow of the implementation technique. Section 4 depicts the results obtained from the proposed model. Section 5 delivers the conclusion and future scope.
With the small quantity of readily available, documented Medicare fraud cases and also the reasonably recent availability of information, a great deal of the current Medicare fraud detection research using machine learning approaches has been discussed below.
Johnson and Nagarur [3] says that a brand new multistage method for insurance companies to identify fraud perpetrated by clients and suppliers. Step four then includes the info received in the preceding 3 steps to the complete risk assessment. Subsequently, the Stage five choice tree based strategy measures the danger threshold values. They applied the method to 4 different specialties, as well as discovering that the methodology worked pretty well for those of them with an entire accuracy rate of 86%. Semi-supervised as well as non supervised neural community techniques.
Nsiah-Boateng et al. [4] focused on the write examined insurance compensation details from the NHIS to assess the valuation of the advantages bundle to the sensitivity and furthermore, the client of the device to the monetary needs of health service providers. They show the item of a total of 644,663 health-related statements costing Ghana cedi (GHS) 11,8 million (US$3,1 million) have been registered with the study period. The cost ratio of promises to donations received rose from 4.3 to 7.2 with the period 2011 2013 to 5.0 in 2014. The proportion of instances resolved following 90 days has improved. The study reveals a much better than expected allocation ratio of claimants, indicating the much better really worth of the NHIS advantage plan to members.
Bauder et al. [5] focused on specific place is actually the exploitation of healthcare insurance plans, including Medicare. With this particular post, we are creating a machine learning layout to identify when physicians certainly show an anomaly in the healthcare insurance statements of theirs. This particular type of results suggests it is feasible to successfully make use of machine learning in a novel way to identify doctors in their respective fields exclusively by using the remedies they bill for. This specific attempt offers a device that could classify doctors who have possibly misused Insurance schemes for even more reviews.
Bauder et al. [6] discussed a comparative analysis of controlled, unsupervised, and hybrid printer mastering methods using four performance metrics in addition to category disparity reduction utilizing oversampling and an eighty twenty under sample procedure. The results show this helpful identification of dishonest vendors is really achievable, with the eighty twenty sampling method demonizing the really best overall performance concerning learners. The launch of new Medicare samples, excluding certain LEIE Sion codes, as well as the use of various sampling methods for class imbalances will be suggested for later studies.
Abdallah et al. [7] a survey on the aim as well as fraud detection of this specific survey pa- per is really offering a systematic and detailed analysis of the issues in addition to issues that impede the excellent results of FDSs. This specific analysis article looked at state-of-the-art fraud detection mechanisms in five fields of fraud. Additionally, the tactics, and also techniques for identifying fraud, have been classified also as examined.
Fursov et al. [8] focused on that Proposed text embedding architectures through truly serious learning that assist to improve the identification of fraudulent claims compared to other machine learning strategies. They typically use a data set out of a huge international health insurance company to exhibit the methods of ours. Empirical results demonstrate that our choice outperforms many other state-of-the-art approaches and might help to create the claims management procedure a great deal much more efficiently.
Farbmacher et al. [9] concentrated on Fraud Detection in Claims Management. The very best objective is, in fact, a statistical model for the detection of fraudulent claims as well as the automatic transaction of non fraudulent statements. Health care claims, nevertheless, have an unusual info system, that’s bureaucratic and complex in range. Utilizing a sample of two million statements made by a private health insurer for Germany, they prove that the suggested models of ours outperform designs based on bag-of-words, hand-designed characteristics, and designs based on co-evolutionary neural networks. Claims administration is really a preferred way for these solutions outside of natural language processing or perhaps picture analysis which has obvious as well as quantifiable economic worth.
Kruthika and Manjunatha [10] focused that These frauds pose a threat to human dignity, resulting in financial losses. This work focuses on the link-based detection of fraud cases. Initially, the credit card fraud dataset is downloaded from Kaggle and the sorting strategies are used to pick the relevant variables from the data set. The efficiency of this classifier shall be determined using statistical parameters and cross-validation techniques. Results revealed that the SMOTE Deep algorithm obtained better fraud detection efficiency at an accuracy of 96.4 per cent. Based on these observations, the analysis of linkages has been shown to be significant in exploring the dynamics of the fraud network.
Resa et al. [11] focused on research use an electronic survey-based quantitative tool. The sample of this analysis was Indonesian civil servants. 197 respondents were chosen by random sampling and evaluated by inferential statistics. Preliminary findings – The results of this study showed that the majority of respondents (81.76 per cent) believed that fraud was the main problem in the Indonesian department and that fraud perception was strong (more than 65 per cent). This re- search leads to a more detailed understanding of the importance of legal sensitivities, internal audit and program analysis principles.
David et al. [12] described Automated rules management system for fraud detection. An integrated rules management system that evaluates the input of individual rules and optimizes the collection of active rules by means of a heuristic search and user-defined loss feature. Results show that only a minority of the original rules (50 per cent in one instance, and 20 per cent in the other) are capable of maintaining the efficiency of the original frameworks (e.g. recall or false-positive rate). In the future, they are also preparing to add a framework to match the principles and threshold for machine learning models at the same time.
Song et al. [13] proposed a novel data-driven approach to the formulation of predictive types for the detection of bulk cargo theft in ports. More exactly, many user class approaches as well as classification algorithms are actually used to choose the ideal characteristic set of relevant threat components. Subsequently, the implied Bayesian networks obtain the functions of graphically exhibiting the partnership with the risk components by fraud. Experimental results indicate which predictive airers are actually helpful, with accuracy as well as recall values greater than 0.8. Such predictive models aren’t merely helpful for understanding the dependency of relevant risk factors, but additionally for advertising policy SEO in risk control.
Lucas et al. [14] discussed Machine learning and data mining methods have been used widely to diagnose credit card fraud. In this study, they suggest an HMM based function development strategy that helps us to integrate sequential information into transactions in the form of HMM-based apps. These HMM-based features allow the non-sequential classification classifier (Random Forest) to use sequential classification details. They model the real and dishonest conduct of merchants and cardholders according to two characteristics: timing and quantity of transactions.
Janbandhu et al. [15] states that this paper contains some hybrid analysis for data level and algorithm level treatment of class imbalances, which is being tested on European credit card transactions over a span of two days. The findings are related to the three major algorithms with high performance fraud detection tasks: (a) linear support vector machine, random forest, and K-NN. As a consequence, the findings have shown that advanced generative sampling approaches will be short-lived in generalizing the minority community in the face of severe social imbalances.
Tang et al. [16] discussed holding out a comprehensive review of the different kinds of optimization methods for the generality as well as performance improvement of Spark. We’re introducing Spark’s programming style as well as the computing process, talking about the advantages and disadvantages of Spark, as well as investigating different fixes methods in the literature. In turn, we often implement different data compilation as well as analysis technologies, machine learning algorithms, as well as frameworks run by Spark. Last but not least, we’re engaged in a discussion on problems that are open as well as obstacles for Spark.
Oosterlinck et al. [17] focused on a method that strengthens present techniques by establishing semi-synthetic novelties to be able to get the information labeled for each group. The strategy was used in a real-life test situation in which the goal was identifying illegal members to a family phone program. This particular analysis shows that the two-class specialist item outperforms the one class semi-synthetic sample version. The unit was tested on a certain dataset in the following stage.
Padhi et al. [18] discussed Machine learning methodologies have proven to be the most effective approach for anonymous transactions. This paper analyzes the basic machine learning algorithms that include SVM, LDA, QDA, DT, and RF for fraud detection. At the same time, some of the latest open-source boosting machine learning algorithms, including XGBoost, LGBoost, and CatBoost, are also introduced.
Liu et al. [19] focused on model the behavioral sequences as- signed to consecutive actions to identify sequential trends, while those that deviate from norms can be identified as fraud. In order to validate the usefulness of serial behavioral embeddings, we are working with a real-world telecommunications dataset of estimation and recognition activities de- pendent on experienced embeddings. Experimental results show that learned embeddings are better able to identify fraudulent behavior.
Kundu et al. [20] states that integrate both trend identification as well as abuse detection methods. With this post, they intend to make use of a two-stage matching technique in which the Profile Analyzer (PA) initially evaluates the resemblance of the new summary of purchases on the charge card to the actual cardholder’s earlier spending sequences. They recommended one algorithm called BLAH and used it for the identification of charge card fraud. The system known as BLAHFDS detects fraudulent transactions with a Profile Analyzer as well as a Variance Analyzer.
Dal Pozzolo et al. [21] prepare & test a brand new learning method that correctly repairs category disparity, concept drift, as well as latency testing. Next, in the studies of theirs, they clearly show the impact of social inequality as well as paradigm drift on a data stream of over seventy-five million transactions in real life.
Phua et al. [22] discussed a contemporary multilayer detection process complemented by 2 extra layers: collective detection (Spike detection and cd) (SD). CD thinks genuine community interactions to rising the score of skepticism and it is responsive to digital community associations. Research results help support the hypothesis that useful recognition program fraud rates are actually abrupt and cause sharp spikes in duplicates. Even though this effort is different from the identification of credit program fraud, the concept of adaptation, combined with the adaptivity as well as consistency information explored in the post, is actually typical in the design, deployment, and assessment of all detection methods.
Omair and Alturki [23] introduced a full RNN architecture to play with explicitly modifying the GRU design to take into account the unpredictable time intervals between transactions. So, instead of introducing it as a function to the software, in the expectation that the model would learn how to view it correctly, they should exploit this knowledge and explicitly insert it in a process that updates the recurrent states.
Concerning the last few preliminary studies, which also use Medicare data with fraud labels, our research is more comprehensive in the breadth and depth of experimentation and results. A comprehensive discussion of the data and the mapping of the fraud labels is provided in this paper. Three different un-supervised algorithm were imlemented on four different class distributions to assess the effects of class imbalance. Finally, results were present using several different metrics and discuss the statistical significance of the results.
Methodology
Dataset description
Dataset consists of Inpatient claims, Outpatient claims, and beneficiary information from each provider, which are explained below [32].
Impatient data: This report offers data on the cases related individuals admitted to hospitals. Further information such as admission and release dates are given as well as the code of diagnosis. Outpatient data: This report includes clear details about the expenses for all patients who visit and are not admitted to hospitals. Beneficiary details data: This data contains details from beneficiaries of the KYC, such as health issues, their region, etc.
Column plot of first 5 features.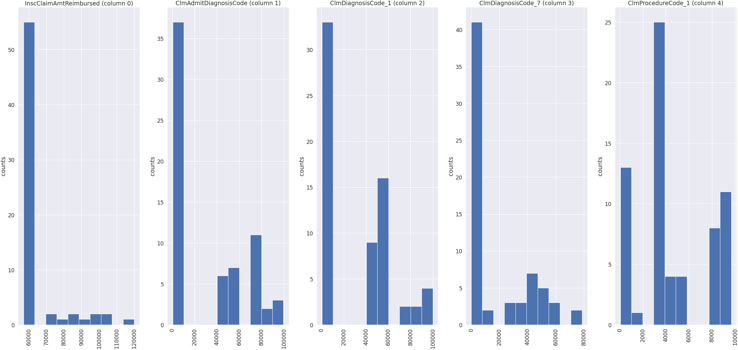
When the dataset is labeled, supervised learning algorithms for distinguishing regular from outlier observations can be used. But in case of fraud, labeled class depict the situation in which we already know two classes of examples, i.e., we have specified which records are not fraud and which are fraudulent. Such situations are infrequent. On the other hand, when we don’t know about the labeling of the dataset, which means there is no information about who has committed the fraud or not, unsupervised methods of outlier detection can be used. Figure 1 depicts the features distribution of first five features from the training dataset.
In this subsection, unsupervised algorithms used in the implementation process are discussed. Three different unsupervised methods: IF, K-Means, and LOF are used in the work. The key issue with this unsupervised model is that a subjective threshold needs to be determined. Limited knowledge regarding fraud cases are available, but still appropriate threshold was selected for a fraudulent event. Hence, when a forest of random trees collectively produce shorter path lengths for particular samples, they are highly likely to be anomalies. Isolated forest senses irregularities by splitting the domain space arbitrarily. Mainly, it functions like a Decision Tree Algorithm, where we start with a root node and proceed to partition the space. Just as with decision trees, where partition is centered on knowledge gain, we arbitrarily partition in isolation forest. Partitions are generated by choosing a feature randomly and then creating a branch function between the highest and lowest value feature arbitrarily. Further preceding of build the partitions is conducted until all points are isolated. In visualizing feature points in the available feature space, it was found that standard points tend to cluster more while anomaly points are far apart from each other. Hence on partitioning, the domain space anomaly will be found in fewer number partitions than a standard point. Forest isolation is an ensemble method. Many isolation trees (usually 100 trees are adequate) were built and the average of all the path lengths was taken. Finally, it was determine that whether or not a point is odd.
Figure 2 depicts the correlation matrix of the training datasets resembling 13 features. By selecting a function and randomly partitioning it an isolated tree can be created. Kmeans Algorithm is an iterative technique that attempts to segment the dataset into unique non-overlapping subgroups (bunches) where every point belongs to only one cluster. The less variety we have inside cluster, the more homogeneous (comparative) the points are inside a similar group. Working flow of the proposed methodology is demonstrated in Fig. 3.
Correlation matrix of training dataset.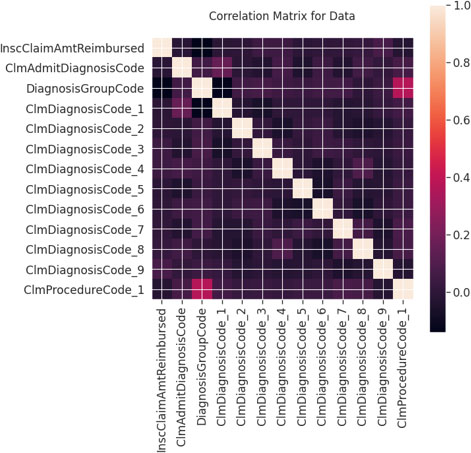
The following equation contains anomaly value:-
where
Proposed methodology flowchart.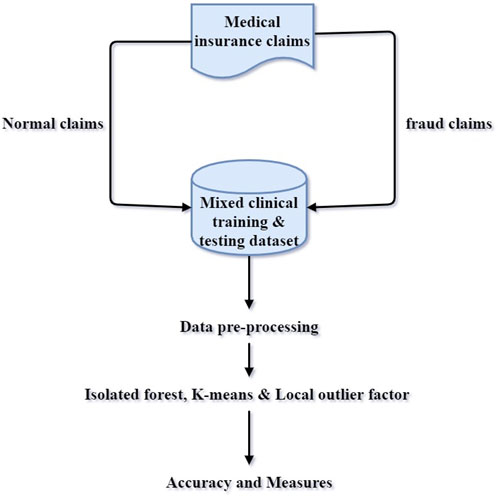
Anomaly prediction and outlier detection
Start.
End.
KwRetreturn
Isolated forest
a set of
Set height limit 1
Forest
Forest
an iTree
exNode
let
Randomly select an attributes
Randomly select a split point
Values of attributes
Node Left
x – aninstance, T – an iTree, e – current path length to be initialized to 0
Path length of x
T is an external node
return e + c(T.size)
a
PathLength(x.T.left, e+1)
PathLength(x.T.right, e+1)
Dataset description
Performance metrics obtained after applying isolated forest
Performance metrics obtained after applying k-means
Performance metrics obtained after applying local outlier factor
K-means
Initialise cluster centroide
Repeat until convergence: {
for every
For each
}
Local outlier factor (LOF)
LOF: Predicted outliers;
kDistannce(
reachabilityDist(
LOF
each point pt
KNN
Lrd
each
Lofhold
Lof
LOF
The unsupervised algorithm was applied to the input patient’s dataset. In this work, isolated forest, K-means, Local outlier algorithms were used for detection. Initially these algorithms were applied on the dataset having no outliers (after preprocessing and removing records of assumed fraud providers having high deductible claim amounts) and then training the model with the same dataset. In another case, focus was given on the assumed sample and again the same algorithms were applied and further testing was performed. The results are then compared using five evaluation metrics, i.e. Accuracy, roc_auc, f1_score, Cohen’s Kappa, Average_Precision. Results show that in case of accuracy, the isolation forest algorithm performs well. Overall it is observed that isolated forest has given better results compared to other algorithms.
The system configuration used for experimenting was the Intel Core i3 processor, Windows 7 Ultimate 64-bit operating system, and 6 GB of RAM. The tool used was Jupiter Notebook. Table 2 depicts the dataset distribution along with its sample instances for both training and testing datasets. Figures 4–6 represents the confusion matrix obtained after applying Isolated Forest, K-means, and Local Outlier Factor, respectively. Five metrics were used to calculate the efficiency of the proposed approach. Tables 3–5 shows the performance metrics obtained after applying Isolated Forest, K-means, and Local Outlier Factor respectively.
Confusion matrix using isolated forest.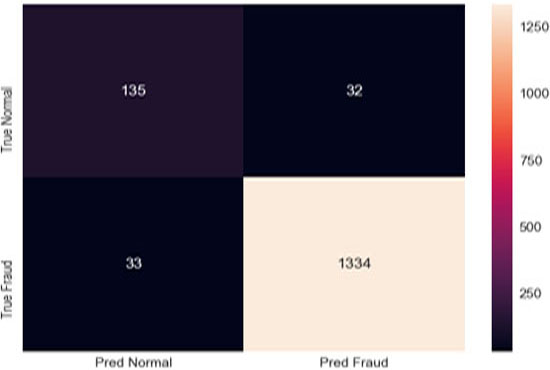
Confusion matrix using k-mean algorithm.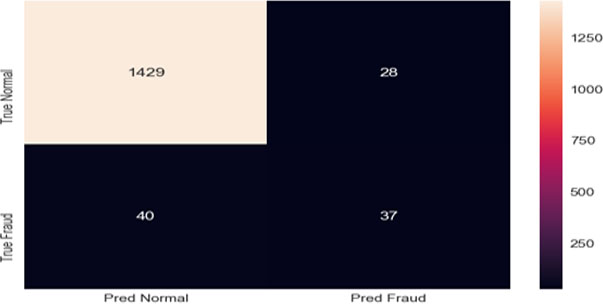
Confusion matrix using local outlier factor.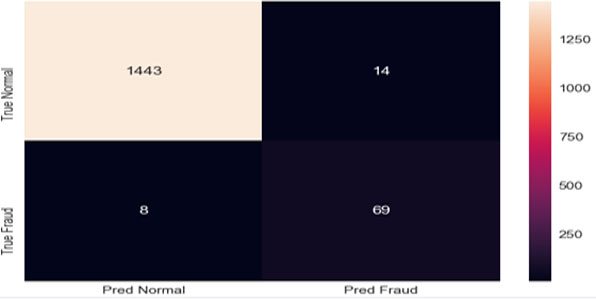
Distribution of normal popuation.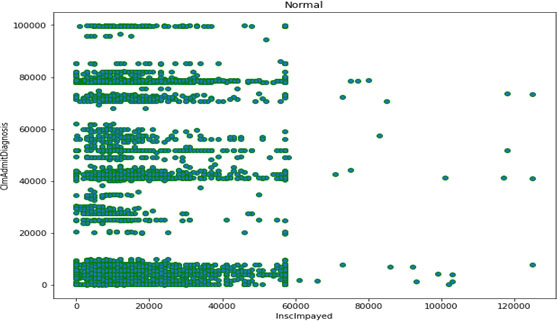
Distribution of outliers.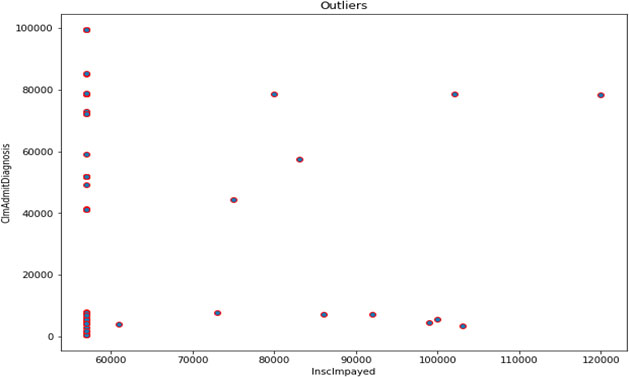
Sample population of beneficiary details dataset plot.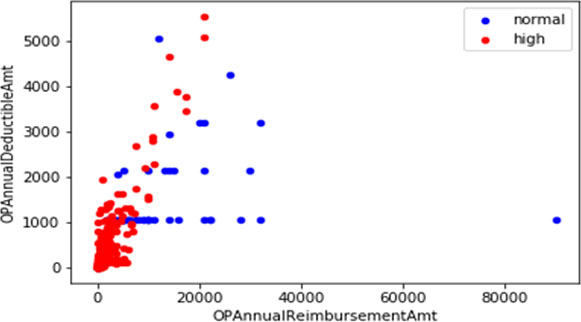
Represent the population using a normal v/s anomaly plot after implementing the isolated forest unsupervised algorithm.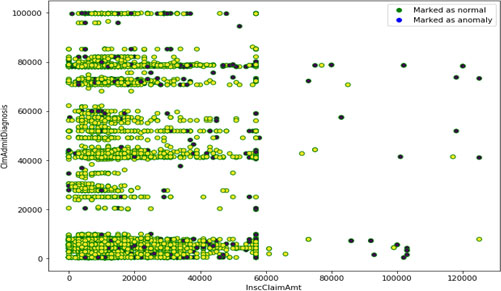
Normal v/s anomaly plot on testing dataset.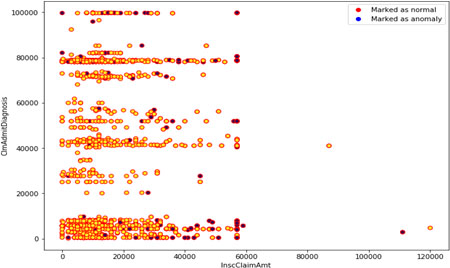
Accuracy comparison.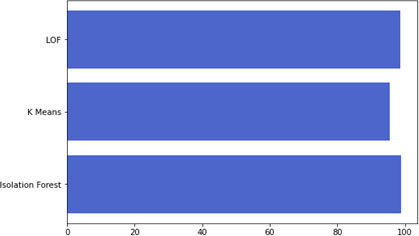
AUC scores comparison.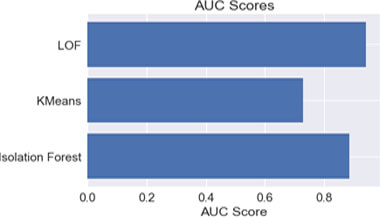
F1 score comparison.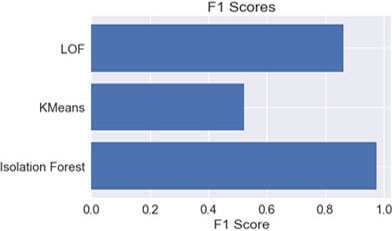
Cohen’s Kappa score comparison.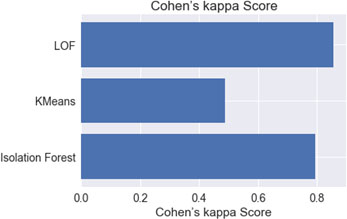
Average precision score comparison.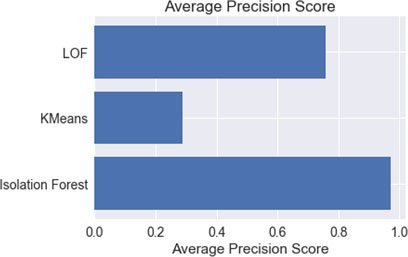
ROC curve using isolated forest.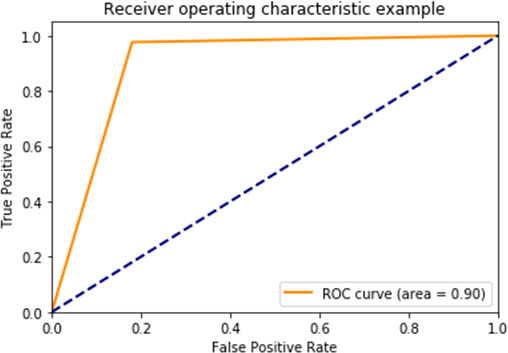
Distribution of training sample is depicted in Figs 7 and 8. Represents the outliers available in the training dataset. Figure 7 consists of scatter plot of health insurance patients who have claim the amount in the year of in the year of 2012–14 as given in the dataset. The plot shows the distribution of insurance claim given to claims of admitted patients under diagnosis. Clearly plot is denser in initial region showing normal patients claim and with some outliers having higher pay of claims. Figure 8 consists of plot representing potential outliers having higher insurance claim amount. Sample population of beneficiary details in dataset was plotted in Fig. 9. Plot shows the randomly distribution of data and the normal claims with suspects of fraudulent claims. The following plot is plotted with the help of target class Renal Disease Indicator. Blue dots are showing patients not having disease and redone are those which are positive. It is only to indicate patients having deductible amounts high and are not positive with disease may be case of fraud. Figure 10 represent the population using after implementing the isolated forest unsupervised algorithm on training the mixture. Training the algorithm with the following data set will give the predicted outliers in multi-class problem which then be used for calculating accuracy with the prediction from normal patient’s outliers. Blue dots as legend says are marked as anomaly and green dots are normal ones.
ROC curve using k-means.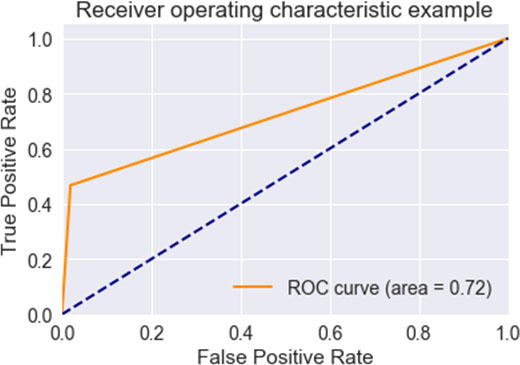
ROC curve using LOF.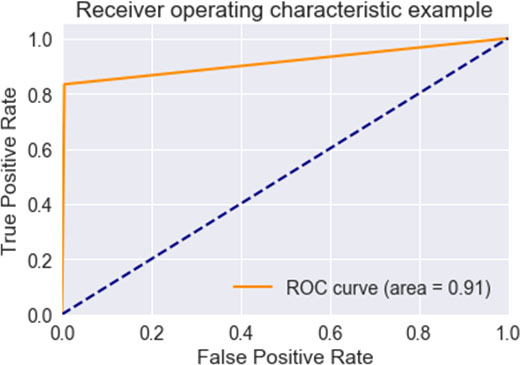
Figure 11 shows then plot the normal v/s anomaly plot on the testing dataset to show the efficiently algorithm work. The following plot shows testing estimates of the isolated forest algorithm, and the red dots are predicted normal patients and red dots are predicted fraudulent once. Clearly, blue dots are in small in quantity which shows algorithm is working efficiently. Comparative analysis of all the 3 algorithms was done based upon Accuracy, AUC Score and F1-Score, Cohen’s Kappa, Average Precision in the Figs 12–16 respectively. ROC Curve of all the three algorithms were plotted in Figs 17–19 respectively.
Medical healthcare is very crucial for our society, but lot of fraud cases take place in this field. Existing algorithms which can identify these fraud cases need to be modified for enhancing the results so that the equal and deserving patients can utilize the health care benefits. The proposed system tries to identify the outliers available in the dataset using three different algorithms. Among all of the implemented algorithms, Isolated Forest has given the most promising results. In Future, various hybrid or ensemble algorithms can be applied for improving the accuracy.