
Abstract
Kinship Verification from facial images is known to have attracted major attention since time immemorial. Identifying the underlying patterns that exist between images and analysing the relationship hidden between them have enabled the multitudes of applications to utilize kinship relationships. This work serves as a study on the amount of influence that hereditary features can exert on the families tied together by lineage in identifying the relationship prevailing between them and whether it holds true or not. The approach employed involves detecting the relationship existing between the provided facial images using Siamese Network, which comprises two identical convolutional neural networks that share common weight values. A difference vector is computed from this Siamese CNN, which is then fed into a network of fully connected linear layers. This extended layer will determine whether the two individuals in the input images are related to each other or not.
Keywords

Introduction
The term Kinship can easily be traced way back centuries ago when facial traits aided people to distinguish between various families. Kinship truly acts as the universal form of human existence on the ties of blood and marriage. Several kinds of kinship exist between people wherein the consanguineal, also known as blood relations, holds the primary importance [9]. Affine relationships that are based on marriage do not necessarily act as a rudimentary factor in deciding one’s lineage. Major studies and researches have indicated that facial characteristics as well as gestures, serve as an integral key and criteria for classifying people belonging to certain families. In this Research predominantly focus is on the assertion of the former to make the relationship prediction process probable. If the relationship tying a family can be successfully predicted based on the provided images, it can further be utilized in several other prospects as described next. The traditional methods adopted by the law to search and find missing people [13] consume a large amount of time and effort considerably and ends up yielding poor outcomes. In addition to that, it is a tedious task to search for the ones who are related to you on any social media platform [11]. These two applications can make use of such a model to obtain fruitful and accurate results. The model curated in this approach deals with discerning the relationship that exists between 2 people vividly based on the images which are provided or in a nutshell predicting if two persons are belonging to the same family or not. These images are passed onto the Siamese network which produces a feature vector whose difference is computed and further used for classificationn [9]. Multiple works are related to what is presented here. The major difference is in the feature extraction techniques that are deployed here along with the scenario in which the Siamese network is used. Some of the main contributions of this research can be summarized as follows: A deep siamese network is proposed for kinship discernment. Calculating the element-wise difference for values in the feature vector of two images, which is then fed as an input to the extended CNN for classification.
Related work
In [1] major applications with regard to computer vision, which includes multi-view 3D reconstruction, retrieval of images, structure-from-motion (SFM), and image-based localization, finding out matching images across numerous datasets plays a vital role. This technique aims to find matching and non-matching pairs of images by representing them using neural network-based feature vectors wherein the similarity is computed using Euclidean distance. From the labelled instances of matching and non-matching image pairs which are obtained by the use of a contrastive loss function in a Siamese Architecture, the feature vectors are learnt. The experimental outcomes portray that the proposed features enhance the performance in comparison with baseline features produced with networks trained for the purpose of image classification tasks. The results are promising, taking into consideration image retrieval applications. In [2], Traditional kinship verification techniques containing discriminative features such as pitch are faced with a multitude of problems, namely concentrating on local region data comprising of a lot of noisy in other regions excluding the face, redundant information in overlapping regions. To eradicate these issues, a novel kinship verification method was devised based on nonlinear feature mapping and deep transfer learning. A new deep learning model that is trained on the face recognition dataset is transferred to kinship datasets wherein high-level features are extracted. The combination of triangular similarity metric learning and Siamese Multi-Layer Perceptron reduces the dimensionality of a feature vector and at the same time creates a larger distance between non-kin pairs and shorter distance within the kin pairs. In the end, the cosine similarity is calculated for each feature vector pairs, and classifiers such as Support Vector Machine can be used. In [3], due to the recent explosion of information on various platforms but prominently on social media, there is an urgent requirement to manage and organize images of people instantly. A solution is proposed by exploiting the relationship of people in the images by constructing two databases where the first one is UB KinFace Ver2.0 comprising of images of children, their young parents, and their old parents and the second database is named FamilyFace. To decrease the major differences in the distribution of appearance between the old parents and children facial images, the transfer subspace learning-based algorithm is developed. In addition to that, an algorithm is proposed which explores the semantic relevance of the corresponding metadata to predict the kin relationship concealed in an image. Human subjects are made use of in a baseline study. Experimental outcomes have proved that the proposed solution can efficiently annotate the kin relationships within people and semantic context can enhance the precision to a larger extent. In [4], karyotyping is the process of ordering and pairing 66 chromosomes from various images of cells depending upon facts such as size, centromere position, and banding pattern. Since the technique of karyotyping requires knowledge in the domain, experience and a large amount of manual effort to diagnose various diseases, automation is highly desirable to aid the assistants. It lessens the cognitive load required for the entire process. Based on the concepts in deep learning, this method aims to provide chromosome classifications wherein chromosomes are straightened and then fed into the Siamese networks to push the embeddings of samples emerging from labels closer. Balanced sampling is performed from the pairwise dataset and at the same time choosing different training pairs for Siamese Network and an MLP based prediction on the embeddings generated from the trained Siamese Networks. In [5], a new approach was proposed, namely DeepTensor
Methodology
Dataset description and instance generation
The dataset is collected from Kaggle, Families In the Wild (FIW) dataset issued by Northeastern SMILE Labs [22]. It comprises of images of people from 470 different families, with multiple images of each individual in the family. But not every member of the family shares a kin relation. For example, a mother and father are kin to their children, but not to each other since they hail from two different families. So, a comma-separated value file is given along with the dataset that describes people who share a kin relation. The CSV file has around 3350 rows, which means that there are those many pairs who share a kin relationship. The images in the dataset are of varying size, a clear image of the face of the individual. All the images are in RGB format with varying brightness and lightings. The CSV file provided with the dataset describes the instances of people who share a kin relationship. Although it has images of people belonging to different families, it is not explicitly mentioned anywhere. Hence, we generate instances for people who do not share a kin relation by picking individuals belonging to different families. Since we have 470 different families and an average of 4 individuals per family, it is possible to generate a large number of samples. But to maintain the balanced state of the dataset, we restrict our instance generation to 3350 samples. The generated instances are appended at the end of the CSV file obtained from Kaggle.
Dataset example [22].
All the data obtained from Northeastern SMILE Lab are not in the same state. In short, they differ from each other with regard to their size and other features. The directories which do not contain any images are removed from the dataset. Each image is been reshaped to a file dimension of 224x224 pixels without changing its depth from 3. The dataset is well shuffled to have an unbiased learning. A label of one is assigned to the image pairs that share a kin relation and label of zero otherwise. The overall dataset is been split into training and validation sets with 80 percentage of the data allocated for training and remaining 20 percentage for validation.
CNN Architecture.
For any deep learning algorithm to learn, it is better to have more training instances as possible i.e. those who share a similarity and those who do not. Since the focus is on solving the complex problem the amount of quantity of training images available was not sufficient. To alleviate this problem, more input samples were generated from the available images. This process is called data augmentation. New samples are generated by altering multiple properties of the available images.
Here first we resized the images into 255x255 pixels by appending at the outer part of the image pixel matrix. Also the image is cropped at the center into 224x224 pixels. Then it is flipped horizontally with probability 0.5. At the end, it is also normalized with both mean and standard deviation of 0.5 for each channel of the input tensor.
CNN architecture
Convolutional Neural Network is a popular deep learning algorithm used for extracting important features from the images. In this approach, the CNN algorithm is used to extract important features such as the diameter of eyes [23, 24, 25], the distance between ears and eyes, length of the nose, etc., from the images of individuals’ faces. The proposed CNN consists of two ConvBlock1 and three ConvBlock2 with three fully connected layers at the ends, as shown in Figs 2 and 3. A single ConvBlock1 comprises of two convolutional layers with a kernel size of 3x3 and 1x1 striding. The padding of 1x1 is used along with these layers.
In the end, we have a maximum pooling layer of dimension 2x2 which is defined as
Where
The diagram in 4 shows the architecture of the Convolutional Neural Network. The input to the network is the face images in RGB mode with a fixed dimension of 224x224 pixels. This input is given to a ConvBlock1, which is then passed through another ConvBlock1 and three ConvBlock2. This helps in extracting the features and reducing the dimensionality of the feature maps. Three fully connected layers are with two having 4096 active units and one with 2622 units at the end. ReLu activation is used throughout the network, which has proven to yield better end results. With ReLu convolution operation is computed as
In Eq. (2) where
Twin architecture of siamese model.
Extended siamese for classification.
The CNN architecture explained in the previous section can extract features from a single image. But it cannot perform complex image comparison tasks. To compare two images, we use the twin architecture of the CNN model. This architecture is shown in 5. The diagram in 4 shows the architecture of the Convolutional Neural Network. The input to the network is the face images in RGB mode with a fixed dimension of 224x224 pixels. This input is given to a ConvBlock1, which is then passed through another ConvBlock1 and three The two CNN models are the exact replica of the CNN model architecture shown in Fig. 4. The input image pair will be passed through the twin CNN models. In the end, a feature map with 2622 features for both the images will be obtained since it had those many active units in the final fully connected layer. The similarity score is computed using these feature maps. It is nothing but the absolute difference between the two feature maps. Suppose if
This absolute feature difference is used to tune the parameters of the Siamese network. For the pair of images that is representing a kin relation, the difference is being reduced, and increase this parameter for those who are not unrelated. This will basically set a threshold value boundary for difference, below which it’s been stated that they are related. If the difference is outside the boundary, it is concluded that they are not related. By performing the operation of weight update on different image samples a certain number of times, the model weight values will be adjusted to rightfully classify the samples. One important characteristic of the Siamese network is that both the CNN model in the twin architecture will share the same weight values.
A twin CNN model is instantiated for finding the feature difference between two images, which basically yields us the absolute feature difference. Here Siamese model has been extended for classification. This is shown in Fig. 6.
Training loss curve.
Validation loss curve.
The extended layer consists of five fully connected layers. In the first four layers, the dimension is reduced by half at every layer starting from 1024 active units in the first layer. The final fully connected layer consists of only two active states that determine the class to which it belongs by providing a probability distribution over the two classes. The one with the maximum probability is considered as the output class. The input to this extended model is a similarity tensor computed from the image feature vectors.
In this equation,
RoC curve.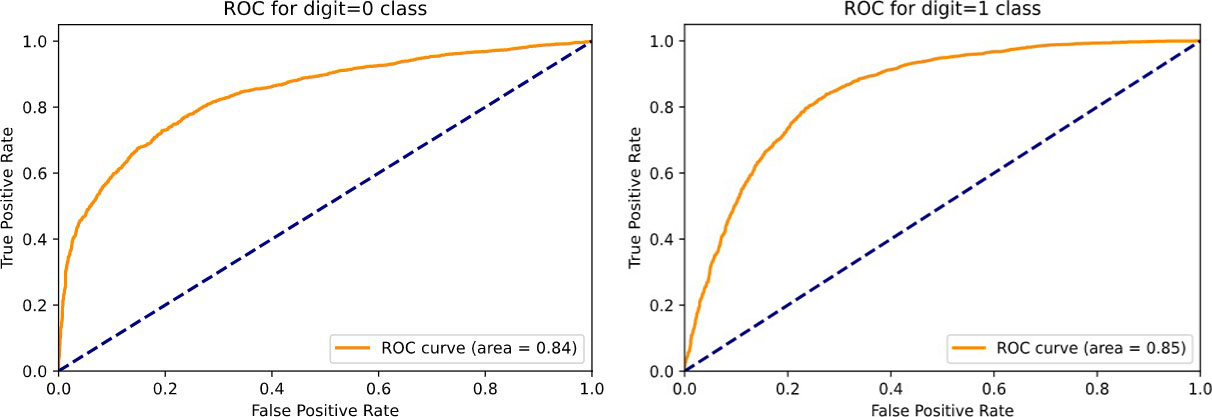
The Siamese model is trained using the pre-processed training data. Iterating through the dataset considering one image pair at a time, pass the images through the Siamese architecture and obtain the feature maps. Further, compute the similarity vector from the obtained features. Then pass the obtained similarity vector through the extended Siamese network for classification. This will predict the output class to which it belongs. If it is the right class, go for the next sample in the dataset. If not, calculate the loss function and update the weight values to reduce the overall loss of the system. Here Binary Cross-Entropy Loss function has been used since two output classes are there. This loss function is given by,
where
In continuation to algorithm, As deep Siamese architecture do not use a classification loss function instead of that uses contrastive function it described in Eq. (3.7) and data acquisition [1, 2, 3]. The description of the course of research should be supported references, so theexplanation can be accepted scientifically [2, 4].
From the experiment, the overall accuracy of the trained model on the training data and validation data has been computed. The results proved that the model is 72 percent accurate on the training data and 65 percent accurate on the validation data. The confusion matrix for the training set and validation set are given in Tables 1 and 2, respectively.
Confusion matrix for training
Confusion matrix for training
Confusion matrix for validation
The loss curve of training and validation overtraining is shown in Tables 1 and 2, respectively. From the curve, it is inferred that the training loss is decreasing over time, whereas validation loss is varying largely from the mean throughout.
Here we plot ROC curve for both the class and its corresponding AUC metrics is displayed.
For People who don’t share any kin relation class – ROC curve.
The above diagram shows the ROC curve for class containing image of people who do not share any kin relation among their selves. In this study we give equal importance to both true positive rate and false positive rate, since we do not need any false classifications in the output. From the plot, it’s observed that for a smaller value of false positive rate, true positive rate is high and as false positive rate increases, increase in true positive rate is minimal. Area under curve of 0.84 suggests that at this point we have the best separation on results.
People who share kin relation class – ROC curve.
The below diagram shows ROC curve for people who share kin relation. Here also we can observe the same trend as in the other class. That is, among all instances most of the positive class is been predicted as positive comparing to being predicted as negative wrongly. Area under the curve metric suggests that we have 85% separability on the results.
A study of inherited facial features through blood relations is successfully completed. An accuracy of 65 percent over unseen set of validation data confirms that more than half of the facial features that an individual possess is inherited from their ancestors or it can also be stated as people who are related by blood will share similar facial characteristics. If the accuracy that is generated from the model can be further improved, a wide range of applications can utilize the former.
Searching and findng missing people always prove to be a source of hardship and a tedious process for the government bodies and agencies. If a kinship prediction model can be employed in such scenarios, the entire task can become extremely easier. Moreover, such a model can generate suggestions on social media platforms based on the images provided, thereby enhancing the user experience. Future development can be carried out to exalt the quality of the system, thereby increasing its chances of being exploited in further applications.
Footnotes
Acknowledgments
This project has been supported by VGST, Department of ITBT, Government of Karnataka. Project has been developed as a part of Project CoE Digital Forensics Intelligence.