
Abstract
The doctrine of the “one size fits all” approach in the field of disease diagnosis and patient management is being replaced by a more per patient approach known as “personalized medicine”. In this spirit, biomarkers are key variables in the research and development of new methods for prognostic and classification model training based on advances in the field of artificial intelligence [1, 2, 3]. Metabolomics refers to the systematic study of the unique chemical fingerprints that cellular processes leave behind. The metabolic profile of a person can provide a snapshot of cell physiology and, by extension, metabolomics provide a direct “functional reading of the physiological state” of an organism. Via employing machine learning methodologies, a general evaluation chart of nutritional biomarkers is formulated and an optimised prediction method for body to mass index is investigated with the aim to discover dietary patterns.
Introduction
For the precise evaluation of patients, the personalization of patient management, the classification of disease and the optimization of medication strategy, biomarker identification is utilized. Biomarkers are medical signs that in a broad sense “provide objective indications of the medical state observed from outside the patient and can be measured accurately and reproducibly” [4]. Thus, biomarkers include molecules, proteins, antibodies, and the biochemical changes discovered in tissue, blood or other bodily fluids and they indicate the presence or the future expression of a specific disease, condition or/and mutation [5]. In other words, biomarkers can act as a metric for today or as a prognosticator for tomorrow. Biomarker and related data analysis can be retrieved by a sole metric from examinations and observations or by a combination of metrics. Body mass index(BMI) is an example of combined biomarker that is derived from the mass and height of an individual. Other common biomarkers can be seen in Table 1.
Biomarkers
Biomarkers
“Metabolomics” is defined as the systematic study of the metabolic process. It is an important tool for the identification of crucial metabolic biomarkers known as “metabolites”. Metabolomics can produce a snapshot of the physiology of the cell and therefore offer a functional reading of the state of an organism [6].
Metabolite examples.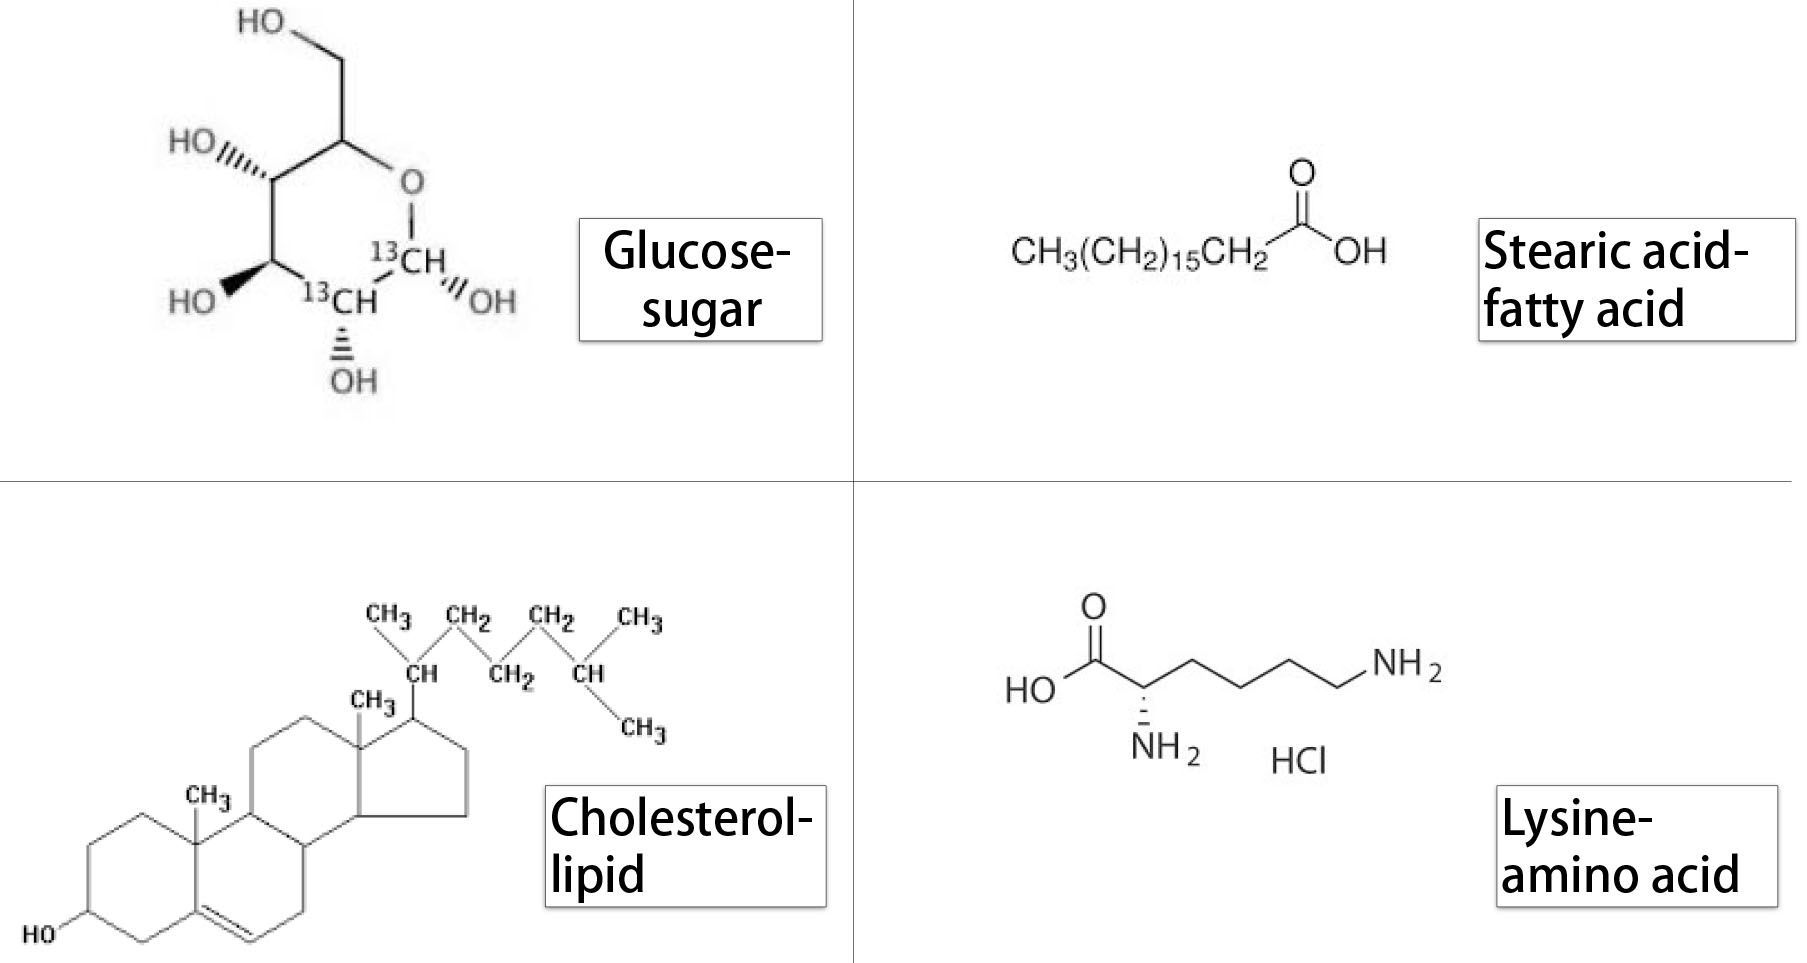
“Metabolism” is the complete set of metabolites within a cell, tissue or biological sample at any given point in time. Metabolism is defined by dynamic processes where small molecules are constantly absorbed, synthesized, degraded, and interact with other molecules, both within and between biological systems and the environment. Some important metabolic reactions are shown in Fig. 2 (image adapted from the Reactome Database [7]).
“Nutritional genomics” refers to the application of high-performance functional genomics in nutrition research [8, 9]. Related technologies can be easily adapted and integrated into databases of genomic sequences and facilitate the study of gene expression in parallel and for thousands of different genes. Thus optimal nutrition at the level of populations, specific groups and individuals can be implemented with the deployment of such technologies. This, in turn, will promote the development of nutrition-based therapies and the creation of improved foods aimed at health optimization [10].
The impact of diets on chronic diseases and health in general is very significant. Through the study of nutritional indicators, the bioactive compounds in foods can be determined, and through that the effects of said components in public health in the general population can be distinguished [8].
Metabolic processes – adapted from Reactome database.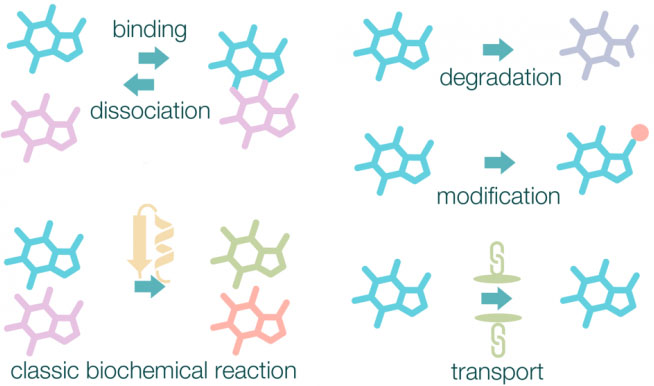
Through metabolomics a promising approach in the identification of chemical compounds is acquired, that can lead to early detection, diagnosis, prediction of therapeutic response and prognosis of disease [11].
Obesity or a tendency for obesity is often considered a determining factor of bad health and a preset for a variety of severe health problems. Hippocrates had soberly stated that “sudden death is more common in those who are naturally fat than in the lean”. Type 2 diabetes association with obese and overweight in both male and female populations and all ethnic groups has been the focus of many studies and scientific research. Insulin resistance is identified as a fundamental defect discovered in population with type 2 diabetes that is also more commonly obese. It must be pointed out [12] that over 90% of diabetics are obese or overweight [13, 14].
A number of genes may be linked to the development of obesity. Sibling-pair linkage analysis, tumor necrosis factor-alpha was a determinant for body fat percentage. A link between fat cell production of tumor necrosis factor-alpha and obesity has also already been established [15].
Etiologic pathways that may lead to cancer can be identified through metabolomics and the association between metabolite concentration in plasma and breast cancer risk has been thoroughly investigated [11].
In this paper, we extend previous related research work of ours [16, 17, 3] and provide more details on a system that we have developed, implemented and evaluated for use in the fields of nutritional biomarkers and metabolomics.
Initial system
Conception
Our proposed system aims to use the capabilities and strengths of neural networks and machine learning to create a functioning pathway for usable applications in the fields of nutritional biomarkers and metabolomics.
The design of our model is based on the assumption that observational data (medical history, dietary habits, lifestyle, etc.) and/or laboratory data contain information about a person’s condition. As weight is an important indicator of health, BMI (height/mass index) will be considered as a target for our deployed deep neural network. The standard biochemistry profile results will be used as features/inputs for the training of the neural network [18, 19].
The BMI data will be transposed in a x*3 table and separated into three groups, depending on the commonly used ranges to classify weight categories based on the BMI as seen in Table 2.
BMI classification
BMI classification
Due to limitations of our sample data, the categories of obese and overweight have been consolidated. If any resulting data points from the initial data processing are more prominent in defining and predicting the BMI, then those data points will be used in a similar process as targets. The inputs/features of the neural network will now be the results of the dietary profile of our sample as shown in Table 3.
Dietary profile classification
The design process of the neural network includes two phases and an optimization intermediary as depicted in the images below (Figs 3–5).
Phase 1 – Conceptual analysis.
Phase 2 – Conceptual analysis.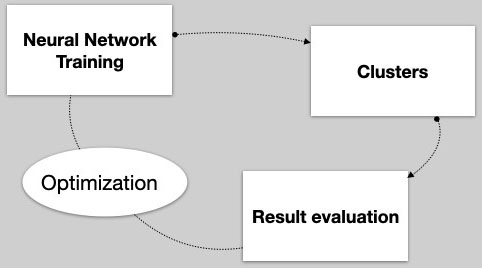
Optimization – Conceptual analysis.
Neural Network S.B.P
Data analysis
As already mentioned the BMI data will be transposed into a x*3 table and separated into three weight categories based on the accepted weight ranges in a total of 6413 sample of men and women of different ages, belonging in different ethnicity and age groups and living in the USA [20]. The categories are underweight, obese and overweight and the results are given in Fig. 6.
Bmi-clusters.
Since the neural network will have to predict the probability as an output and probability exists between the range of 0 and 1 the logistic(sigmoid) activation function will be implemented. An adaptive moment estimation (adam) optimization algorithm will be engaged, that updates network weights iteratively based on the training data with an adaptive learning rate and maximum iterations(epochs) will be 1500. 4 hidden layers will be deployed.
The best results of the implemented CNN can be viewed in Table 4.
BMI neural network results
BMI neural network results
The neural network has a 10 fold cross validation average of 0.665. It has to be emphasized that the sample data is significantly inhomogeneous and less gravitated towards the underweight cluster. Nonetheless, the result of the cross validation process is promising and less biased than expected as can be seen in the ROC curves in Fig. 7.
RocCurve.
The Rad Viz multi factorial data visualization algorithm is then utilized in Fig. 8. As previously described, each category refers to a different weight class. The three elements out of the 34 in total that stand out and will be used as targets for the second neural network that will be deployed are the elements bicarbonate(f5), aspartate aminotrasferase(f1) and glucose(f16).
Radviz S.B.P.
Data analysis
The elements identified in the previous process will be used and divided into 2 categories according to the range of their values. The categories will be two, i.e. the “withing normal range category” and the “out of normal range category” (Fig. 8). Some of the elements examined are listed in Table 5.
Dietary profile
Dietary profile
Diet clusters.
Since the neural network will have to predict the probability as an output and probability exists between the range of 0 and 1 the logistic (sigmoid) activation function will be implemented. An adaptive moment estimation (adam) optimization algorithm will be engaged, with an adaptive learning rate. The maximum number of iterations (epochs) will be 1500, while 6 hidden layers will be deployed.
The best results of the implemented DNN can be viewed in Table 6.
BMI accuracy
BMI accuracy
The implemented network has a 10 fold cross validation testing average of 0.6073 which is significant in a relatively heterogeneous sample of about 6000 people.
Rad-viz dietary profile.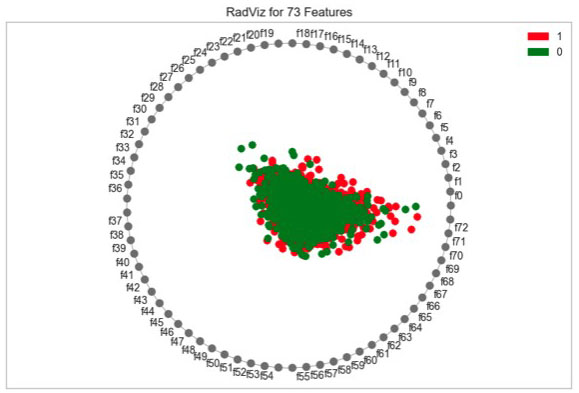
Subsequently, the Rad-Viz multi factorial data visualization algorithm is used. The results are listed in Fig. 10. The characteristics are divided into 2 categories in reference to the used nutritional variables and are placed in the circle. Again, some factors stand out in both clusters and further investigation is due.
New proposed system
New design
In relation to the initial system described above, the reconsideration of systems results led to a better understanding of the examined data. Thus, a new concept was created that better streamlines the process and improves results as can be seen in Fig. 11.
Improved concept.
The process will be conducted in three different circles as to better define the different clusters. In detail, the network will test its accuracy by comparing each class to each other in pairs of two and not all three classes together as previously examined (Section 3.1) as can be seen in Table 7. The goal is to identify more useful information, especially when testing the accuracy between the more extreme classes as in circle 2. The main goal is the creation of an automated evaluator that can identify its own optimum pathway. Obesity is more frequently identified for being a collateral characteristic of important health problems [15] or the main cause of one, thus it is assumed that the obese class is an important one holding valuable and informative layers. In this paper the focus is on the ideal weight in relation to blood serum and diet, and since underweight ness is an obvious outcome of malnutrition and a lack of calorie intake,and for that at this stage, it will be ignored as a class.
Circles
Circles
For the optimization of the process and to create a leaner procedure, a correlation algorithm as related to the B.M.I was deployed. Since some data gave the same result measured in a different measurement unit and in essence were duplicates and for that were removed. 22 blood markers were finally used as inputs, significantly less than the 35 used previously.
Semantic grouping
Semantic similarity and relatedness measures how concepts are related. It is an essential approach for better clustering biomedical data and creating meaningful separation in large data-sets [21]. For this reason we defined the subgroups that are included in the full biochemistry profile that was used, in order to run separate tests and explore new pathways or improve outcomes. The mentioned grouping can be seen in Fig. 12).
Semantic grouping.
In order to improve predictive capability of the deployed neural network, more data will be included and the system will also be tested by using the segmented-clustered feature set, as defined by the current medical protocols and related scientific bibliography. Specifically the predictive accuracy of the SBP neural network will be tested by exclusively using either the liver panel data, comprehensive metabolic panel and the lipid panel as already described in Fig. 12. A data analysis related to key questions will be also implemented in order to define bias if any exists. More precisely the mix of the population as per age, gender and other related factors will be analysed.
Implementation and evaluation of new system
In this section the data-points, which have been significantly increased will be thoroughly analysed, more precisely about 40.000 data points have been added. The new system will be evaluated by testing the accuracy in all circles, as defined in Table 7. The evaluation will be done for the complete data-set as defined by the full biochemistry profile and when using it’s subsequent sub-clusters (Fig. 12).
Data analysis
The examined added data will be analysed in relation to gender [22] and age [23, 24, 25] since both are variables strongly related to DNA and metabolism. Since the network will run in 3 circles of groups of three (Table 7 the groups will be detailed as per their respective B.M.I category. The analysis can be seen in Fig. 13. As can be seen the sample is well balanced between genders and there is a wider distribution between age classes. It can be concluded that the network fed with this particular data is less likely to be biased.
Deep back propagation network
The deep neural network will run in 3 circles. The way the features will be used is defined by the semantic grouping discussed in Section 5.4. It should be pointed now, that in antithesis to the previous system the data fed into the neural network will be balanced.
Weight, age, gender clusters.
In all circles and tested classes, when the full biochemistry profile was used the networks accuracy was significantly improved as can be seen in Fig. 14. When testing the extreme classes of normal and obese (circle 2) categories, the recognition of patterns in the examined data is more clearly defined. The average 10 fold testing accuracy in circle 2 is 0.81. In a 10 fold cross validation average for all circles there is an increase in testing accuracy of 15% in comparison to the cross validation average produced by the initial system . It must be pointed out that demographics data (gender, age) were also tested along with the full biochemistry profile as inputs for the system but did not add information and accuracy slightly decreased. The metabolic, liver and lipid panel was also used but accuracy decreased.
10 fold accuracy, comparison of systems.
With the deployment of deep neural networks, a link between two very important metabolic routes has been explored. The pathogenic route is investigated through a classification based on the Body Mass Index (BMI), by identifying patterns in the biochemical profile compiled via a simple blood test. The dietary route is looked into in a similar way via linking the diet intake with the biochemical profile elements that seem to be more influential in defining our samples weight class. By separating the weight classes in different groups and by balancing the data, an improvement in accuracy was achieved. Through the deployment of different combinations for data features, the main conclusion was that the quantity of data is the main benefactor in the deployed system’s predictability. There is extensive bibliography regarding metabolism, dietary profiling, metabolomics [26] and related research that utilizes statistical methods for correlation and causation purposes. Our aim is to design a model that can automate a mundane procedure, to create a fast and easily applicable method for scaled applications with the use of deep neural networks and pattern recognition techniques.
Conclusion and future research
A bigger data set is guaranteed to improve classification ability and accuracy. Interpreting and extracting content from metabolic data sets is extremely demanding and represents an important area of research [27]. A more challenging approach would be to integrate metabolomics with genomics and proteomics. In summary through this research:
A link between blood and weight with the use of simple deep neural networks was established. The semantic grouping can be a stepping stone for the evolution of the proposed classification procedure. The more analytical approach of the data offer a clear view of what is tested and through that related bias can be calculated.
The identification of patterns in complex data sets can lead to the discovery of new bio markers and add precision in medical classification and patient management [28, 29]. This and other related research is currently under way and will be reported elsewhere in the near future.
Footnotes
Acknowledgments
This work has been partly supported by the University of Piraeus Research Center.