
Abstract
Cyber security evolving as a severe problem almost in all sectors of cyberspace, due to the time-to-time increase in the number of security breaches. Numerous Zero-days attacks occur continuously, due to the increase in multiple protocols. Almost all of these attacks are small variants of previously known cyber attacks. Moreover, even the advanced approach like Machine Learning (ML), faces the difficulty in identifying those attack’s small mutants over time. Recently, Deep Learning (DL) has been utilized for multiple applications related to cybersecurity fields. Making use of this DL to identify the cyber attack might be a resilient mechanism for novel attacks or tiny mutations. Thereby, a novel cyber attack classification model named DCNN-Bi-LSTM-ICS is proposed in this work. This proposed DCNN-Bi-LSTM-ICS has five working stages. Firstly, in the data acquisition stage, the input data (considering the datasets) for attack classification has been collected. These raw data are pre-processed in the second stage, where an improved class imbalance balancing processing is conducted which makes use of the Improved Synthetic Minority Oversampling Technique (ISMOTE). In the third stage, along with the conventional mutual information and statistical features, Improved holo-entropy-based features are extracted. To choose the appropriate feature from those retrieved features, an Improved Chi-Square (ICS) processing is developed in the fourth stage. In the final classification stage, a hybrid classification model that combines both the Deep Convolutional Neural Network (DCNN) and Bi-directional Long Short Term Memory (Bi-LSTM) has been developed. The outcomes show that the proposed DCNN-Bi-LSTM-ICS can offer outstanding performance in the cyber attack classification task.
Keywords
Introduction
Internet’s extreme utilization in multiple areas motivated scientists and researchers to leverage the intelligent models that can assist users. In addition to providing efficient computation, it can also sustain the service quality over the network. Some conventional approaches were less efficient and more time-consuming. To lower the cyber threat’s harmful effects, it’s essential to develop an effective attack detection system. The compilation of multiple security mechanisms, as well as technologies created for securing the network, data, and a program from multiple malicious activities like stealing, data modification, destruction over the network or internet, and unauthorized access, is named Cyber security [1, 2, 3]. Two main concerns of cybersecurity are the network’s security systems and the protection of the host. Recently, numerous areas like Wireless Sensor Networks (WSNs), cloud computing as well as IoT were protected by this. To provide network or system security, multiple security measures like firewalls, antivirus, and Intrusion Detection Systems (IDSs) are available. However, internet services are still disrupted continuously by these cyber threats every day. That is the reason, researchers are providing their contribution to the security system design [4, 5].
Some popular cyber attacks are denial of service (DoS), remote to local attacks, distributed DoS attacks (DDoS), adversarial attacks, user-to-root attacks, probing, botnet, poisoning and evasion attacks, zero-day attacks, spamming as well as phishing attacks. To detect these attacks, 3 categories of attack detection approaches are there, which are misused, anomaly, and hybrid-dependent detection [6, 7, 8].
By the pre-stored attack signatures, misuse-based detection was scanned and is frequently utilized for detecting known attacks. Detecting the known attacks only with minimal false alarms is crucial. This requires a signature’s specific alteration and attack rules on the database. Both unknown and known attacks are recognized by the anomaly-based technique. It can capture the host’s machine behavior along with the network and find the anomalies [9, 10, 11]. Since it is capable of identifying zero-day attacks, it is considered an important method. This approach has multiple advantages. The most important one is profiling actions customization because it makes the attackers confused about what they can do to enter and remain unnoticed. However, with the advantage, this also has the demerits of a higher false alarm rate and misclassification like considering the legitimate action as an anomaly [12, 13]. The third one is the hybrid, which is the fusion of misuse as well as anomaly-based detection. In the phase of detection, it assists higher performance and lower false alarm rate. But for newer attacks, these approaches are not efficient. For attaining efficient computation as well as rapid processing of the network’s complex data, Neural Networks (NNs) are frequently utilized [14, 15]. In this regard, deep network models play a major role in attack detection by training the most important attacker information. Considering that, an intelligent model for cyber attack classification named DCNN-Bi-LSTM-ICS is proposed in this work with the major contributions given below.
Proposing the intelligent detection Model that uses ISMOTE to solve the input data’s class imbalance problem. Retrieving Improved holo-entropy-based features along with the mutual information and statistical features. To propose an effective feature selection process for choosing the appropriate features via an improved Chi-square processing.
This paper’s arrangement is made as follows: Section 2, involves the recent cyber attack detection and classification-related publication, Section 3, describes the methodology of the proposed intelligent model for cyber attack classification, Section 4, offers the implementation outcomes, Section 5 explains this work’s conclusion and afterwards few references were provided.
A few recent publications about cyber attack detection and classification have been explained below.
In 2022, Shifang Dai et al. [6] focused on fault detection for networked systems with deception attacks. Initially, as a residual generator for the timely detection of randomly occurring fault signals, while taking into account the deception attacks and network delay, a fault detection filter (FDF) was presented.
In 2019, ZyadElkhadir and Benattou Mohammed [16] developed the Intrusion Detection Systems (IDS) were created. Unfortunately, dimensionality issues have occurred in those tools that lead to lower resource utilization along with higher time complexity.
In 2021, Sudhakar Sengan et al. [17] highlighted the integrity of false data cyber-attacks in the physical layers of smart grids. Through an Agent-Based Model (ABM), an attack exposure metric was provided by the developed True Data Integrity (TDI) as the first contribution. Afterwards, with an Agent-based approach, the system’s Data Integrity Security decentralization was focused on by the research.
In 2021, Prabhat Kumar et al. [18] presented an intelligent cyber attack detection system for IoT networks using a novel hybrid feature-reduced approach. By the utilization of the correlation coefficient, the feature ranking was initially performed. A single optimized feature set was obtained by combining the features via a properly designed mechanism.
In 2021, Abdulrahman Saad Alqahtani et al. [19] suggested a new frame for distributed blind intrusion detection by modeling sensor measurements as the graph signal and using the statistical features of the graph signal for the detection of intrusion.
In 2021, Ahmad Ali AlZubi et al. [7] proposed the cognitive machine learning-assisted Attack Detection Framework (CML-ADF) to share healthcare data securely. In distributing the gathered data to cloud storage, the Healthcare Cyber-Physical Systems was more effective. Cyber-attack behavior was predicted by ML approaches and they are processed.
In 2020, Ankang Ju et al. [20] analyzed the current Cyber Kill Chain models and heterogeneous data sources for APT detection. Then MCKC (Modified Cyber Kill Chain model) was proposed that could be used for standardized correlation analysis. The sub-chains were organized as a recursive structure by MCKC and various kill chain penetration processes in a similar attack scenario were linked well.
In 2020, BenamarBouyeddou et al. [8] presented an anomaly detection mechanism using the Kullback-Leibler distance (KLD) to detect DOS and DDOS flooding attacks, including transmission control protocol (TCP) SYN flood, UDP flood, and ICMP-based attacks.
Methodology
Recently, with the progress of new linked devices, the internet has enriched in both complexity as well as size. Due to the growing network complexity, the network’s systems are affected by diverse security threats and intrusions. Such threats can be overcome by creating accurate IDS. For the network, IDS can be considered as a 2nd line of defense and it can also be the network security’s key component. Many issues like higher false positive alerts cannot detect zero-day attacks and higher time consumption for attack detection are suffered by extant IDS. Consequently, this work proposes DCNN-Bi-LSTM-ICS which is an Intelligent Hybrid Model for Cyber Attack Classification. This includes 5 main working stages that were:
Data acquisition: Data collection is the initial step. According to the work, benchmark datasets are considered. Preprocessing: The acquired raw data get pre-processed by Improved data imbalance processing using ISMOTE, to solve the class imbalance problem. Feature extraction: From the pre-processed data, Improved entropy (Holoentropy) based features along with mutual information and statistical (maximum, minimum, standard deviation, mean, and median) features are extracted. Feature selection: Subsequently, choosing the appropriate feature from the retrieved features via improved chi-square processing. Classification: For attack classification, a Hybrid classification algorithm combining DCNN and Bi-LSTM is employed in our work. Figure 1 shows the overall representation of the proposed DCNN-Bi-LSTM-ICS.
Overall representation of the proposed DCNN-Bi-LSTM-ICS model.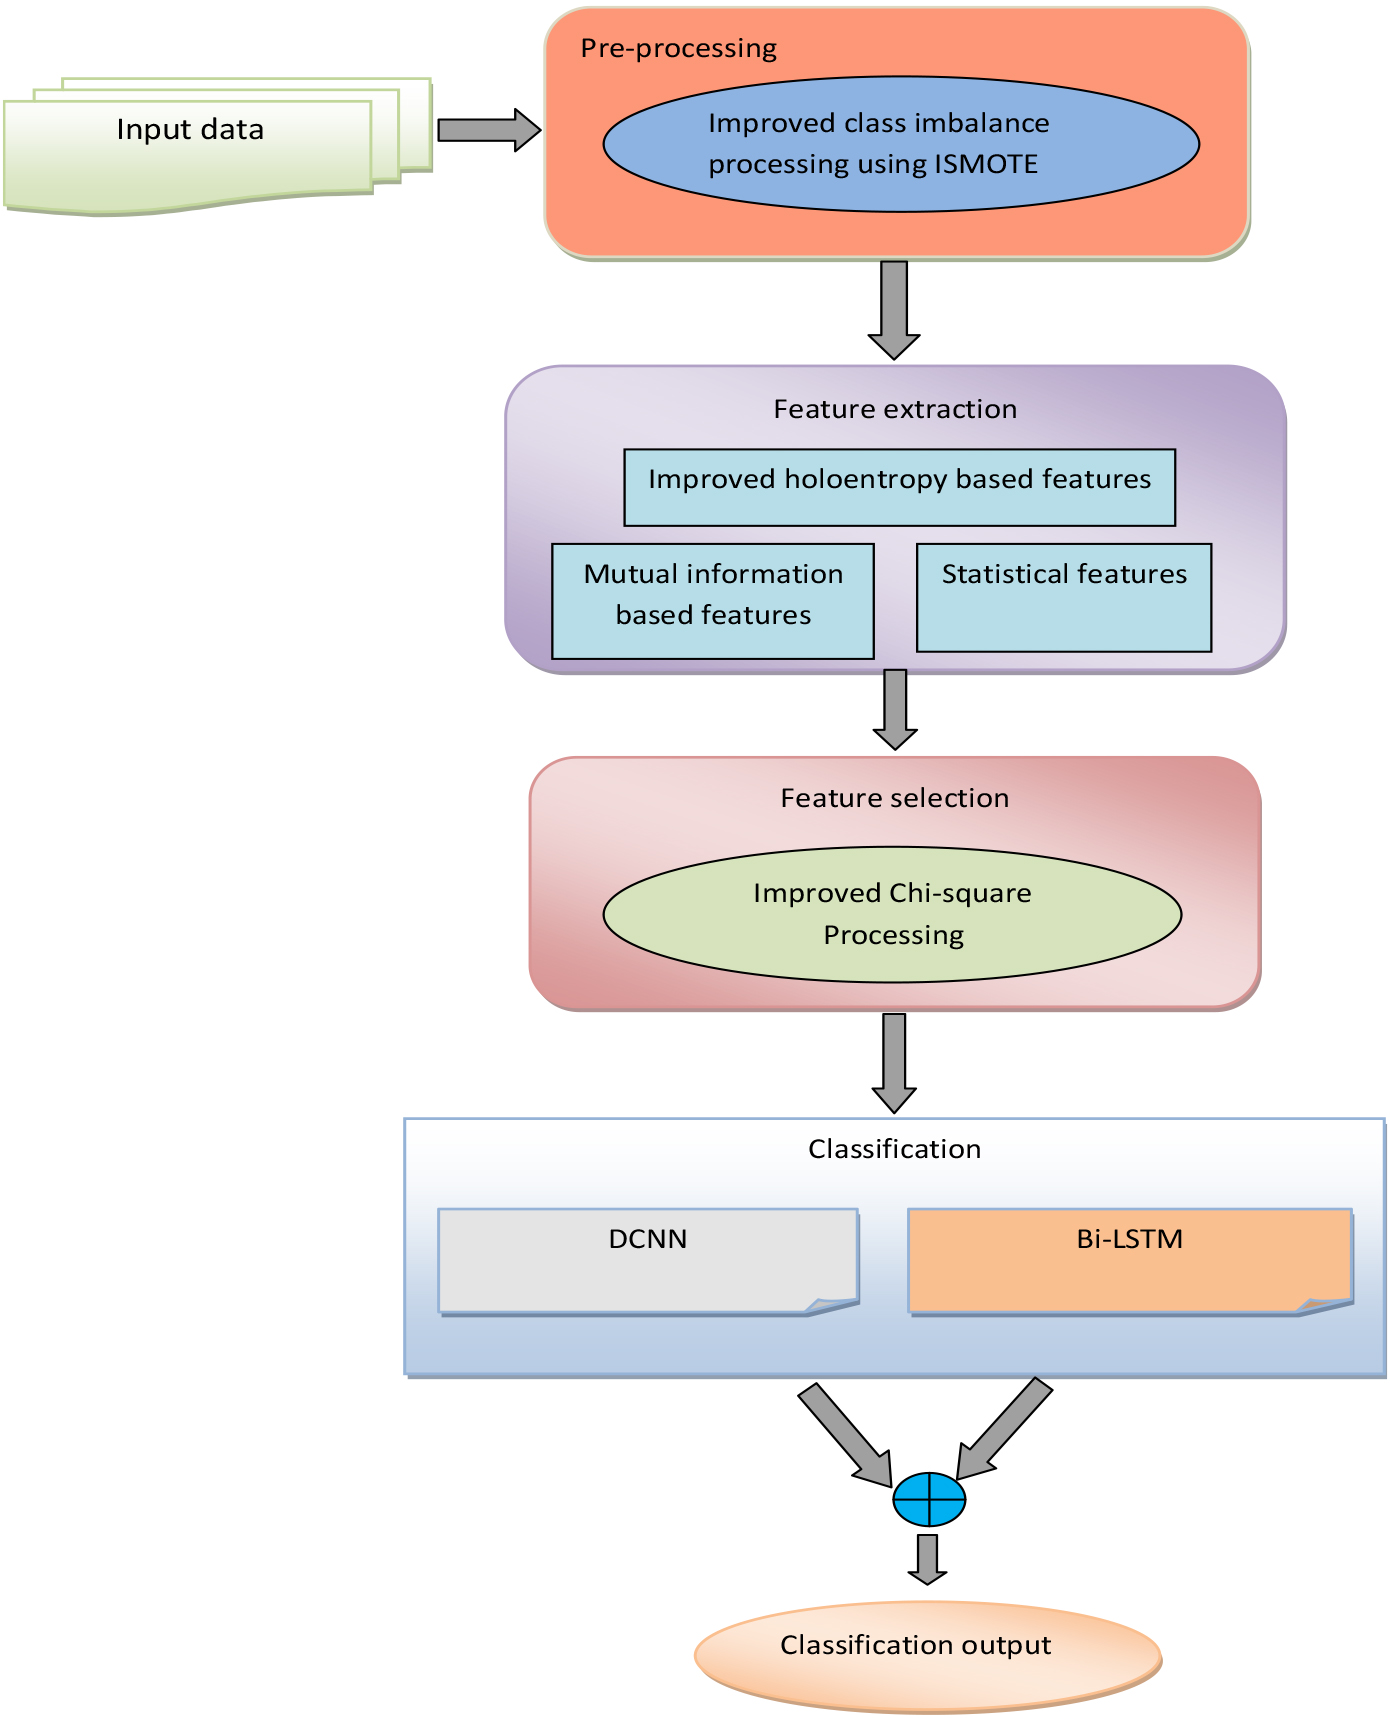
Our cyber attack classification model’s first step is data acquisition. That means gathering the data from related resources. Our work makes use of two benchmark datasets like NSLKDD Dataset and the CSE-CIC-IDS2018 dataset. Following the data acquisition, the data pre-processing is conducted which is elucidated below.
Pre-processing
The obtained raw data
For every sample, identify the k-nearest neighbors. From a k-nearest neighbor, choose the samples arbitrary. New sample identification To the minority, add the new samples. Afterwards, a dataset will be developed.
This SMOTE has drawbacks because of its insensitive oversampling where the minority sample’s formation fails to account for the sample from the majority class’s distribution. This leads to the unnecessary minority sample’s formation around the positive instances, which might aggravate the issue developed for borderline as well as noise during the process of learning.
For better classification, almost all classification algorithms attempt to get pure samples for learning and creating each class borderline as definitive as feasible. It’s easier to categorize the synthetic examples that were distant from the borderline than the closer ones. This creates a great learning challenge for several classifiers. Considering this fact, an Improved SMOTE (ISMOTE) is proposed in this pre-processing stage, it defines the borderline clearly and also creates pure synthetic samples. The proposed Improved data imabalancing process based on ISMOTE includes 2 stages that are described below.
Stage 1: Initially, for generating the synthetic instance, the SMOTE algorithm is applied as in Eq. (1).
Here,
Afterwards, the Minkowski Distance between the new synthetic distances as well as the original minority and majority class is calculated.
Stage 2: In the 2nd stage, we have eliminated the synthetic samples having higher closeness to the majority than the minority class and the synthetic instances nearer to the borderline created by SMOTE. Its procedure has been listed below.
Consider Compute the Improved Euclidian distance between
Let the two points as
To provide a more precise estimation of Euclidian distance we have utilized the improved formula of Euclidian distance. The improved Euclidian distance calculation between
The Improved Euclidian distance between
From the above Eqs (3.2) and (4), we got two arrays
Then,
If
With these accepted synthetic instances, the noise can be eliminated by the following process. Consider,
With all minorities, the sample rapprochement can be denoted as
Similarly, as in Eq. (9), the distance among
With all majorities, the sample rapprochement can be denoted as
Then half of the synthetic samples have the lowest distance among
The balanced data
Improved entropy (holoentropy) based features
The measure of a system’s disorder or randomness is named as entropy. For detecting the outliers, the energy measurements are not sufficient. To get superior outlier candidates, total correlation is also essential. Likewise, holoentropy’s contribution along with entropy as well as the total correlation assists in providing proper outcomes for outlier detection [22]. The sum of entropy, as well as the random vector’s total correlation, is referred to as the holoentropy. Here, the conventional holoentropy
Here,
Our work utilizes the improved holo-entropy function to handle the disordered data based on the correlation among the attributes. The formulation of improved holoentropy is given by Eq. (12), where the weighted tansig function,
Where the b-th entropy value can be denoted as
Here, the mass function is
Where the correlation coefficient can be symbolized as Cor. In a sample,
The measure of the dependence among the variable (a category
Statistical features such as mean, standard deviation, median, maximum as well as minimum are extracted to offer a better intrusion detection model. These statistical features are given below.
a) Mean
All numbers in the pre-processed data sets are averaged to get the mean value that is numerically represented in Eq. (16) [24].
Here, the set of
b) Median
In an arranged dataset, the mid value is considered the median [24].
Let the value at position
Find the values at positions
c) Standard deviation (STD)
The square root variance is referred to as mean and is symbolized as (
Here, population standard deviation is symbolized as
d) Minimum
This number is the data value
e) Maximum
This number is the data value
The extracted statistical features were symbolized as
These extracted features were denoted as
After the extraction of features, a feature selection process takes place, which uses an improved Chi-square processing. To reduce the large data, the feature selection process is crucial. The classification process can be enhanced by this. The noisy as well as irrelevant data get deleted by selecting all the data’s representative sub-sets to reduce the complexity of the classification process.
Chi-square has been utilized in statistics, for testing two events’ independence. By providing two variable’s data, we can obtain the expected count
Here, the observed value is symbolized as
Calculate improved Chi-square for all features. In this step, to compute the improved Chi-square, we have utilized the following Eq. (19), instead of Eq. (18).
Rank the features in descending order based on entropy values. A high entropy value indicates more information and a low entropy value indicates less information. Select features with the highest entropy values and then find the percentage for setting the threshold. Scores higher than the percentage are selected to be a part of the final set of features and scores lower than the percentage are excluded.
This selected feature can be denoted as and that is sent to the classification process.
The classification process is carried out based on those selected features. This is the final stage of our DCNN-Bi-LSTM-ICS model. A hybrid classification model which is the combination of both DCNN and Bi-LSTM is utilized for this process that intakes the selected features as input.
Attack classification using DCNN
The most commonly utilized NN is DCNN. This is developed from the traditional NNs; this can be used for data, images, or video. The CNN having more convolutional layers is termed Deep CNN. CNNs can be utilized for numerous applications because they can learn features from the database automatically. This CNN has the layer arrangements like convolutional, max pooling, convolutional
a) Convolutional layer: Several feature maps are included in a convolutional layer. As expressed in Eq. (20), at the
Here, the first layer
b) Pooling layer: The input feature map’s down-sampled versions are produced by a pooling layer as in Eq. (21).
Here, the multiplicative bias has been represented by
DCNN’s architecture.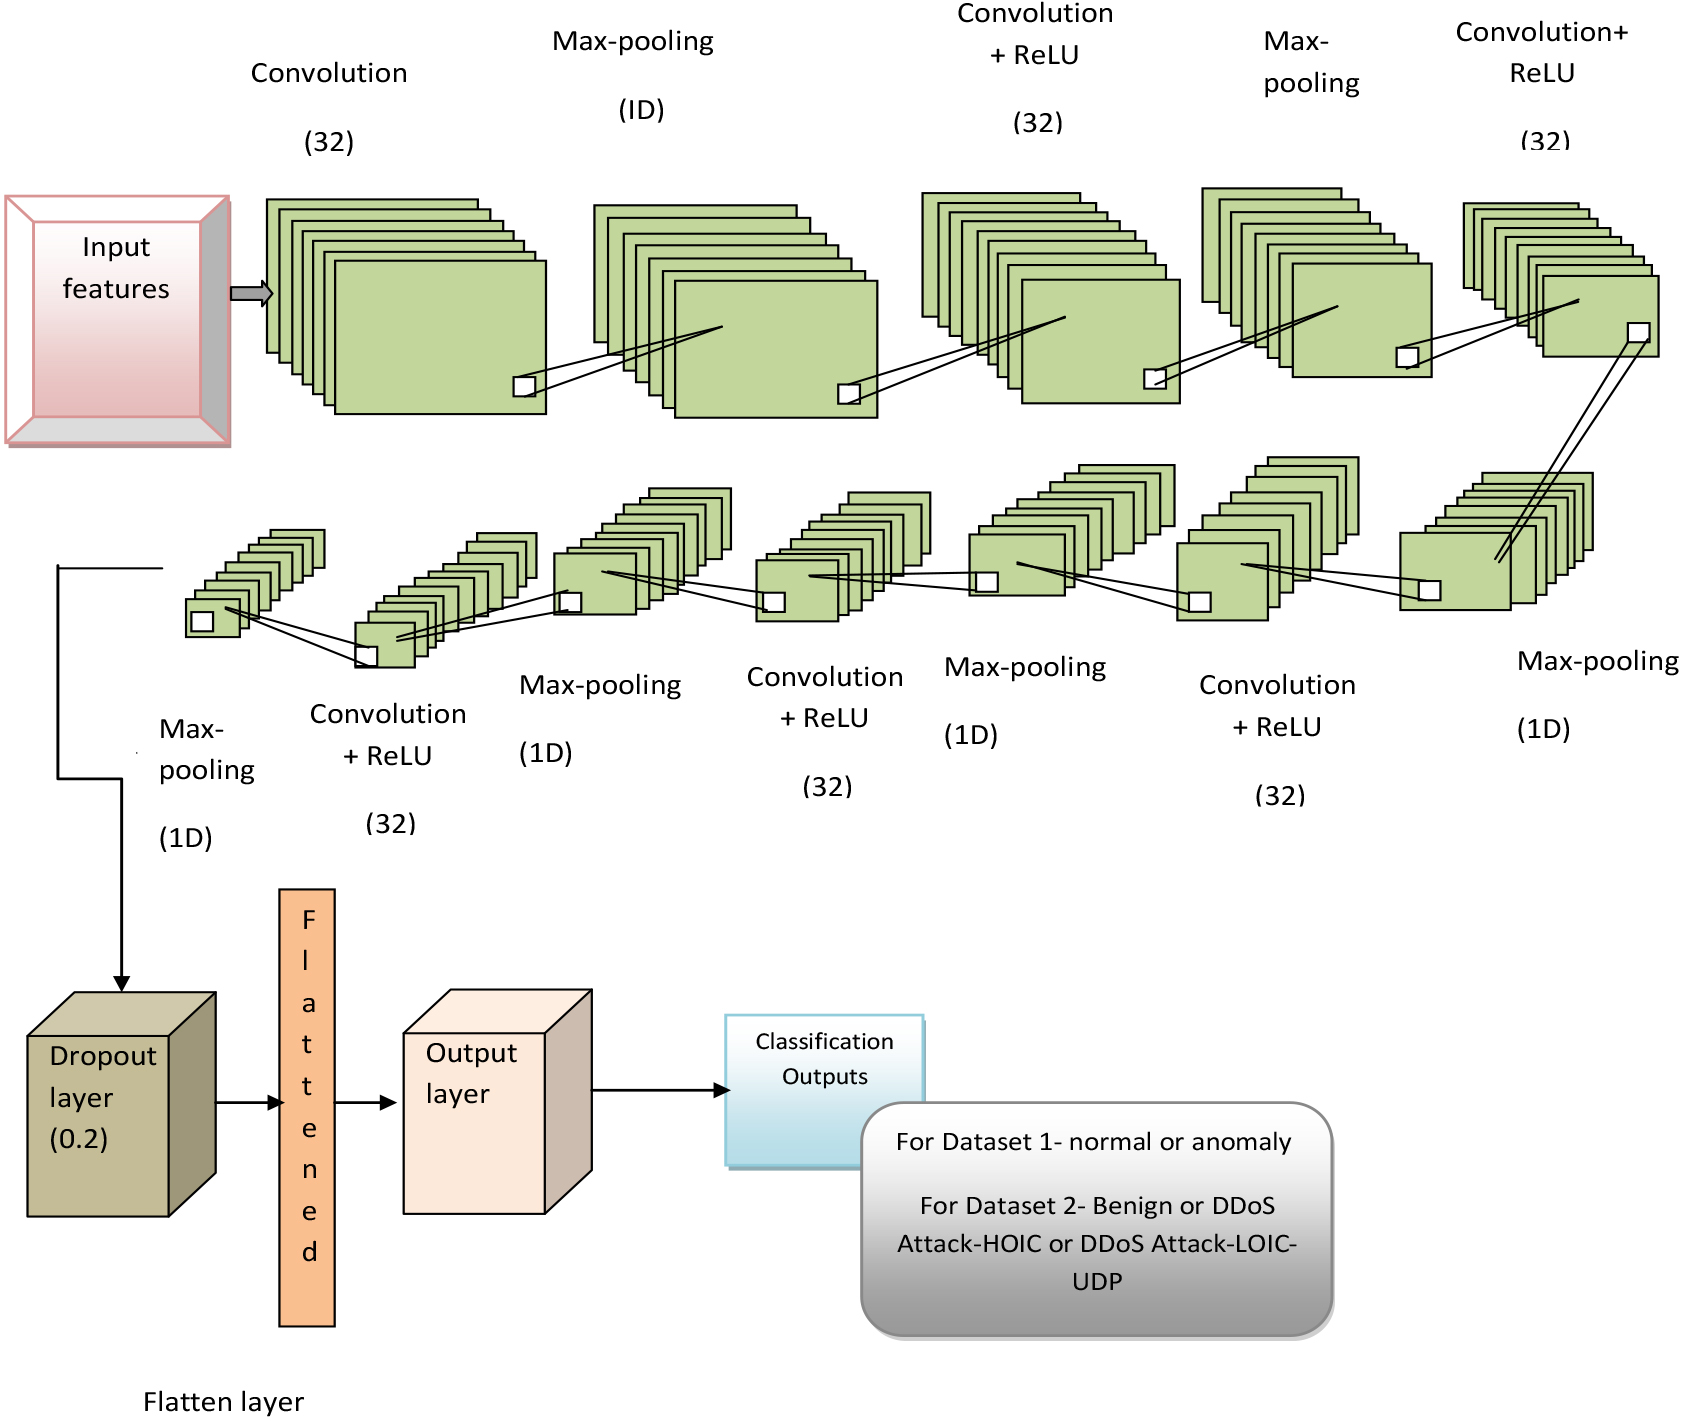
Following the feature learning, the classification process has been conducted. The CNN architecture’s final stage utilizes a classification layer like softmax to provide the classification output that is normal or anomaly for dataset 1 (NSLKDD) and dataset 2 (CSE-CIC-IDS2018), Benign or DDoS Attack-HOIC or DDoS Attack-LOIC-UDP. DCNN’s architecture is presented in Fig. 2.
In parallel, the selected features from the feature selection process are also given to the Bi-LSTM classifier as input. For processing the sequence data, LSTM is more suitable. This is also utilized to solve the issues of gradient explosion as well as gradient disappearance during long sequence data processing. Three layers are hidden, input as well as output layers are included in the LSTM. Along with that, LSTM has three gating units and memory units [28].
During the LSTM’s forward propagation process, each threshold can be evaluated from the following formulas that are Eqs (22)–(27).
Where the sigmoid activation function can be represented as
In Bi-LSTM, two LSTM layers are there in opposite detections, which are named as forward as well as backward propagation layers. At the same time, these layer links the input and layers and function reverse-order and time sequence calculations correspondingly to attain forward as well as backward hidden layer’s output at all moments in turn. Afterwards, by merging the forward as well as backward hidden layer’s corresponding output results at each moment, the final output can be achieved. Its architecture is displayed in Fig. 3.
Architecture of Bi-LSTM.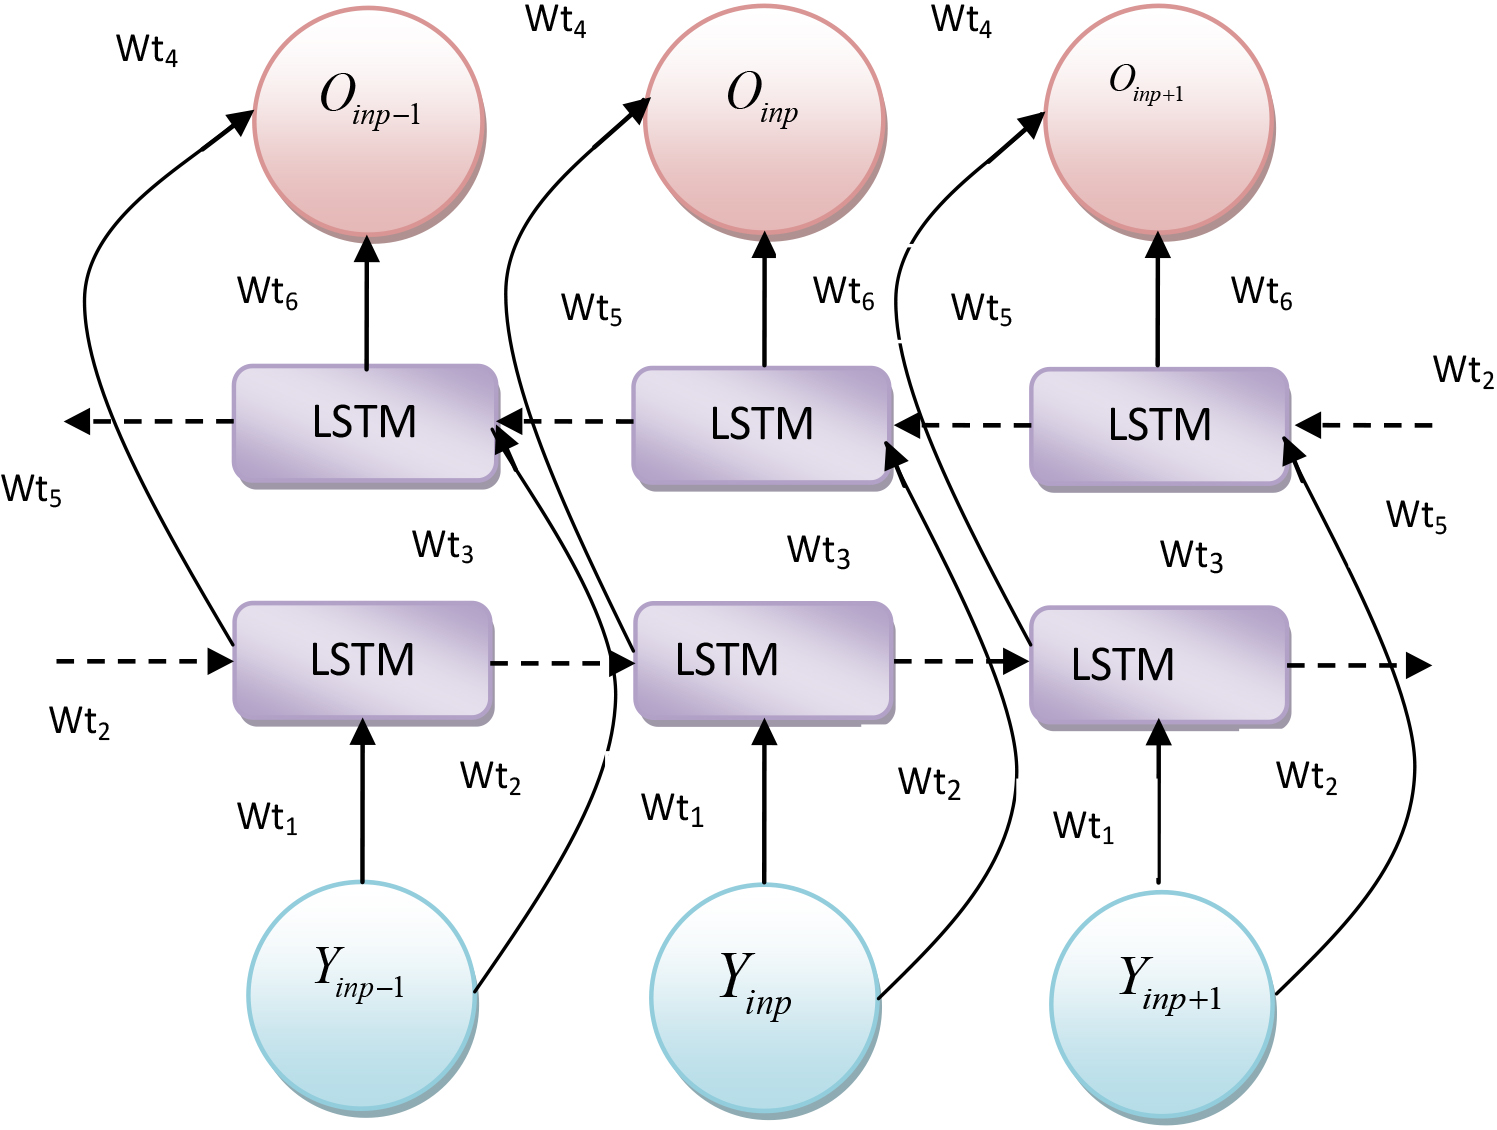
Its specific numerical expression is given in Eqs (28)–(30)
At time
Finally, to get accurate classification results, the output obtained from both classifiers is averaged and the final result is normal or anomaly for dataset 1 (NSLKDD) and dataset 2 (CSE-CIC-IDS2018), Benign or DDoS Attack-HOIC or DDoS Attack-LOIC-UDP.
Evaluation of the DCNN-Bi-LSTM-ICS approach for dataset 1 in relation to current methods with regards to (a) accuracy, (b) sensitivity, (c) precision, (d) specificity.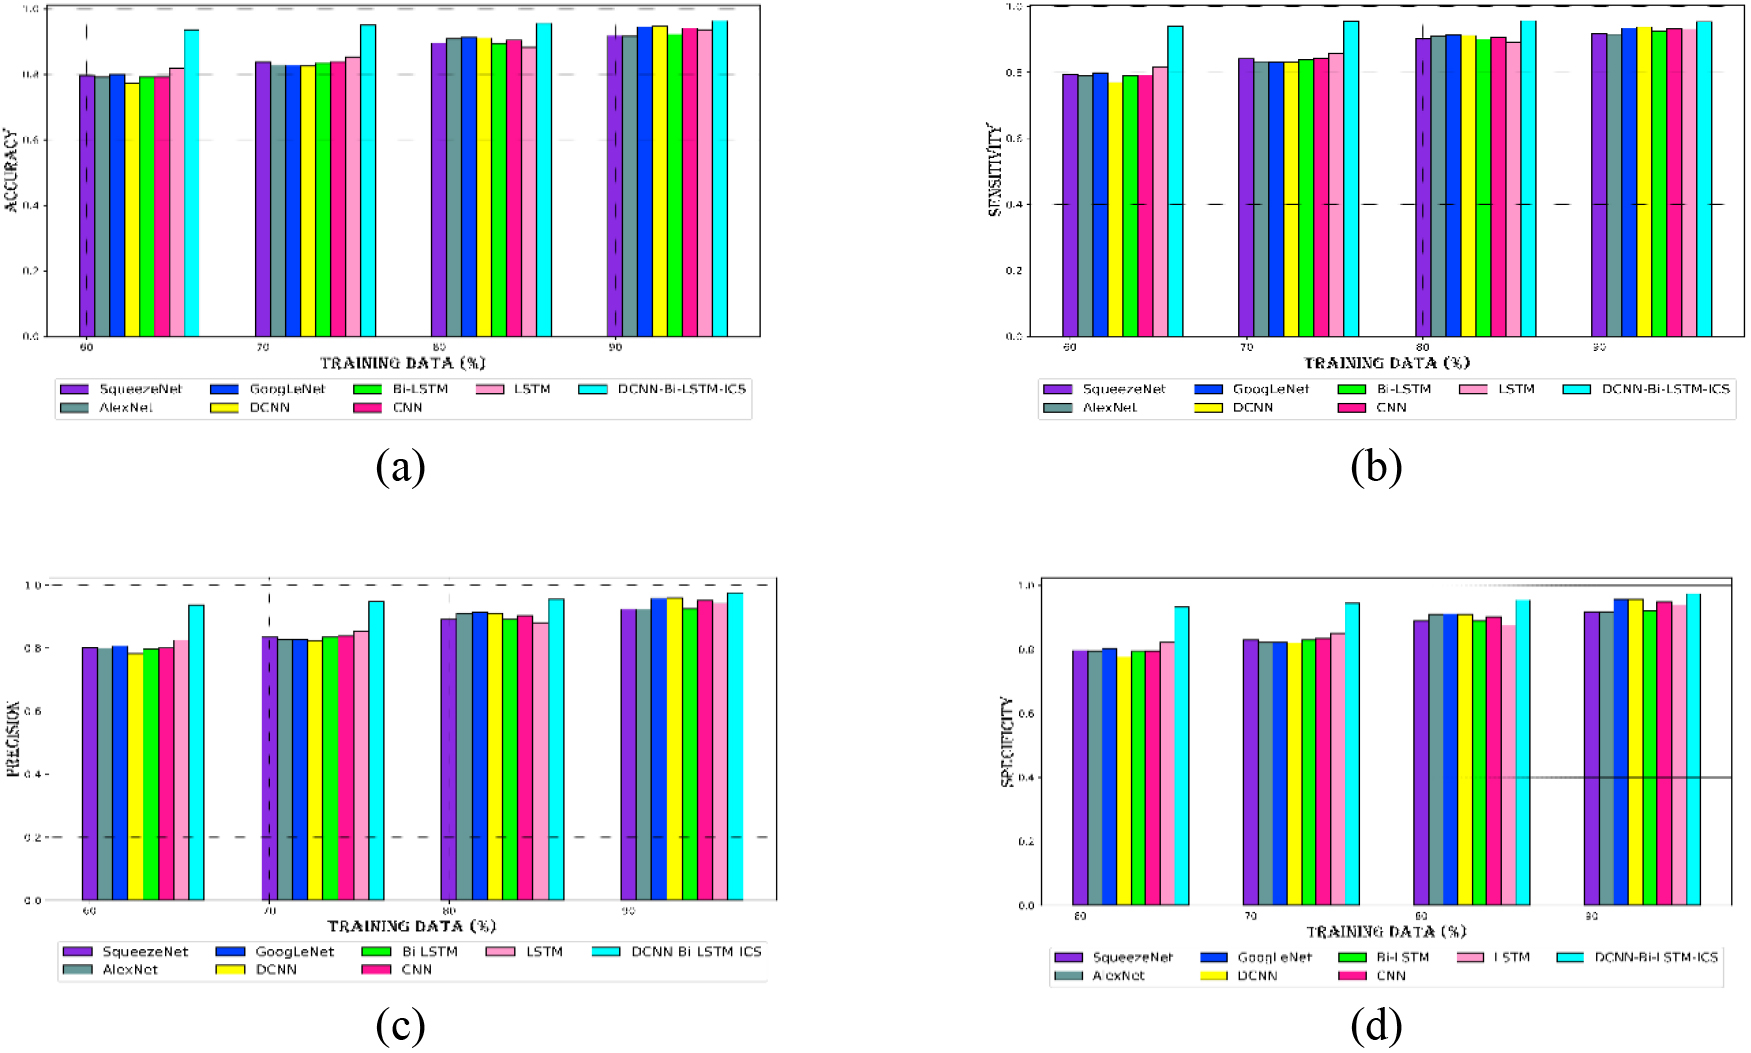
Evaluation of the DCNN-Bi-LSTM-ICS approach for dataset 2 in relation to current methods with regards to (a) accuracy, (b) sensitivity, (c) precision, (d) specificity.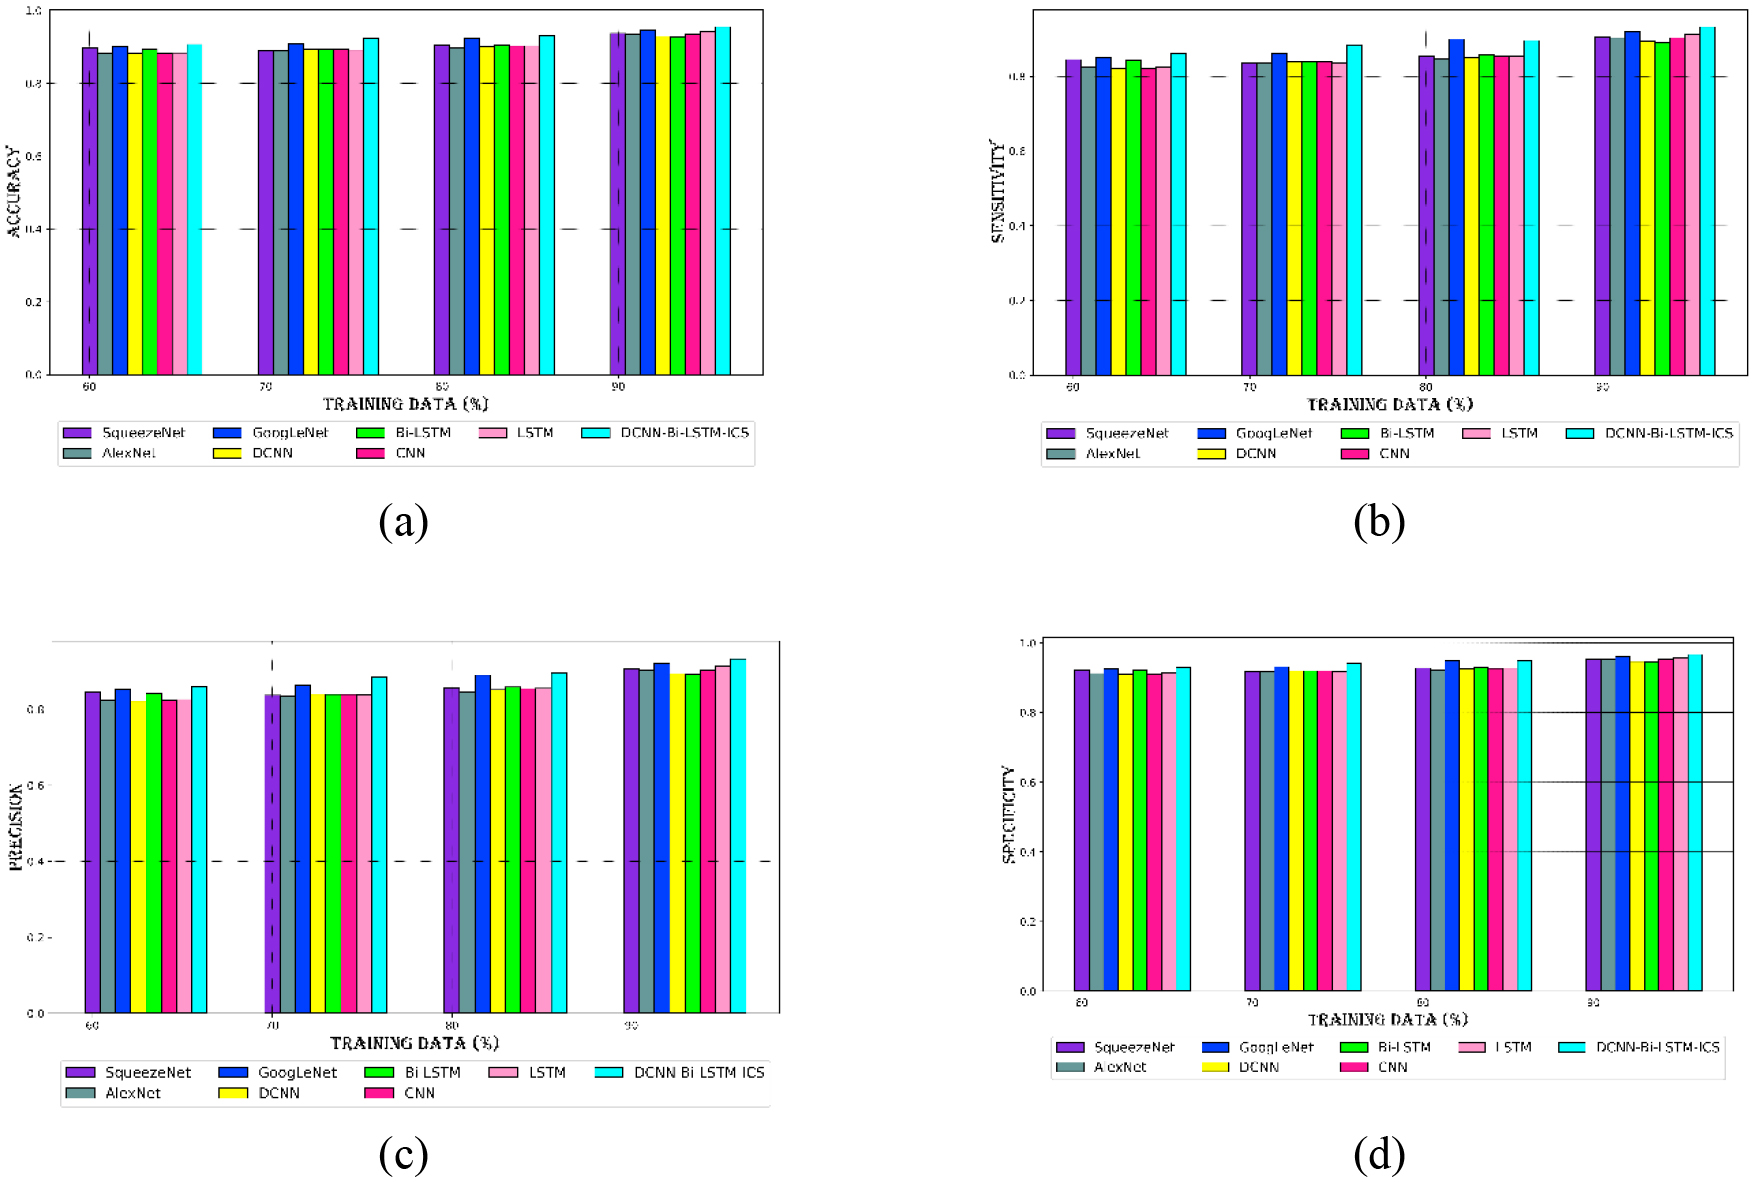
Comparing the new technique’s performance to current techniques for (a) FNR, (b) FPR, and (c) FDR for dataset 1.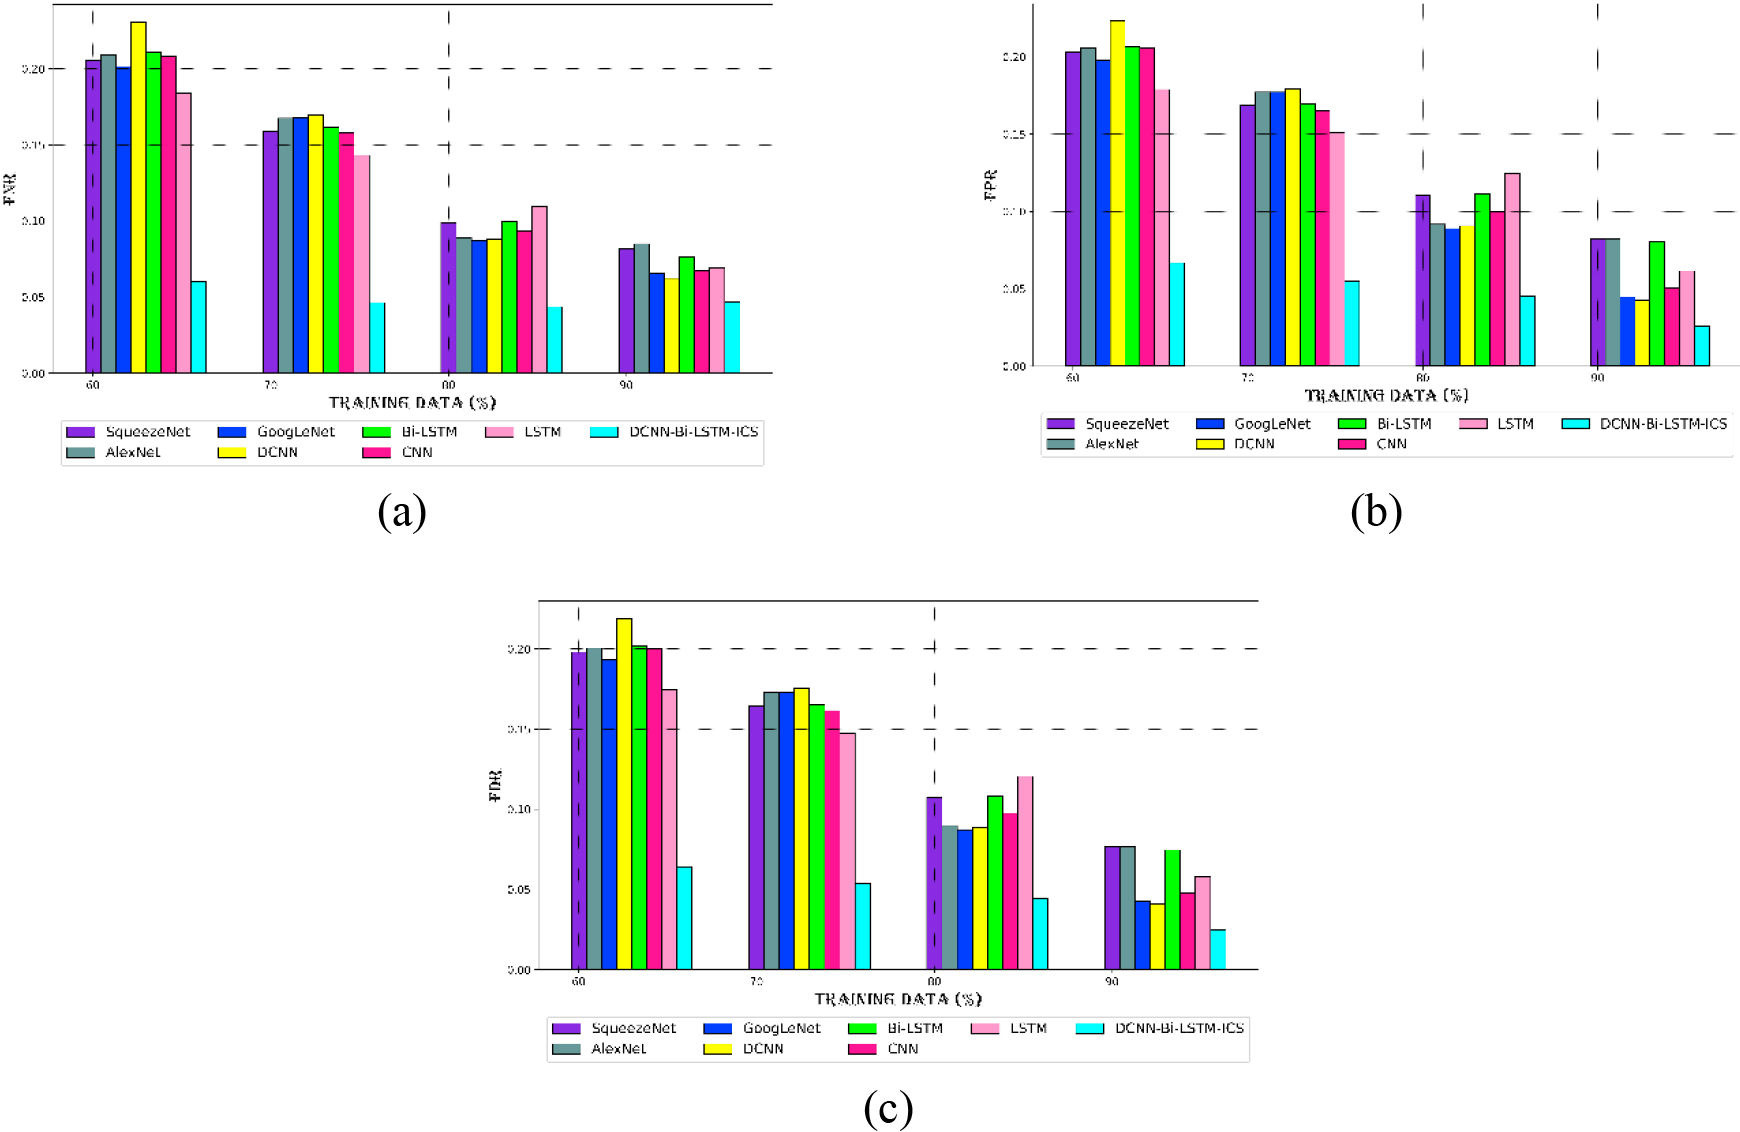
Comparing the new technique’s performance to current techniques for (a) FNR, (b) FPR, and (c) FDR for dataset 2.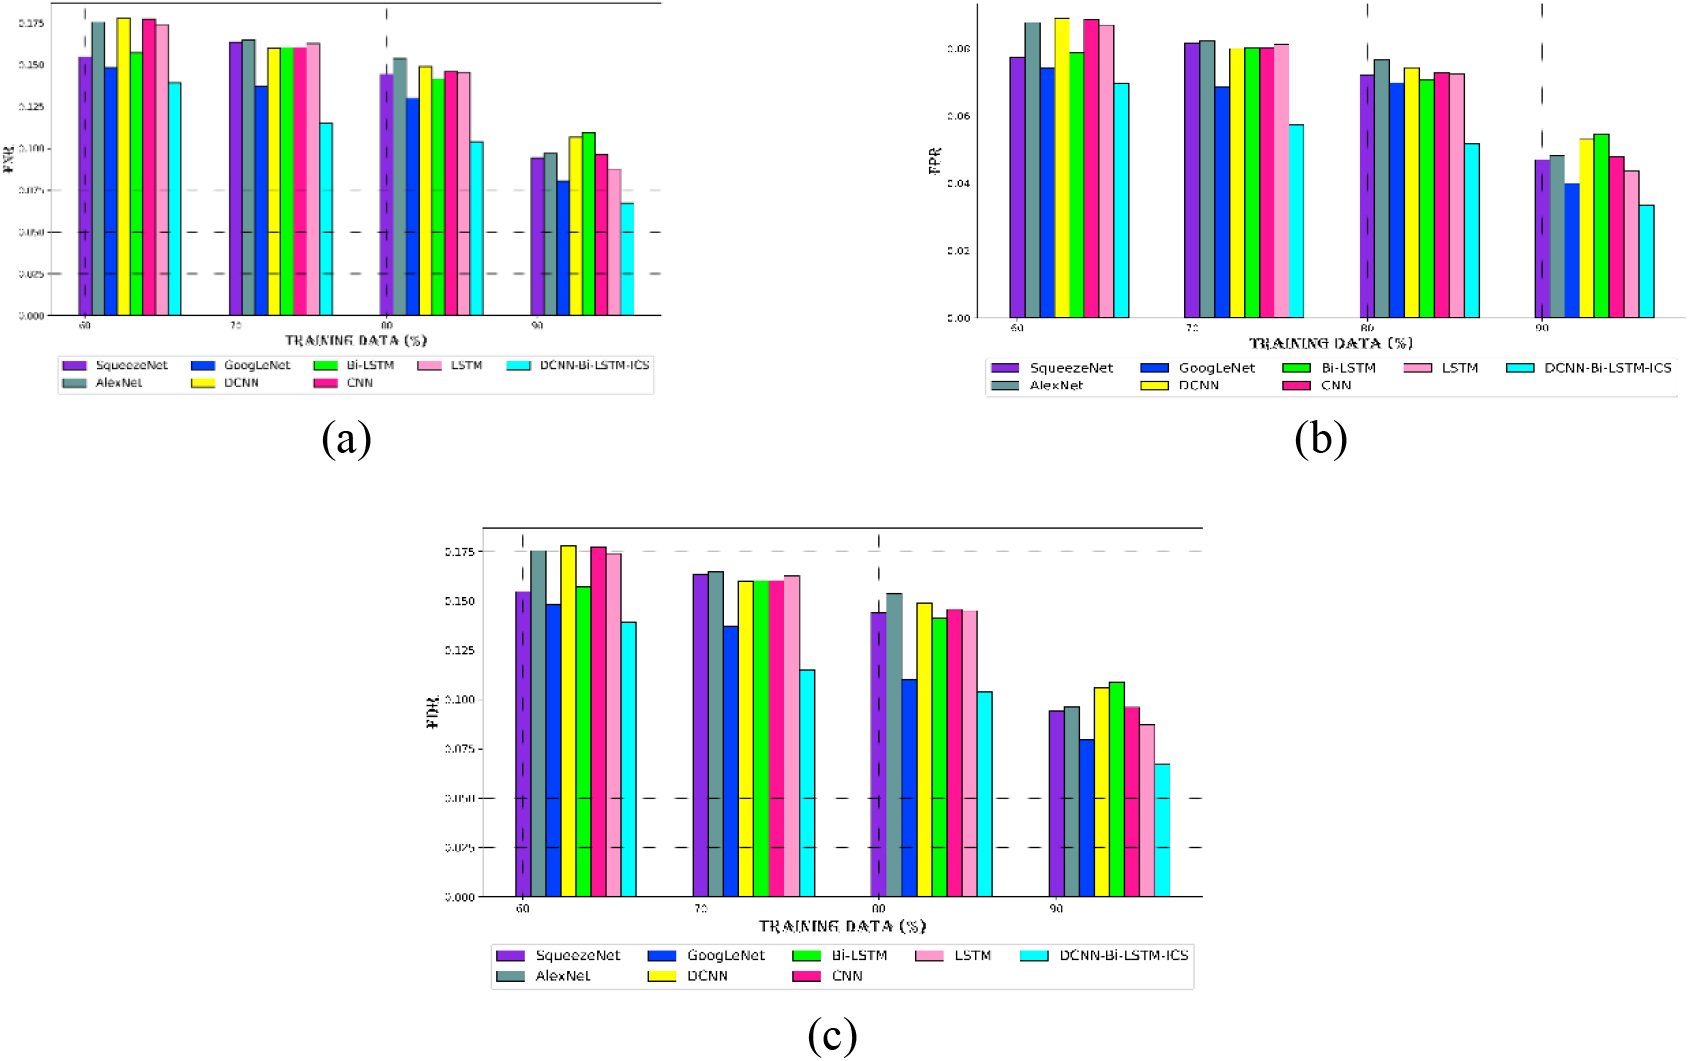
Experimental setup
The DCNN-Bi-LSTM-ICS model for cyber-attack classification was implemented in Python using a 16 GB RAM Intel i5 CPU. The Device name is DESKTOP-344S3TO, and the Processor used is 11th Gen Intel(R) Core(TM) i5-1135G7 @ 2.40 GHz 2.42 GHz. The Installed RAM is 16.0 GB (15.7 GB usable) and the System type is 64-bit operating system, x64-based processor Pen and touch. The DCNN-Bi-LSTM-ICS model makes use of the NSL-KDD [29] and CSE-CIC-IDS2018 [30] datasets. Conventional methods including SqueezeNet, GoogLeNet, DCNN, Bi-LSTM, CNN [31] and LSTM [32] are compared with the DCNN-Bi-LSTM-ICS model. The final results of the DCNN-Bi-LSTM-ICS algorithms for datasets 1 and 2 have been successfully validated.
Dataset description
Dataset 1: Compared to the original KDD data collection, the NSL-KDD data set has a number of benefits. By removing duplicate entries from the train set, bias towards more frequent records is avoided. Additionally, the suggested test sets don’t contain duplicate records, guaranteeing that approaches with higher detection rates won’t affect learners’ results. The number of selected records from each difficulty level group and the original KDD data set have an inverse relationship, which allows for a wider range of classification rates for different machine learning algorithms. Adequate data in the training and test sets ensures that evaluation results are consistent and comparable across different studies.
Dataset 2: The academic intrusion detection dataset CSE-CIC-IDS2018, authored by Drs. Iman Sharafaldin, Arash Habibi Lashkari, and Ali Ghorbani were made available by the Canadian Institute for Cybersecurity. This is the upgrade from CIC-IDS2017, and it has a much higher representation of ’Infiltration’ traffic. After being created with AWS, the dataset was cleaned into parquet files to make sure all data types were set appropriately. The clean version has baseline classification scores using straightforward models and no missing or duplicate entries.
Comparative analysis
The DCNN-Bi-LSTM-ICS model is compared with conventional methods such as SqueezeNet, GoogLeNet, DCNN, Bi-LSTM, CNN, and LSTM to detect cyberattacks. For comparison, both positive and negative criteria are employed. Positive metrics include things like accuracy, sensitivity, specificity, and precision; negative measures include things like FNR, FPR, and FDR. The analysis also includes other metrics like NPV, F-measure, and MCC in addition to these variables. The ability of the DCNN-Bi-LSTM-ICS model to recognize and classify cyberattacks is assessed taking into account each of these variables.
Analyzing positive indicators for dataset 1 and dataset 2
For Datasets 1 and 2, the proposed model’s sensitivity, specificity, accuracy, and precision are evaluated in order to create an intelligent cyberattack detection model. Figure 4 presents the analysis of the DCNN-Bi-LSTM-ICS model for dataset 1 and compares it to other techniques including SqueezeNet, GoogLeNet, DCNN, Bi-LSTM, CNN, and LSTM. As seen in Fig. 4a, the DCNN-Bi-LSTM-ICS model’s accuracy level is higher than that of other conventional techniques. The DCNN-Bi-LSTM-ICS model’s detection procedure makes use of DCNN and Bi-LSTM, which improves the prediction accuracy of the model. With accuracy rates of 93%, 94%, 95%, and 96%, the DCNN-Bi-LSTM-ICS model surpasses all conventional approaches at different learning percentages (60, 70, 80, and 90). The DCNN-Bi-LSTM-ICS model achieves 97% precision at a learning percentage of 90, while other standard strategies produce a precision of less than 95%. The sensitivity and Specificity of the DCNN-Bi-LSTM-ICS model at the 80th learning percentage is 95% for both, which is 5% higher than conventional techniques. DCNN-Bi-LSTM-ICS model for dataset 1 performs better than all traditional techniques in cyber-attack detection.
The proposed model is also compared with the conventional approach for dataset 2. Similar to Dataset 1, the DCNN-Bi-LSTM-ICS model outperforms conventional methods for Dataset 2. A visual depiction of the comparison for dataset 2 is shown in Fig. 5. At a leaning percentage of 60, the DCNN-Bi-LSTM-ICS model achieves 90% accuracy, whereas other methods only reach 89%. For dataset 2, the DCNN-Bi-LSTM-ICS method obtains 89% sensitivity at a LP of 80, outperforming the traditional methods. Compared to the subpar precision of earlier models, which were at 91% at a learning percentage of 90, 93% precision is achieved. The model benefits from improved data unbalancing at the pre-processing step in the feature extraction and selection processes. Ultimately, the hybridization of DCNN and Bi-LSTM results in a prediction that is more accurate. The DCNN-Bi-LSTM-ICS model performs better than the previous models as a result.
Analyzing negative indicators for dataset 1 and dataset 2
Apart from positive measures, the possibility of errors in the DCNN-Bi-LSTM-ICS model for epileptic seizure prediction is investigated through negative metrics. Figures 6 and 7 display the error occurrence possibility value of the DCNN-Bi-LSTM-ICS model for cyberattack categorization. As seen in Fig. 6, the DCNN-Bi-LSTM-ICS model’s error occurrence for Dataset 1 is extremely low. Its FNR, FPR, and FDR values are also quite low when evaluated over existing methods. The suggested method chooses the right characteristics required for classification by using enhanced chi-square processing for feature selection. Compared to the traditional model, this improves the prediction’s accuracy. Figure 6a shows that at LP 60, the FNR, FPR, and FDR for the DCNN-Bi-LSTM-ICS model are 0.060, 0.066, and 0.064, respectively. At learning percentage 90, the errors progressively decreased to 0.04 for FNR, 0.02 for FPR, and 0.02 for FDR. Figure 6 shows that the other existing method has a bigger inaccuracy at different learning percentages of 60 to 90.
Figure 7 presents the DCNN-Bi-LSTM-ICS model’s error analysis using conventional approaches for dataset 2. As shown in Fig. 7a–c, the DCNN-Bi-LSTM-ICS model has a lower error value, even for dataset 2. Specifically, the FNR achieved for dataset 2 at learning % 90 is 0.04 for the DCNN-Bi-LSTM-ICS model, whereas the prior techniques yielded FNR values greater than 0.06. The DCNN-Bi-LSTM-ICS model yielded FPR and FDR values of 0.04 at a learning percentage of 80, indicating a 5% reduction in error compared to the standard procedures. Because the DCNN-Bi-LSTM-ICS model has less inaccuracy than the previous methods, it can be clearly seen from the analysis of datasets 1 and 2 that it will be more accurate. Consequently, the DCNN-Bi-LSTM-ICS model exhibits improved performance and reduced error in cyber-attack classification.
Analyzing some additional indicators for dataset 1 and dataset 2
We also use NPV, F-measure, and MCC assessments to analyze the cyber-attack categorization performance of the DCNN-Bi-LSTM-ICS model. For datasets 1 and 2, the proposed model is compared with conventional techniques as SqueezeNet, GoogLeNet, DCNN, Bi-LSTM, CNN, and LSTM. Figures 8 and 9 exhibit the analytical representation graphically. The DCNN-Bi-LSTM-ICS model’s NPV, F-measure, and MCC scores for dataset 1 are displayed in Fig. 8. With 90% learning percentage, the suggested model produced NPV of 95%, F-measure of 96%, and MCC of 92% for dataset 1. Figure 8a demonstrates that the NPV of the DCNN-Bi-LSTM-ICS model ranges from 93% to 95% for learning percentages of 60 to 90, whereas competing techniques have lower NPVs in comparison. The DCNN-Bi-LSTM-ICS model obtains its greatest performance when compared to conventional methods since it uses DCNN and Bi-LSTM to help the Intelligent model for cyber-attack categorization.
Evaluation of the DCNN-Bi-LSTM-ICS technique with current schemes for dataset 1 (a) NPV, (b) F-measure, and (c) MCC.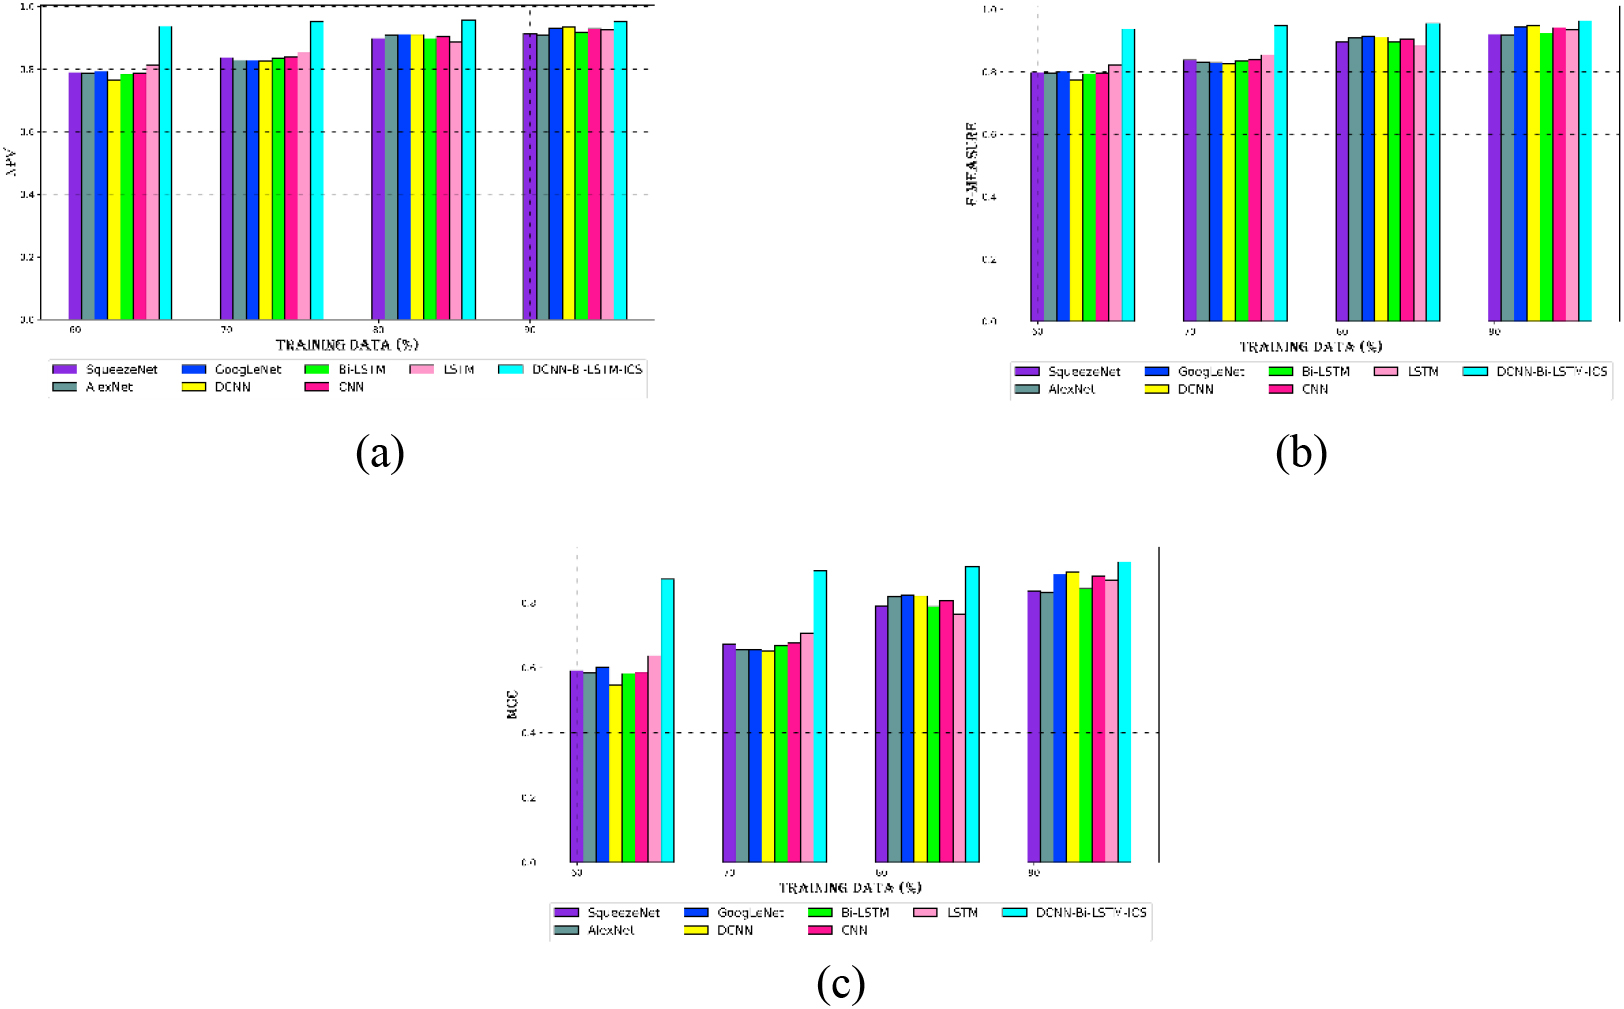
Figure 9 presents a performance comparison between the created strategy and the existing methodologies for NPV, F-measure, and MCC for dataset 2. The net present value (NPV) of the DCNN-Bi-LSTM-ICS model for dataset 2 is 96% at the 90th learning percentage, surpassing the NPV for dataset 1 and other conventional techniques. Compared to other conventional approaches, the DCNN-Bi-LSTM-ICS model for dataset 2 has a higher MCC and F-measure, with an MCC of 84% and an F-measure of 89% at learning percentage 80. The F-measure and MCC demonstrate that the DCNN-Bi-LSTM-ICS model outperforms the conventional approach by a substantial margin, performing 5% better than the current methods. At a learning percentage of 90, the DCNN-Bi-LSTM-ICS model for dataset 2 has an NPV of 96%, an F-measure of 93%, and an MCC of 89%. In terms of cyberattack classification, the DCNN-Bi-LSTM-ICS model outperforms earlier techniques evaluated for all LPs.
Ablation study of the DCNN-Bi-LSTM-ICS method for dataset 1
Performance comparison of the DCNN-Bi-LSTM-ICS technique with current schemes for dataset 2’s (a) NPV, (b) F-measure, and (c) MCC.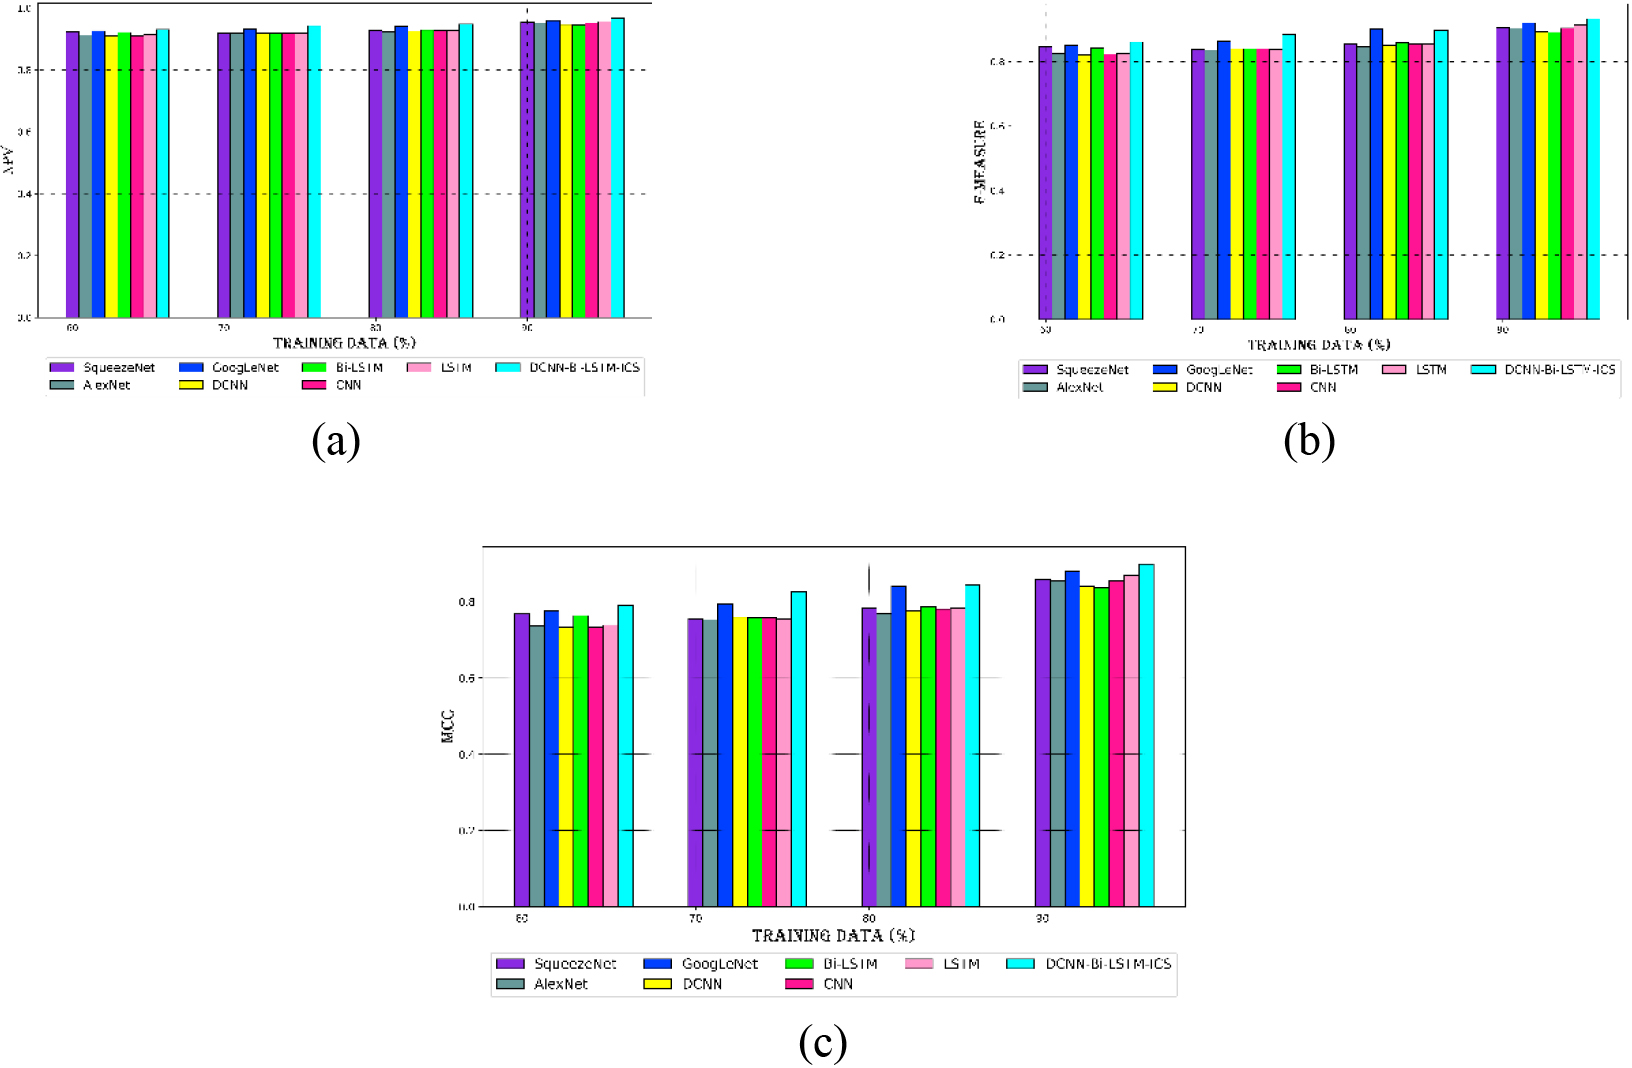
The performance of the proposed scheme is evaluated through the use of Improved chi-square processing, Holoentropy, and Improved data imbalance processing. The ablation study and analysis results for Datasets 1 and 2 are described in Tables 1 and 2.
Ablation study for datasets 1 and 2
The DCNN-Bi-LSTM-ICS model performs better than the model built using traditional methods. An enhanced data balancing approach is used to preprocess Mutual Information, and statistical features for the DCNN-Bi-LSTM-ICS model are obtained from the preprocessed data. A feature extraction method based on Holoentropy is employed in the DCNN-Bi-LSTM-ICS model. Then, to precisely classify cyberattacks, a hybrid DCNN and Bi-LSTM classifier is used. The ablation analysis of the proposed method for datasets 1 and 2 is presented in Tables 1 and 2. Table 1 shows that the DCNN-Bi-LSTM-ICS method outperforms the model utilizing the standard SMOTE, conventional Chi-Square, and conventional Holoentropy processes. The DCNN-Bi-LSTM-ICS model achieves 96% accuracy, which is 4% greater accuracy than the usual techniques. With a little 0.04 FNR error value, the DCNN-Bi-LSTM-ICS technique outperforms the standard SMOTE, conventional Holoentropy, and conventional Chi-Square model, which has 7% greater error. When evaluated over precision of the DCNN-Bi-LSTM-ICS model with that of dataset 1, the DCNN-Bi-LSTM-ICS model performs better – its precision value is 97% – than the conventional approaches, which is roughly 10% less accurate than the DCNN-Bi-LSTM-ICS model.
Table 2 displays the results of the DCNN-Bi-LSTM-ICS method’s ablation research for dataset 2. Compared to the model using standard SMOTE, Holoentropy, and Chi-Square, the DCNN-Bi-LSTM-ICS technique achieves 95% accuracy, which is 3% greater. The DCNN-Bi-LSTM-ICS model offers accurate cyber-attack categorization with 93% precision compared to 88% precision for all models using conventional methodologies. The model’s error occurrence for dataset 2 is similarly incredibly low, given that the FPR, FDR, and FNR of the DCNN-Bi-LSTM-ICS model are all much lower than those of conventional approaches, at 0.03, 0.06, and 0.06, respectively. For datasets 1 and 2, the ablation examination of the DCNN-Bi-LSTM-ICS technique shows that the DCNN-Bi-LSTM-ICS model performs better in cyber-attack classification than the conventional approach.
Ablation analysis of the DCNN-Bi-LSTM-ICS model for dataset 2
Ablation analysis of the DCNN-Bi-LSTM-ICS model for dataset 2
A machine learning technique called K-fold cross-validation splits a dataset into K folds, each of which is utilized for training and validation. K-1 folds are used for training and the remaining fold is used for validation during the K
K-fold cross-validation for dataset 1.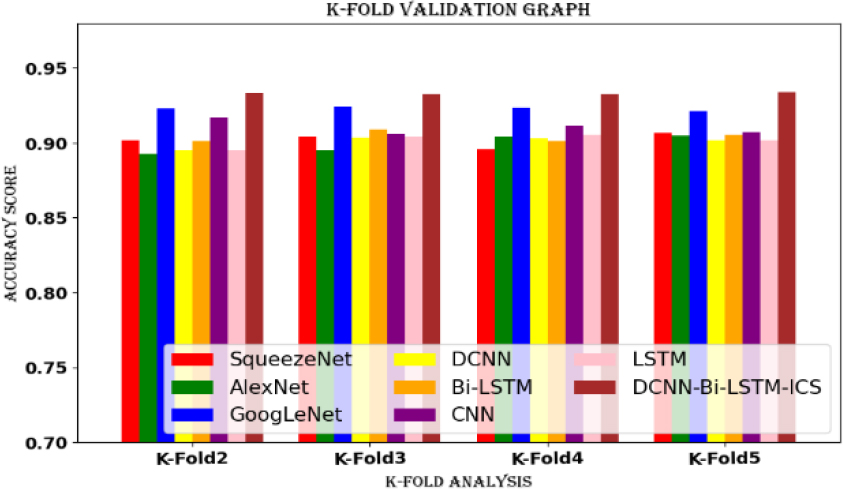
K-fold cross-validation for dataset 2.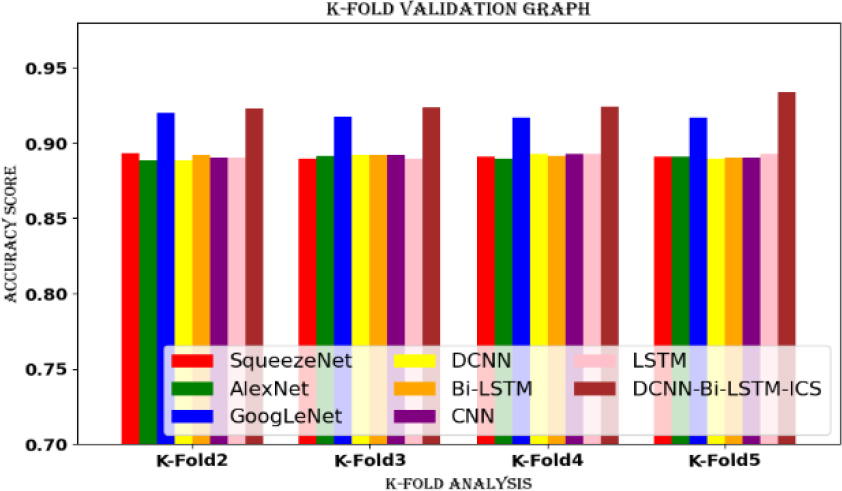
Figures 12 and 13 display the AUC and ROC analysis of the DCNN-Bi-LSTM-ICS model compared to traditional methodologies for datasets 1 and 2. The true positive rate or false positive rate in the cyberattack categorization prediction is determined using AUC & ROC analysis. The data shown in Fig. 12 indicates that the DCNN-Bi-LSTM-ICS model for Dataset 1 outperforms other standard models like SqueezeNet, GoogLeNet, DCNN, Bi-LSTM, CNN, and LSTM. The Ash line is used to indicate the DCNN-Bi-LSTM-ICS model. The suggested model achieves the maximum true positive rate of 0.95. TPR values smaller than 0.8 are obtained using other traditional techniques, which is in line with the DCNN-Bi-LSTM-ICS model. The AUC and ROC analysis of dataset 2’s DCNN-Bi-LSTM-ICS model is shown in Fig. 13, along with a comparison with the previous method. The DCNN-Bi-LSTM-ICS method even achieves the highest TPR value of 0.83 for dataset 2, whilst other traditional techniques only manage 0.82. A cyberattack can be classified as a false positive due to the lower TPR value of the conventional model. Thus, the suggested approach has a better chance of correctly classifying cyberattacks.
AUC & ROC analysis of DCNN-Bi-LSTM-ICS approach over traditional models for dataset 1.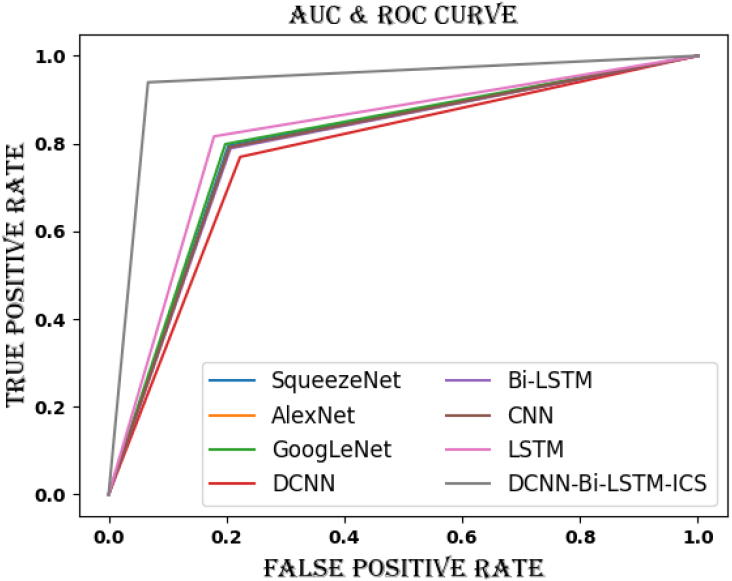
AUC & ROC evaluation of DCNN-Bi-LSTM-ICS approach over traditional models for dataset 2.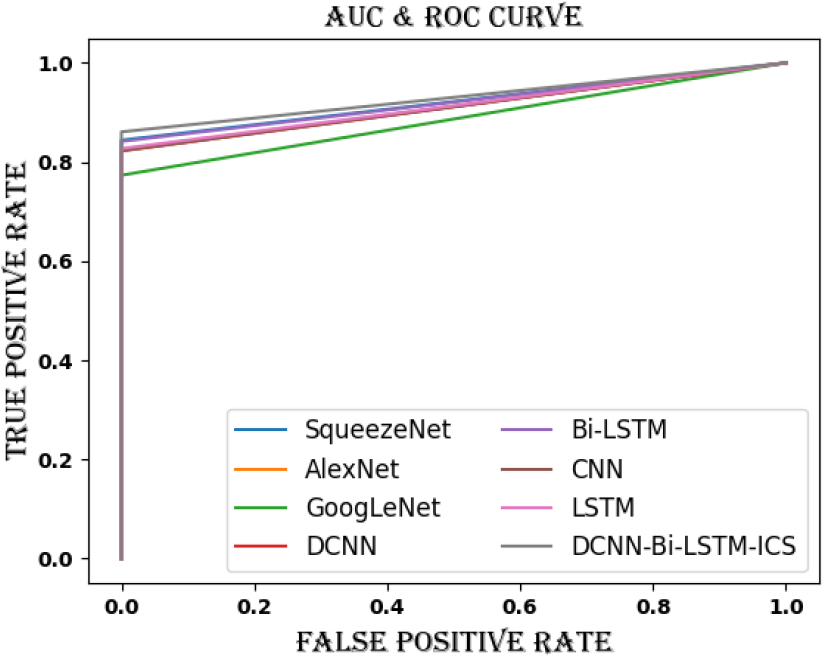
Non-parametric tests are mathematical procedures used in statistical hypothesis testing that do not assume anything about the frequency distribution of the variables to be evaluated. The non-parametric test’s analysis is displayed in Table 3. The non-parametric experiment is a collection of methods used when the data are skewed and does not depend on data from any particular distribution. These models are not parameter-free just because they are called non-parametric. The truth is that neither the parameters nor their quantity are set in stone; they are somewhat arbitrary. These models are hence referred to as distribution-free models. To determine if the data passes the normalcy test, Prism additionally used the conventional 0.05 cut-off. If the
Analysis of non-parametric test
Analysis of non-parametric test
Due to the recent progress in communication as well as information technologies, more amounts of corporate and sensitive data are exchanged continuously, which makes it vulnerable to attacks. The most crucial security mechanisms are named IDS, which can detect malicious activities. Considering that, a novel DCNN-Bi-LSTM-ICS was proposed in this work for cyber attack classification, which includes 5 working stages. Initially, the data from datasets was taken as input. Afterwards, an improved class imbalance balancing processing based on ISMOTE was conducted to pre-process the input data. The third stage has the extraction of improved holo-entropy-based, mutual information and statistical features. For proper feature selection, ICS was developed. Finally, a hybrid classifier which includes the parallel processing of both DCNN and Bi-LSTM classifiers was proposed for accurate classification. To get accurate classification outcomes, the result of these classifiers was averaged. The outcomes showed that the performance of DCNN-Bi-LSTM-ICS was superior to other approaches.