
Abstract
Background:
The majority of patients with Alzheimer’s disease (AD) exhibit amyloid-β (Aβ) deposits at the brain vasculature, a process referred to as cerebral amyloid angiopathy (CAA). In over 51% of AD cases, Aβ also accumulates in cortical capillaries, which is termed capillary CAA (capCAA). It has been postulated that the presence of capCAA in AD is a specific subtype of AD, although underlying mechanisms are not yet fully understood. Sphingolipids (SLs) are implicated in neurodegenerative disorders, including AD. However, to date it remains unknown whether alterations in the SL pathway are involved in capCAA pathogenesis and if these differ from AD.
Objective:
To determine whether AD cases with capCAA have an altered SL profile compared to AD cases without capCAA.
Methods:
Immunohistochemistry was performed to assess the expression and localization of ceramide, acid sphingomyelinase (ASM), and sphingosine-1-phosphate receptors (S1P1, S1P3). In addition, we determined the concentrations of S1P as well as different chain-lengths of ceramides using HPLC-MS/MS.
Results:
Immunohistochemical analysis revealed an altered expression of ceramide, ASM, and S1P receptors by reactive astrocytes and microglial cells specifically associated with capCAA. Moreover, a shift in the balance of ceramides with different chain-lengths and S1P content is observed in capCAA.
Conclusion:
Here we provide evidence of a deregulated SL balance in capCAA. The increased levels of ASM and ceramide in activated glia cells suggest that the SL pathway is involved in the neuroinflammatory response in capCAA pathogenesis. Future research is needed to elucidate the role of S1P in capCAA.
Keywords
INTRODUCTION
Alzheimer’s disease (AD) is a progressive neurodegenerative disorder, which is characterized by amyloid-β (Aβ) aggregates and neurofibrillary tangles (NFTs). Aβ is able to accumulate in the majority of AD patients in the cerebrovasculature, a process referred to as cerebral amyloid angiopathy (CAA) [1]. Two types of CAA can be distinguished based on the location of Aβ deposition. In CAA type 1, Aβ predominantly accumulates in cortical capillaries in addition to leptomeningeal and cortical arteries and arterioles and is therefore referred to as capillary CAA (capCAA), while in CAA type 2 Aβ depositions are restricted to predominantly the larger vessels and does not involve cortical capillaries [2]. In addition, capCAA is present in over 51% of AD cases and correlates with the severity of AD pathology, whereas for larger vessel CAA this association is not evident [3, 4]. However, the role of capCAA in the evolution of AD and the underlying mechanisms of amyloid depositions in cerebral blood microvessels and brain tissue remains poorly understood.
It has been postulated that capCAA is a specific subtype of AD defined not only by characteristic neuropathological features, but also by genotype specific associations [5]. Indeed, a clear genetic heterogeneity with regard to apolipoprotein E (ApoE) genotypes contributes to the distinction between the two types of CAA, where capCAA is significantly related to having one or two ApoE ɛ4 alleles [2]. Moreover, capCAA is implicated in promoting neuroinflammation and dementia in AD, whereas larger vessel CAA is not [6, 7]. Therefore, the pathological hallmarks of capCAA differ from larger vessel CAA, suggesting that capCAA is a distinct neuropathologic entity requiring differential treatment.
Recently, evidence was provided that alterations in the sphingolipid pathway are linked to the pathogenesis of neurodegenerative diseases, including AD [8–10]. Sphingolipids are ubiquitous lipid components of membranes that are metabolized to form signaling molecules that regulate numerous critical cell functions, including mediating an inflammatory response [11]. The metabolism of this class of lipids comprises a complex network of highly controlled pathways producing bioactive lipids that include ceramide, sphingosine, and sphingosine-1-phosphate (S1P) [12]. S1P is able to signal via a family of five specific G protein coupled receptors, named S1P1-5, or act inside a cell as a second messenger [13]. It has been suggested that the balance between the levels of ceramide and S1P determines whether a cell proliferates or dies [14].
In AD, postmortem studies have shown that AD pathology is associated with increased levels of ceramide [15]. Moreover, ceramide is able to stabilize β-secretase, which increases the cleavage of the amyloid-β protein precursor (AβPP), leading to the generation of Aβ peptides, which under pathological conditions induce a vicious cycle involving Aβ production, cellular stress, and ceramide accumulation [8]. However, the role of S1P is less known in the development and progression of AD [16]. Ways to control the balanced production of these bioactive but also potentially pathogenic lipids may therefore be a novel avenue in the treatment of AD.
The novel therapeutic agent FTY720 (Fingolimod), a S1P receptor modulator, is a sphingosine-related molecule exhibiting an immunomodulatory function, which has recently been approved as an oral treatment for relapsing-remitting multiple sclerosis [17]. Despite its agonistic action, FTY720 promotes internalization and degradation of the S1P receptors and consequent loss of S1P responsiveness, thereby resulting in functional antagonistic effects [18]. Various cells of the central nervous system express S1P receptors and data from experimental disease models of AD as well as cell culture models have shown that FTY720 administration is able to reduce both the production and the neurotoxicity of Aβ peptide [17]. These results suggest an important role for the S1P receptors in AD pathology, but to date insights into underlying mechanisms remainlacking.
Based on the implication that an disturbed sphingolipid balance may be causative for AD pathogenesis, and because of the pathological distinction between AD cases with and without capillary CAA, the goal of the present study was to determine whether AD cases that lack capCAA have a different sphingolipid metabolism compared to AD cases with capCAA. Because of the strong inflammatory response associated with capCAA, we investigated the expression of sphingolipids that are linked to the neuroinflammatory process.
Here we provide the first comprehensive analysis of the sphingolipid metabolism in capCAA by examining the cellular distribution of the enzymes involved in sphingomyelin metabolism and S1P receptors in well-characterized non-neurological controls, and in AD with, and without capCAA cases. Immunohistochemical analysis revealed an altered expression of acid sphingomyelinase (ASM), ceramide, and S1P receptors by reactive astrocytes and microglial cells associated with dyshoric changes in capCAA. Moreover, a shift in the balance of ceramides of different chain-lengths and S1P content is observed in capCAA, possibly favoringapoptosis.
MATERIALS AND METHODS
Postmortem human brain tissue
Postmortem human brain tissue was obtained from the Netherlands Brain Bank (NBB), Netherlands Institute for Neuroscience, Amsterdam and from Laboratorium Pathologie Oost-Nederland, Enschede, the Netherlands. For this study we selected occipital cortex of 10 AD patients with capCAA pathology, 6 AD cases without capCAA, and 5 age-matched non-demented controls without presence of AD pathology. CapCAA score was defined according to Love et al. [19]. Staging of AD pathology was evaluated according to the revised criteria of Braak and Braak and of CERAD [20–22]. All material has been collected from donors after written informed consent for brain autopsy and use of brain tissue and clinical information for research purposes. Age, gender, postmortem delay, Braak, CERAD, capCAA scores, and cause of death of all cases used in this study are listed in Table 1.
Summary of patients details
AD, Alzheimer’s disease; capCAA, capillary cerebral amyloid angiopathy; PMD, postmortem delay; CERAD, Consortium to Establish a Registry for Alzheimer’s Disease; F, female; M, male.
Immunohistochemistry
For immunohistochemical analysis, 5μm cryosections mounted on coated glass slides (Menzel Gläser Superfrost PLUS, Thermo Scientific, Braunschweig Germany), were air-dried and fixed in acetone for 10 min. Sections were incubated overnight at 4°C with primary antibodies against ASM, ceramide, S1P1, S1P3, human leukocyte antigen (HLA)-DR, glial fibrillary acidic protein (GFAP), and Aβ (Table 2). All antibodies were diluted in antibody diluent (Immunological, Duiven, the Netherlands). Subsequently, sections were incubated with Real EnVision HRP rabbit/mouse (Dako, Glostrup, Denmark) for 30 min. Peroxidase labeling was visualized using 3,3-diaminobenzidine (DAB) as chromogen (Dako, Glostrup, Denmark). Nuclei were counterstained with hematoxylin. Sections were dehydrated and mounted using Quick-D mounting medium (Klinipath B.V., Duiven, the Netherlands). Between all incubation steps, sections were washed with phosphate buffered saline (PBS, pH 7.4). Omission of the primary antibody (incubation with antibody diluent alone) served as technical negative control.
Primary antibodies
For colocalization studies, sections were incubated for 30 min with 10% normal goat serum. Subsequently, sections were incubated overnight at 4°C with primary antibodies as indicated in Table 2. Alexa 488 labeled goat anti-rabbit and goat anti-mouse (dilution 1 : 400, Life Technologies) were used to detect ASM and ceramide, respectively. LN3 was detected using Alexa 555 labeled goat anti-mouse (dilution 1 : 400, Life Technologies). Sections were incubated for 1 h with their specific secondary antibody. Finally, sections were stained with Hoechst (dilution 1 : 1000, Molecular Probes) to visualize cellular nuclei and mounted with Mowiol mounting medium. The representative images were taken with a Leica TCS SP8 confocal laser-scanning microscope (Leica SP8, DMI 6000, Mannheim, Germany), 63X oil objective.
Quantitative and correlation analysis
Quantitative and correlation analysis of the immunohistochemical levels of ASM, ceramide, S1P1, S1P3, GFAP, and HLA-DR was performed on the grey matter of the occipital cortex of control, AD, and capCAA cases. Of each case, four pictures spanning all cortical layers of the grey matter of the occipital cortex were taken. The area fraction of the DAB staining (% immunopositive area of total area) was quantified using Image J version 1.48.
Colocalization with amyloid deposition
Colocalization of immunoreactivity for ASM and ceramide with Aβ, was assessed using Congo Red to visualize amyloid fibrils. Cryosections (5μm) were air-dried and fixed in acetone for 10 min. Sections were incubated overnight at 4°C with primary antibodies against ASM, ceramide, S1P1, and S1P3 (Table 2). Subsequently, sections were incubated with Real EnVision HRP rabbit/mouse (Dako) for 30 min. DAB (Dako) was used as chromogen and nuclei were counterstained with hematoxylin. Subsequently, tissue sections were incubated in 70% ethanol followed by incubation for 20 min with 50 ml saturated NaCl solution (0.5 M NaCl in 80% ethanol) supplemented with 0.5 ml 1% NaOH solution. Afterwards, sections were transferred to saturated 50 ml 0.5% Congo Red (VWR internationaal, Leuven, Belgium) solutionsupplemented with 0.5 ml 1% NaOH solution and incubated for 20 min. Finally sections were rinsed twice with 100% ethanol, followed by xylene and mounted using Quick-D mounting medium. The Nuance™ spectral imaging system (CRi, Woburn, MA) was used for the analysis of double-stained sections. Spectral imaging data cubes were taken from 460–660 nm at 20 nm intervals and analyzed with the Nuance™ software. Spectral libraries of single-brown (DAB), single-red (CongoRed) and hematoxylin (blue) were obtained from control single stainings. The resulting library was applied to the stained sections and the different reaction products were then spectrally unmixed into individual black-and-white images, representing the localization of each of the reaction products, and reverted to fluorescence-like images composed of pseudo-colors using the Nuance™ software.
HPLC MS/MS analyses of ceramides and S1P
Ceramides of different chain-lengths and S1P were analyzed as previously described [23]. Frozen tissue samples were weighed and homogenized in cold purified Millipore water (MQ, 18.2 MrmOmegacm) from a Milli-Q® PF Plus system (Millipore B.V., Amsterdam, the Netherlands). Total lipids were extracted from brain samples by adding methanol (MeOH), containing CER17 : 0, Cer17 : 0/24 : 1, and S1P-D7 (400, 400, and 200 ng/mL methanol; Avanti Polar Lipids) as internal standard, and 10% TEA solution (trimethylamine (10/90, v/v) in MeOH/dichloromethane (DCM) (50/50, v/v)) to homogenized sample. Subsequently, MeOH/DCM (50/50, v/v) was added to this mixture. The sample was vortexed for 5 min and incubated on the roller bank for 30 min at 4°C. After incubation, samples were centrifuged at 14000×g for 30 min at 4°C. Supernatant was transferred to a fresh tube, dried under nitrogen and reconstituted in MeOH before liquid chromatography-tandem mass spectrometry (LC-MS/MS). Ceramides and S1P were identified by injecting 10μL sample in an Agilent 1200SL system (Agilent Technology) which is run through a Kinetex C8 column (2.1×10 mm, 2.6μm, Phenomenex, Maarssen, the Netherlands) at 30°C using a gradient, starting from 50% mobile phase A (MQ/MeOH (50/50, v/v) containing 1.5 mM ammonium formate and 0.1% formic acid) for 1 min, and is increased to 93% mobile phase B (100% MeOH containing 1 mM ammonium formate and 0.1% formic acid) at 7 min. Thereafter the column is flushed with 100% mobile phase B for 2 min. The flow rate is set at 0.25 ml/min and total run time is 13 min. The effluent is directed to an Agilent 6410 triple quadruple mass spectrometer and analyzed in positive ion mode following electrospray ionization. The MS/MS transitions of CER14 : 0, CER16 : 0, CER18 : 0, CER20 : 0, CER22 : 0, CER24 : 1, CER24 : 1, S1P and S1P-D7, 509 -> 264, 538 -> 264, 567 -> 264, 595 -> 264, 623 -> 264, 649 -> 264, 651 -> 264, 380 -> 264, and 384 -> 271 respectively, were quantified by taking the ratios of the integrated peaks.
Statistical analysis
Statistical analysis was performed using the non-parametric Kruskal-Wallis method with Bonferroni correction. Significance for the Kruskal-Wallis test was set at p<0.05 and by use of the Bonferroni correction the significance for the post-hoc Mann-Whitney U test between any of the three different comparisons was set at p<0.017.
Pearson correlation coefficient was calculated to evaluate the correlations between different variables.
RESULTS
ASM and ceramide expression is increased in capCAA
We first examined the expression of ASM and ceramide in the occipital cortex of non-demented age-matched controls, AD cases without capCAA, and AD cases with capCAA. Immunohistochemical analysis of the brain sections revealed that specifically microglia showed increased reactivity for ASM whereas only astrocytes revealed reactivity for ceramide (Fig. 1A). To support the correlation between increased immunoreactivity for ASM and ceramide in microglia and astrocytes respectively, we compared their immunoreactive levels with markers for microglia (HLA-DR) or astrocytes (GFAP). This analysis showed a significant correlation between the expression of ASM and HLA-DR (R2=0.65, p<0.0001), as well as for ceramide and GFAP (R2=0.84, p<0.0001) (Fig. 1B). Moreover, double immunofluorescent labeling confirmed the expression of ASM by microglia and ceramide by astrocytes (Fig. 2).
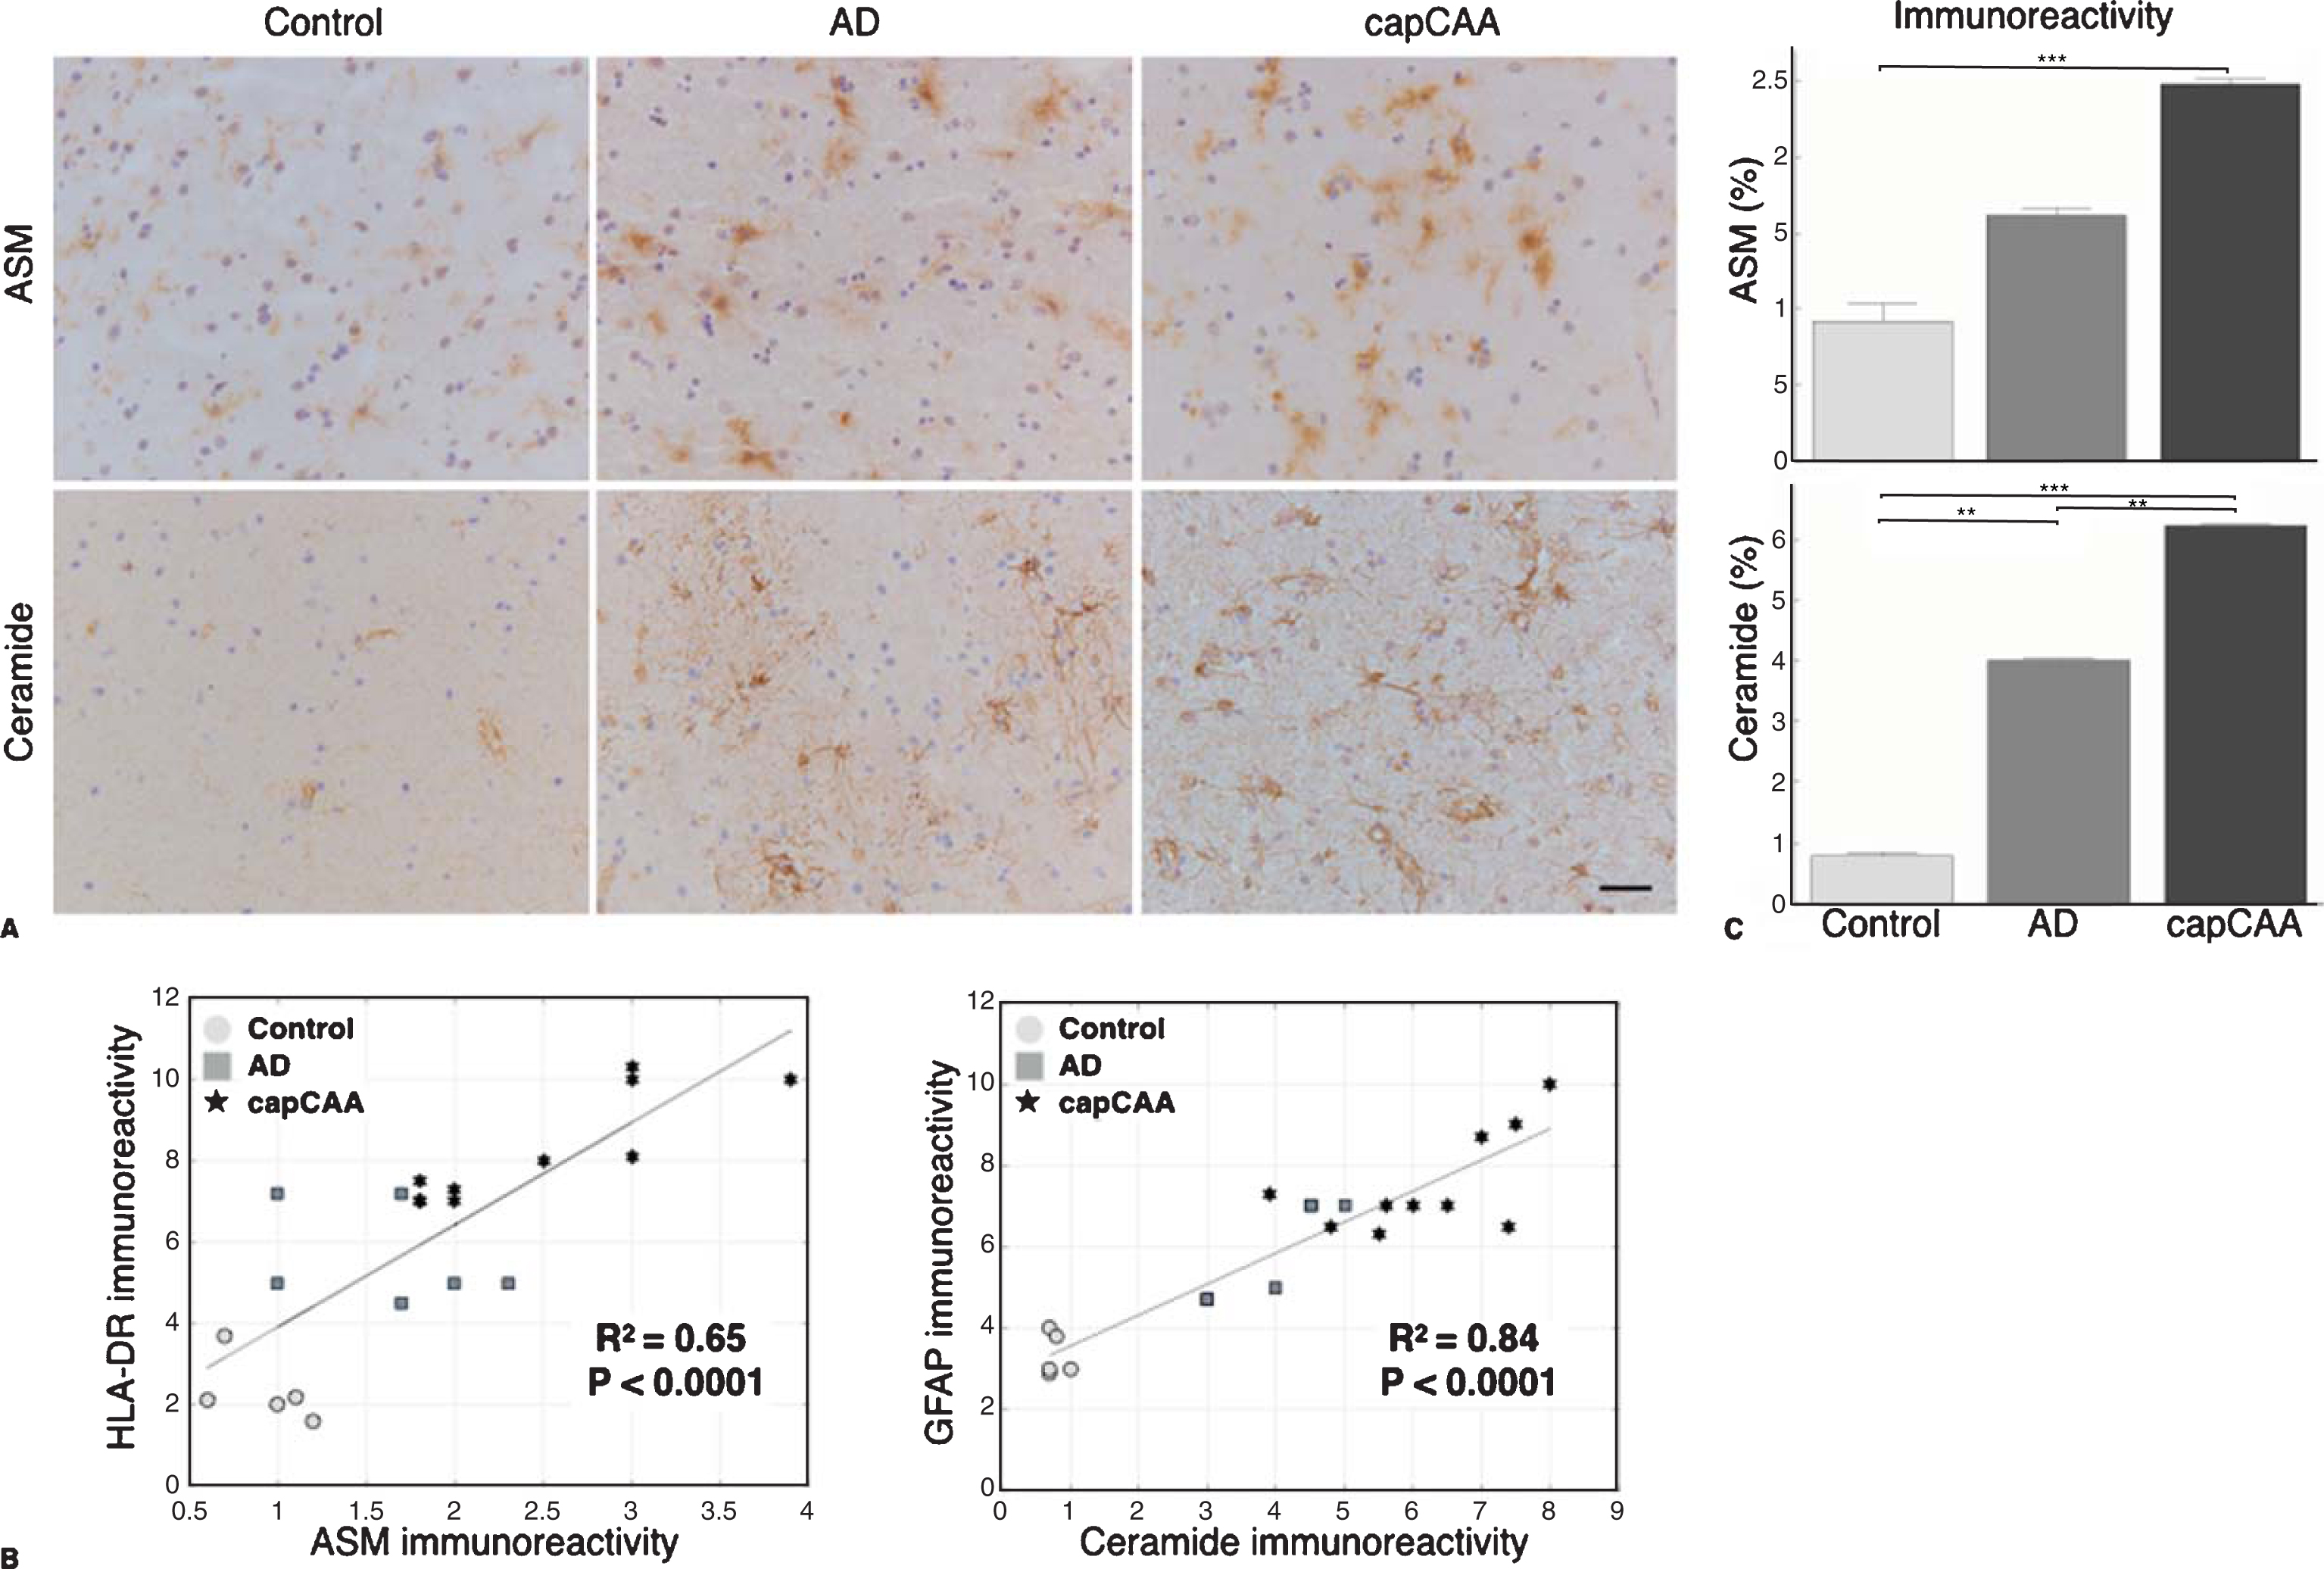
Increased expression of ASM and ceramide in capCAA. A) Immunohistochemical staining for ASM and ceramide in the occipital cortex of non-demented controls, AD, and capCAA. DAB (brown) was used as chromogen and hematoxylin (blue) was used for counterstaining of the nucleus. Bar: 50μm. B) Correlation analysis of the immunoreactivity levels of ASM and ceramide with microglia (HLA-DR) and astrocytes (GFAP), respectively. C) Quantitative analysis of the immunoreactive area for ASM and ceramide in capCAA (n=10), AD (n=6), and controls (n=5). The values represent the mean ± S.E.M. Statistical significance (Mann-Whitney U test, with Bonferroni correction) indicated with asterisks: **p<0.01, ***p<0.001.
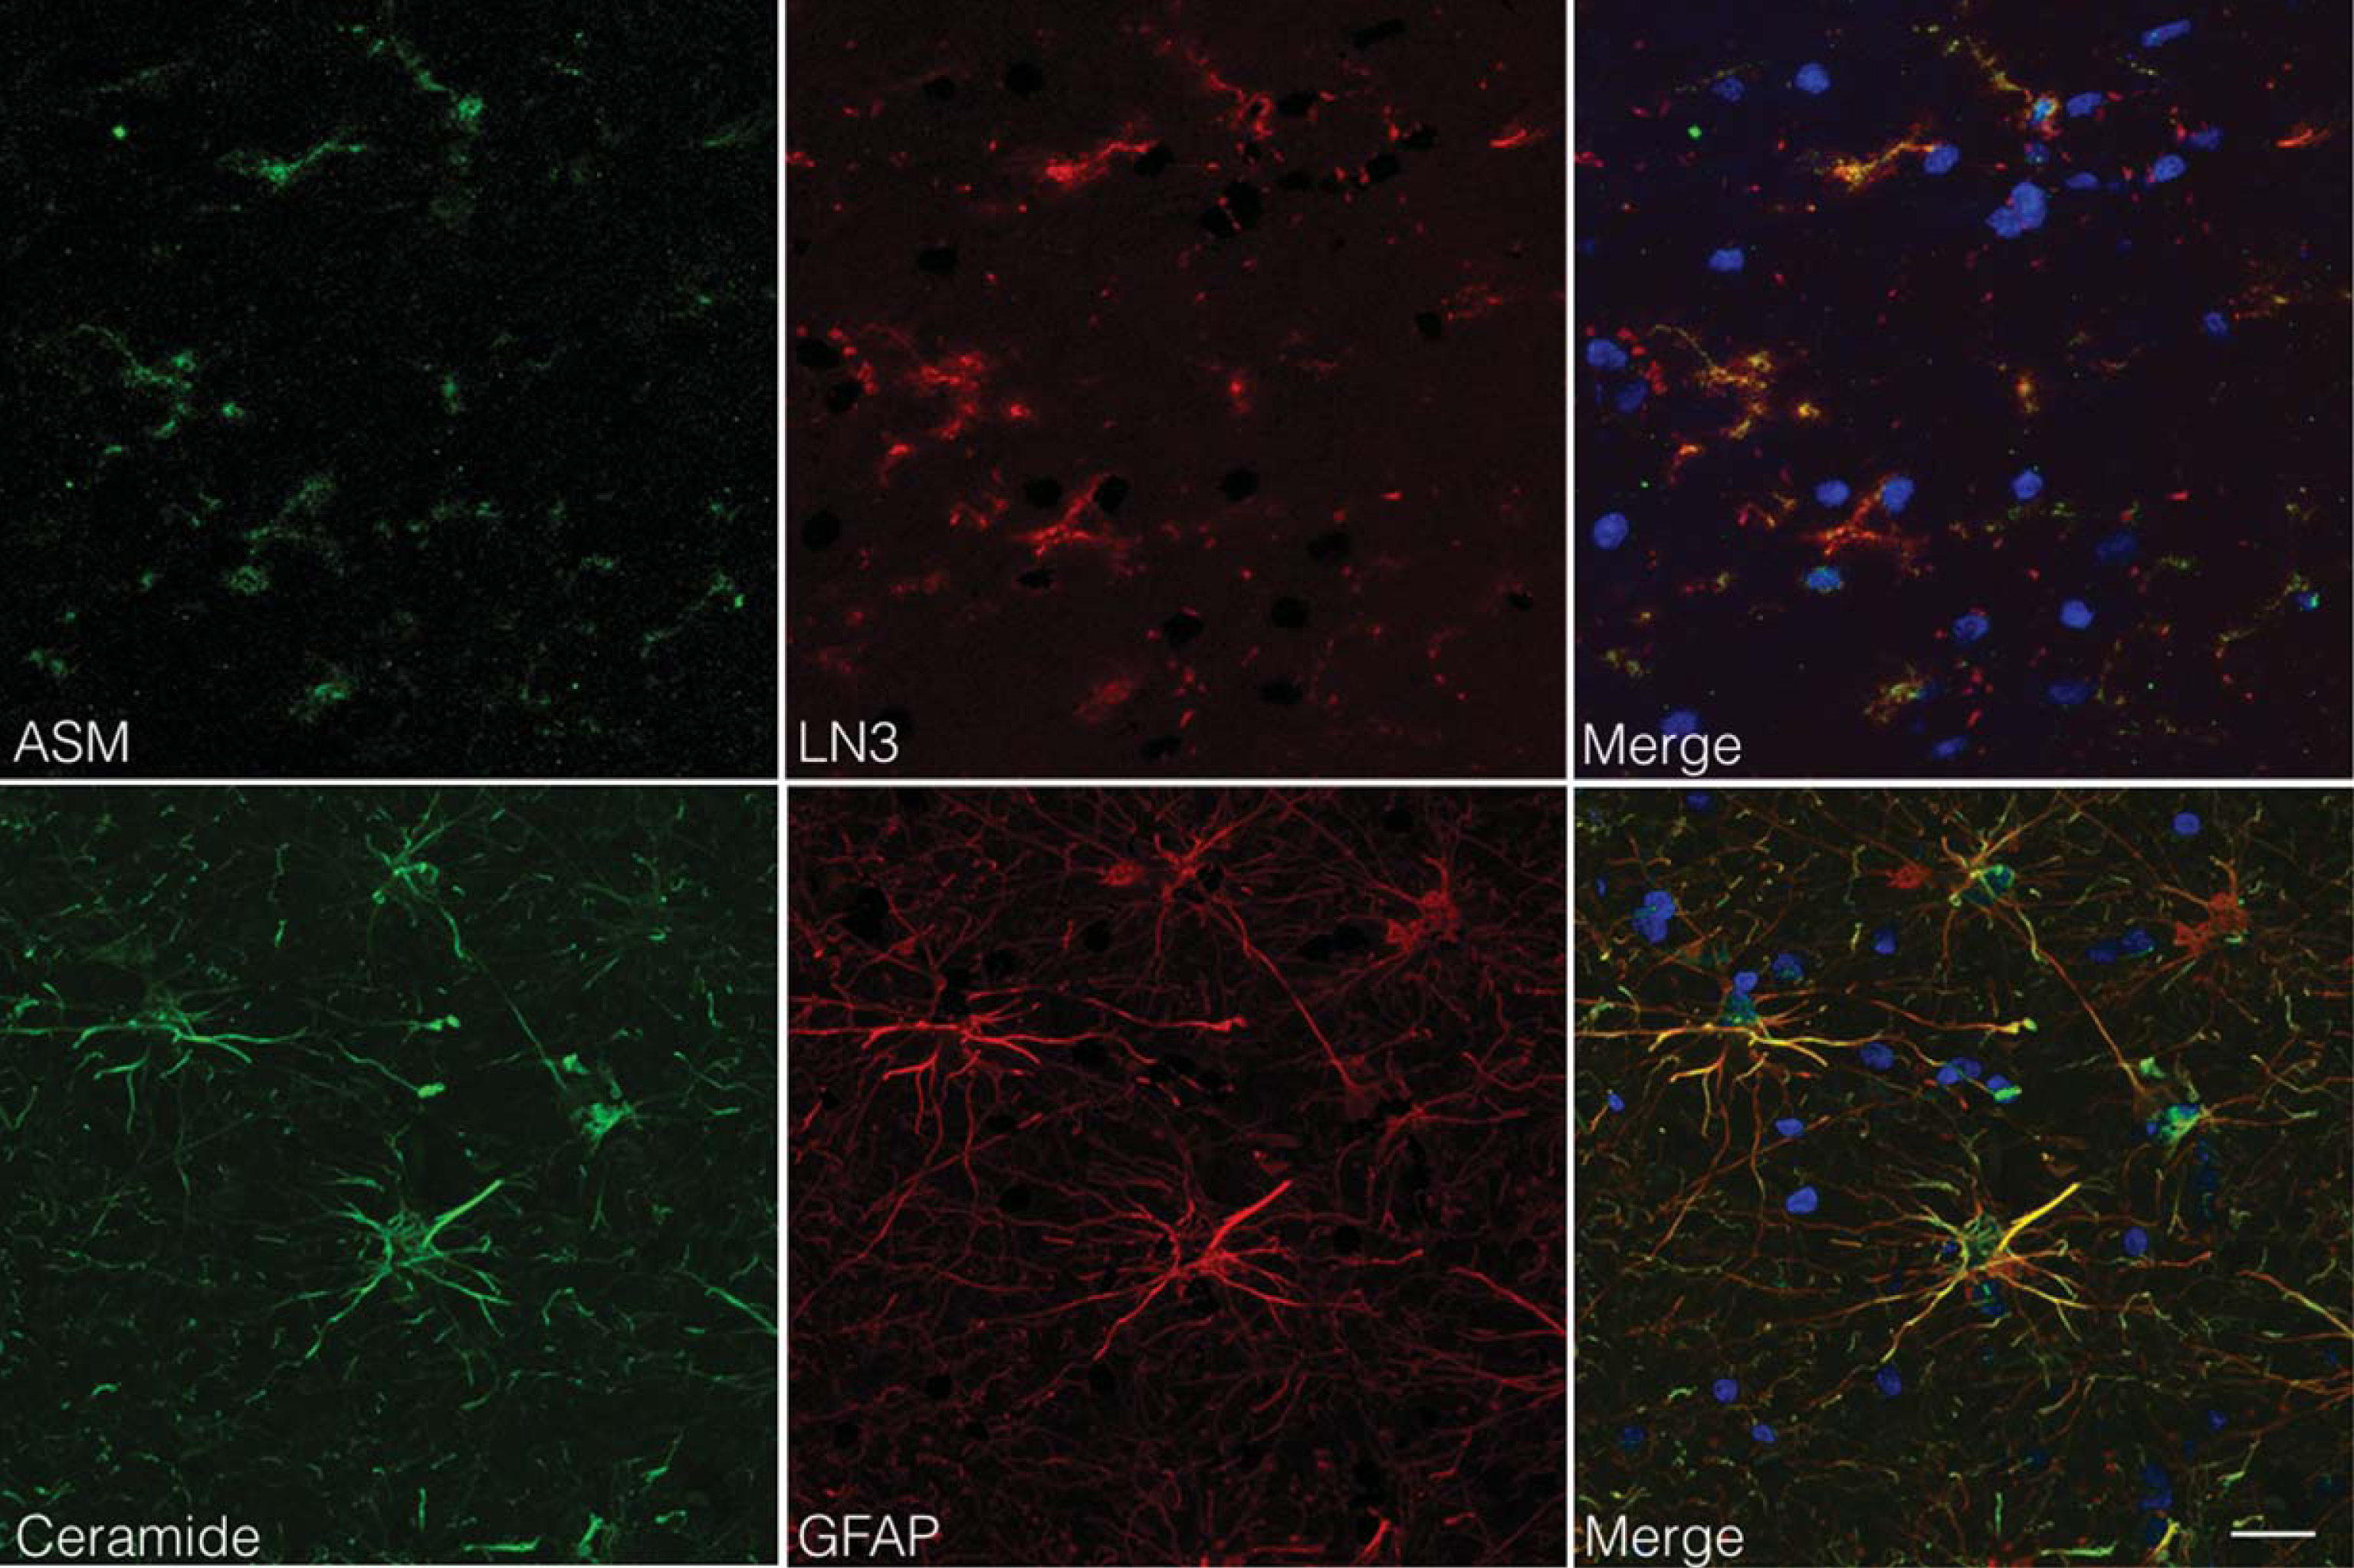
ASM and ceramide expression by microglia and astrocytes. Colocalization studies indicated that ASM expressing cells (green) were immunopositive for LN3 (red), indicative of MHC-class II positive cells (microglia; upper panel). In contrast, ceramide expressing cells (green) were immunopositive for GFAP (red), indicative of astrocytes (lower panel). Nuclei were counterstained with Hoechst (blue). Bar: 20μm
The quantification of ASM showed a significant difference between the three groups (Ctrl: 0.92%, AD: 1.62%, capCAA: 2.48%). However, only a significant increase was found in the percentage of the immunopositive area for ASM in capCAA pathology compared with non-demented controls (p<0.0006) (Fig. 1C). The quantification of ceramide reactivity also showed a significant difference between the three groups (Ctrl: 0.78%, AD: 4.40%, capCAA: 6.22%). Here, a significant increase was found in the percentage of the immunopositive area for ceramide for all three comparisons (ctrl versus AD, p<0.004; AD versus capCAA, p<0.004, and ctrl versus capCAA, p<0.0006) (Fig. 1C).
ASM and ceramide colocalize with amyloid deposits
To investigate whether the expression of ASM and ceramide is associated with Aβ deposits in either senile plaques or in capillaries, we performed a double labeling study using Congo Red to stain Aβ. Using this approach, we were able to distinguish areas of increased immunoreactivity for ASM in microglial cells around amyloid-laden capillaries in capCAA compared to microglia surrounding senile plaques in AD without capCAA (Fig. 3). In addition, we observed an accumulation of ceramide in reactive astrocytes surrounding amyloid-laden capillaries in cases with capCAA pathology compared to the immunoreactive levels in astrocytes associated with senile plaques in AD without capCAA (Fig. 3).
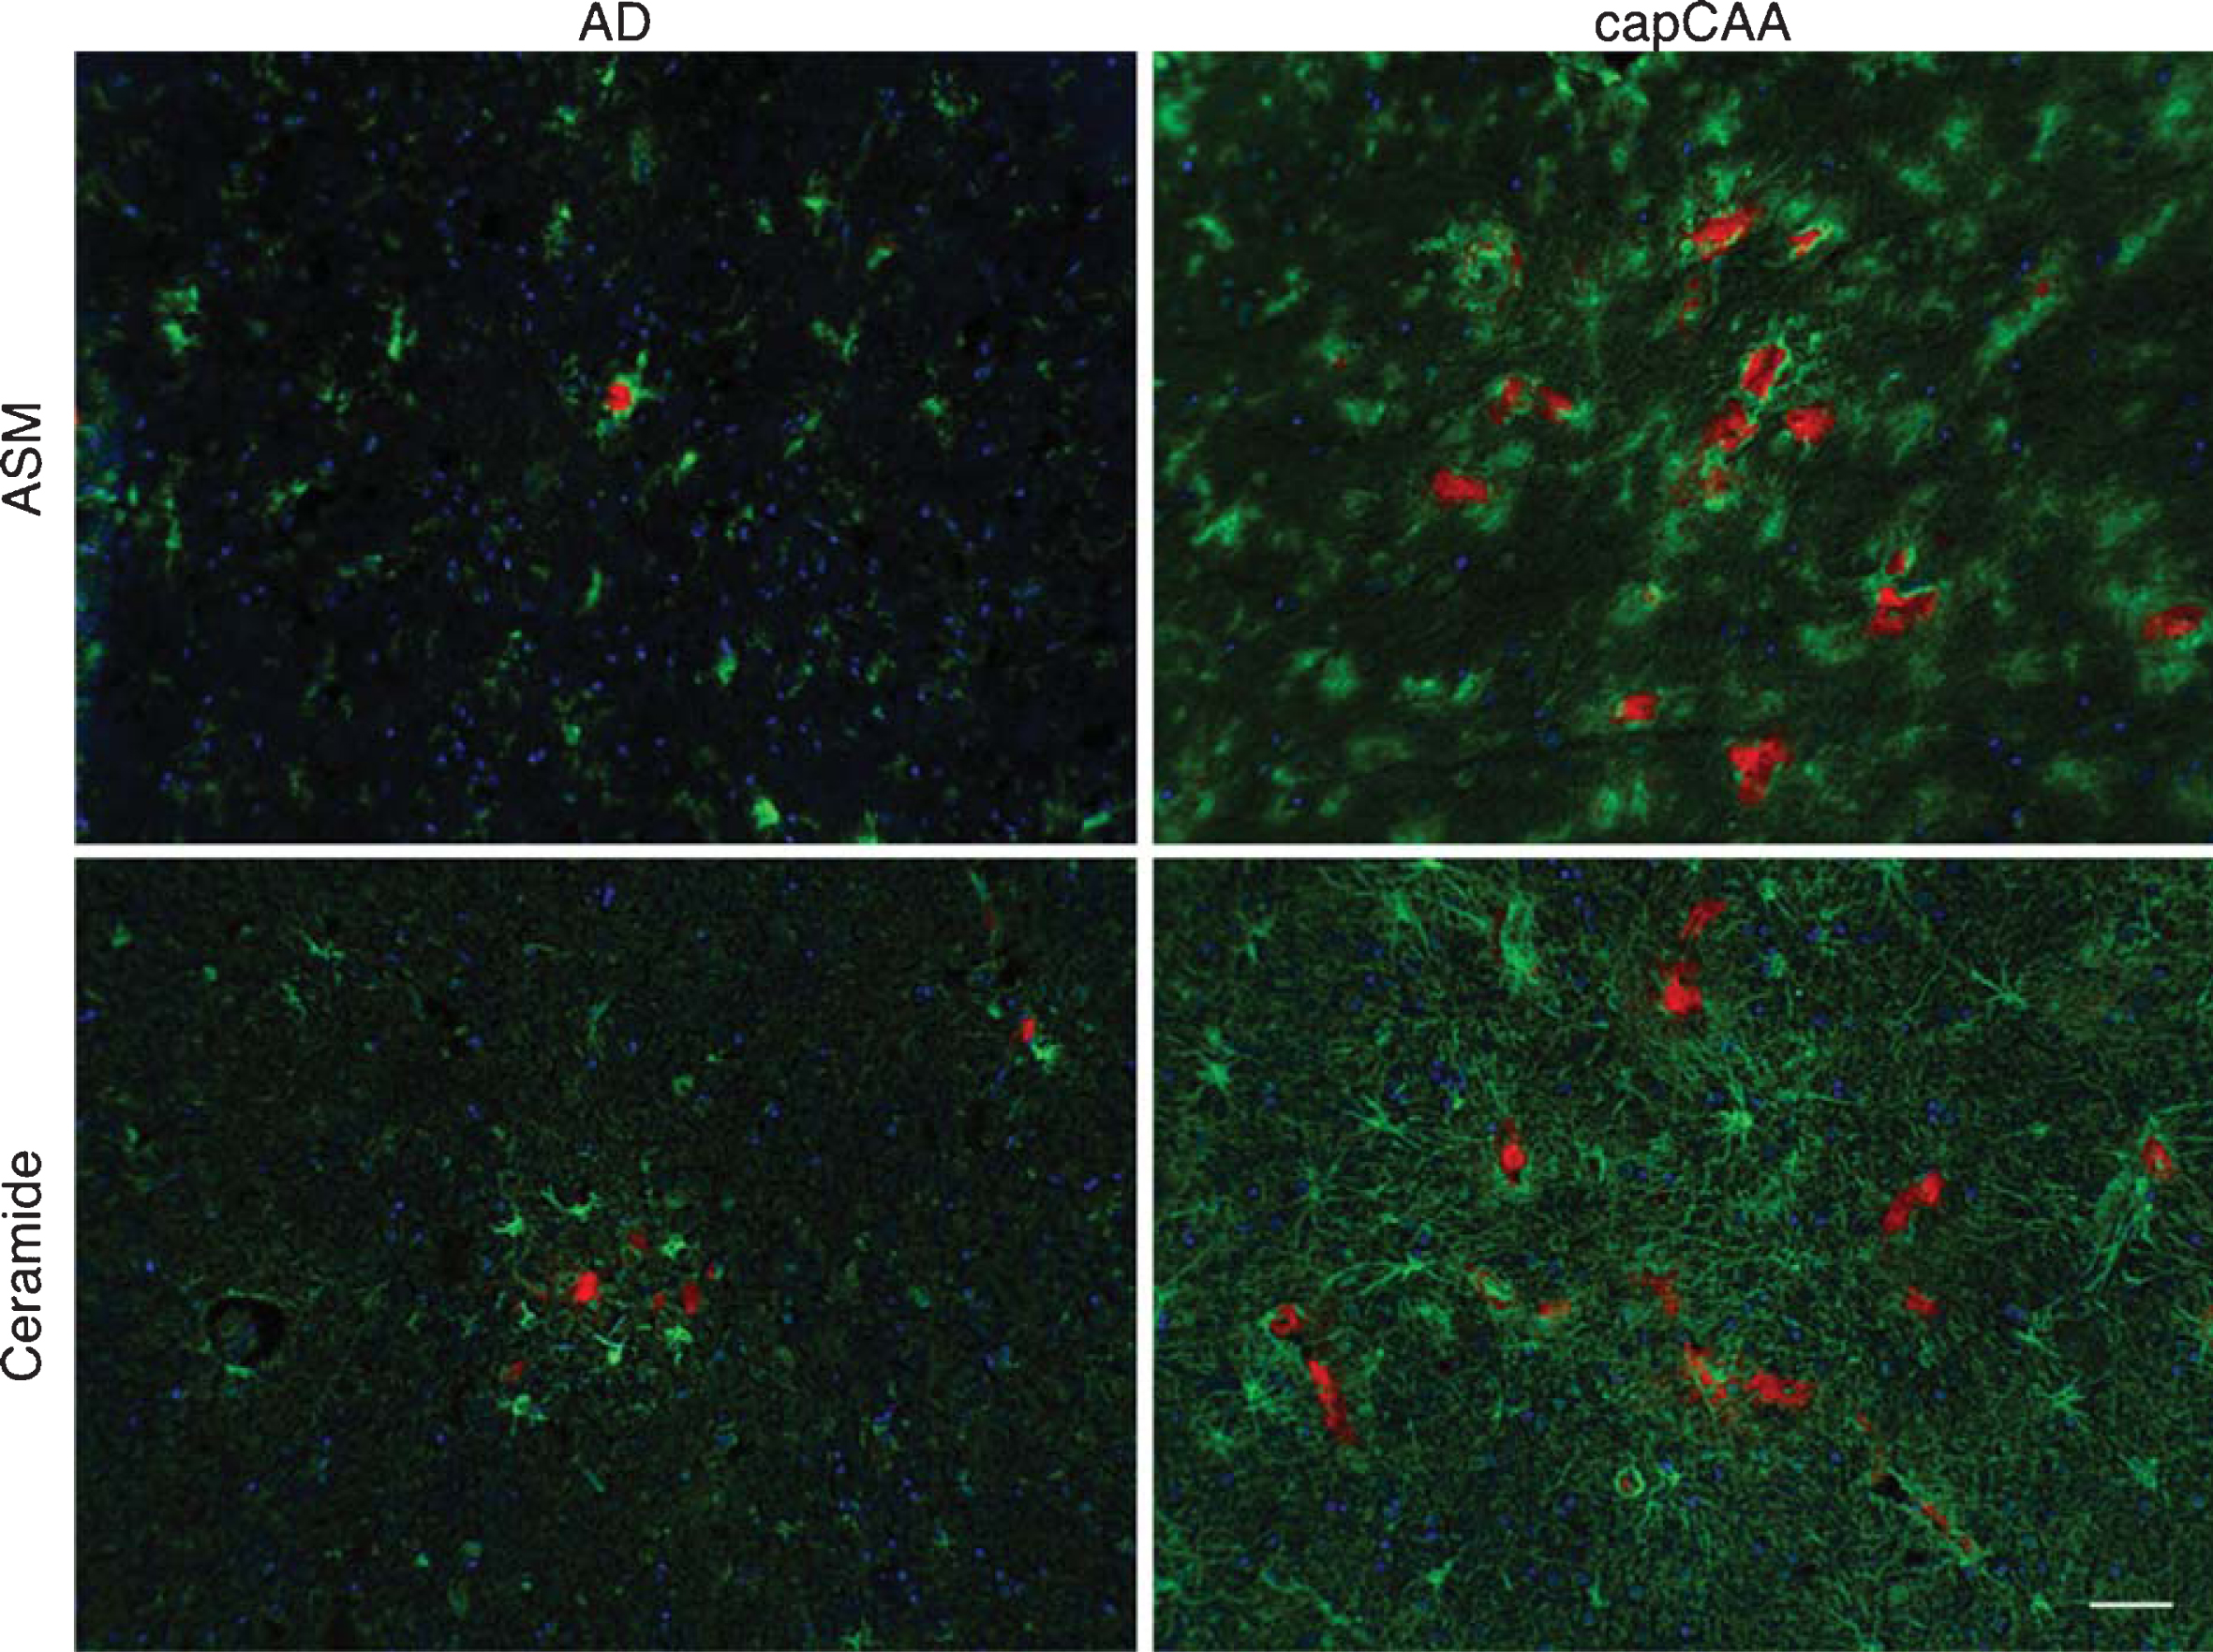
Colocalization of ASM and ceramide with amyloid in AD and capCAA cases. Double immunohistochemical staining was performed for ASM and ceramide (green) together with Congo Red for amyloid deposits (red) in AD cases and capCAA. Haematoxylin (blue) was used for counterstaining the nucleus. Bar: 50μm.
Altered ceramide and S1P content in capCAA
To gain more insight into the accumulation of ceramide in capCAA, we determined ceramide content using HPLC MS/MS (Fig. 4). A significant increase was found for CER22 : 0 (p<0.05), while a significant decrease was found for CER24 : 0 (p<0.05). Post-hoc tests for CER22 : 0 were not able to significantly discriminate the differences (p=0.03), while CER24 : 0 showed a significant decrease between control and capCAA (p<0.01).
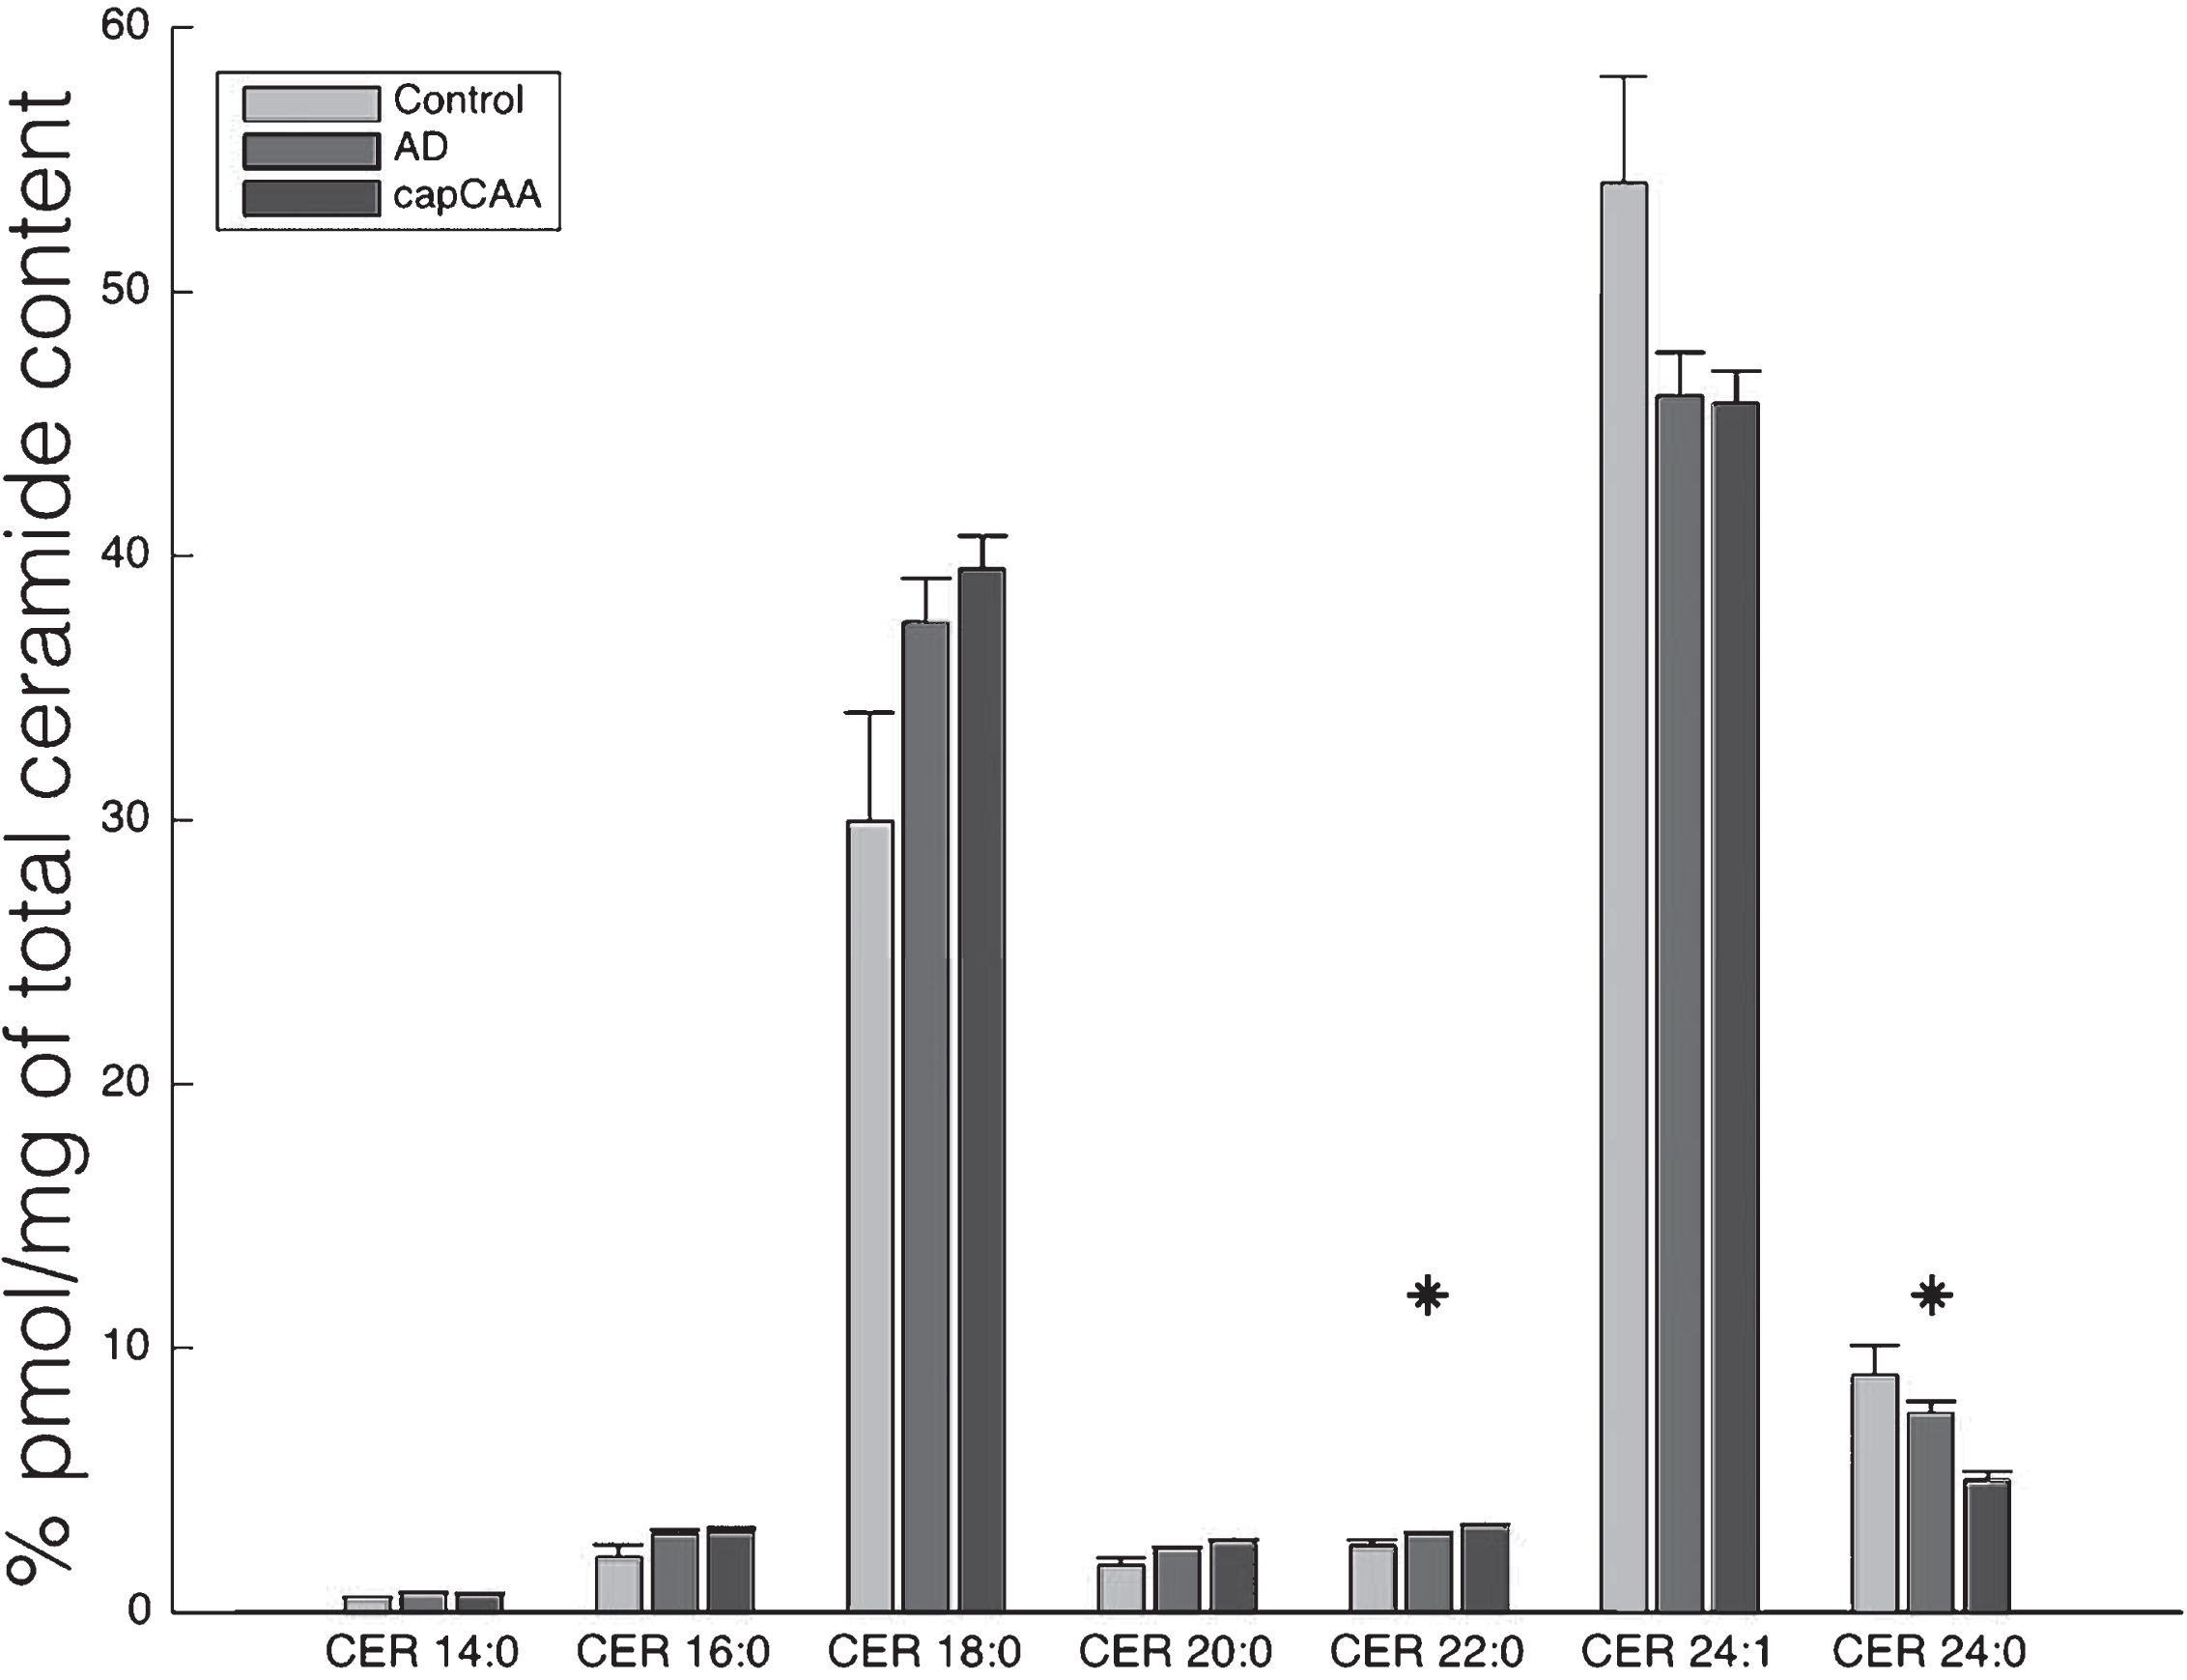
Altered ceramide levels in capCAA compared to AD and controls. Levels of ceramides of different chain-lengths were quantified by use of HPLC MS/MS in brain homogenates of capCAA (n=10), AD (n=6), and controls (n=5). Data show the mean percentage ± S.E.M of total ceramide content. Statistical significance between groups (Kruskal-Wallis test) is indicated with asterisk: *p<0.05.
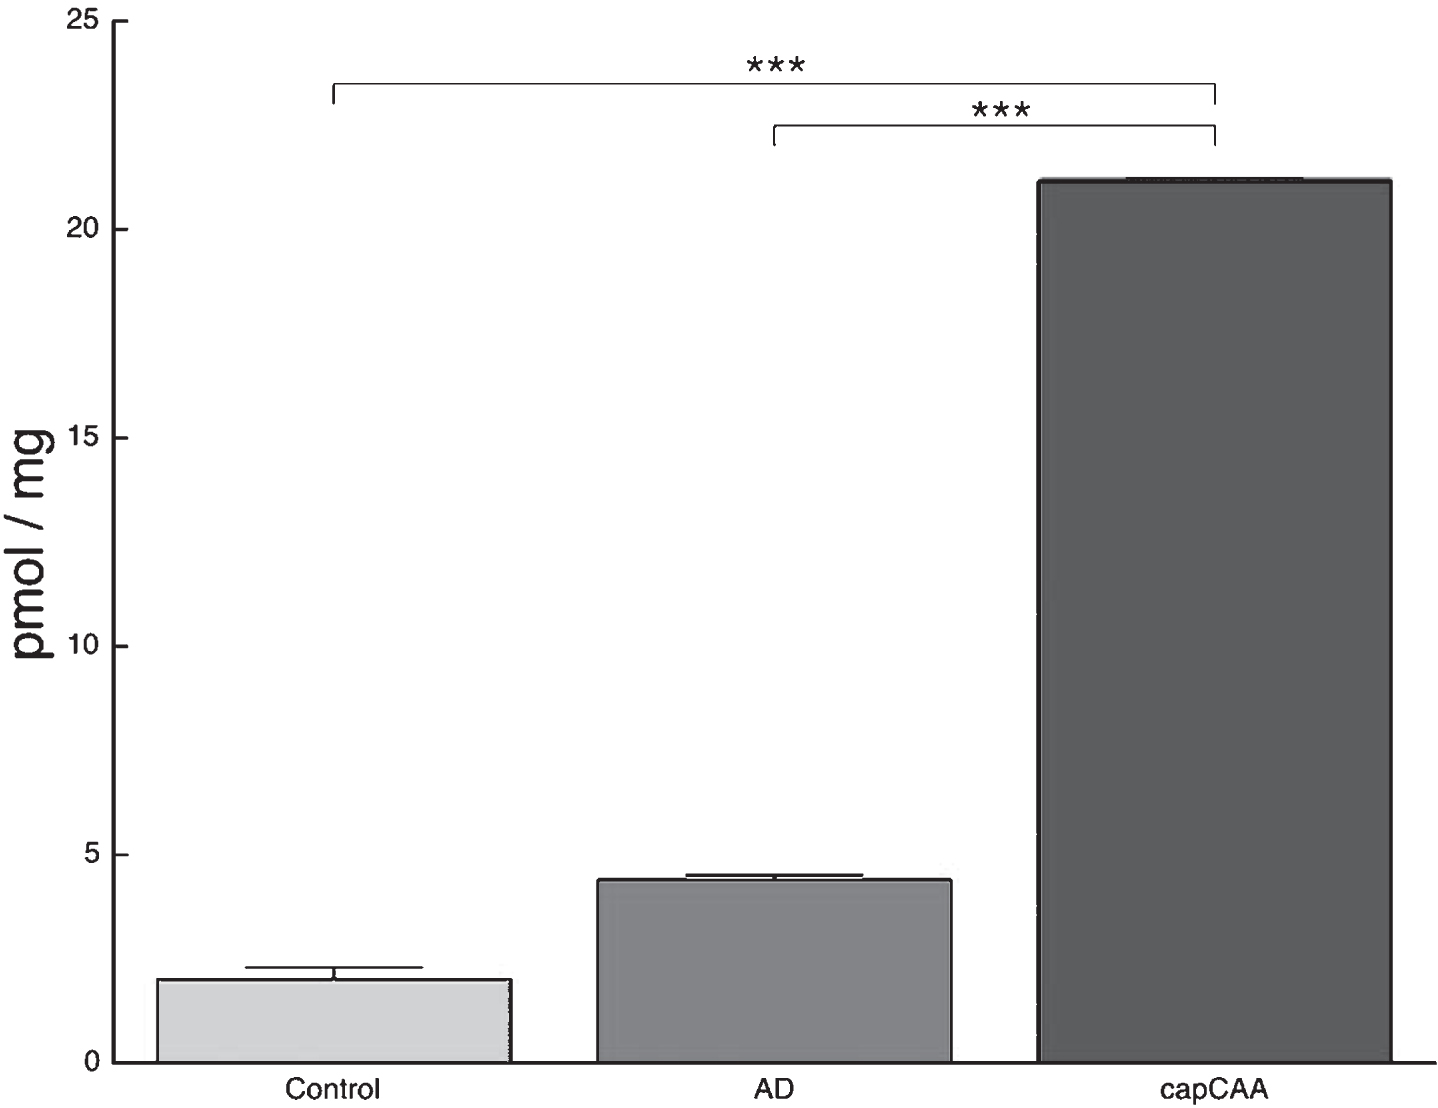
In addition to ceramide content we measured S1P levels using HPLC MS/MS. S1P content in brain homogenates showed a significant difference between the three groups (Ctrl: 2.0 pmol/mg, AD: 4.4 pmol/mg, capCAA: 21.2 pmol/mg). The significant increase in S1P content was found in brains with capCAA pathology compared to AD and non-demented controls (p<0.009, p<0.0006, respectively) (Fig. 5).
Increased S1P content in capCAA compared to AD and controls. HPLC MS/MS analysis shows an increase in S1P content in brain homogenates of capCAA cases (n=10) compared to AD (n=6) and controls (n=5). The values represent the mean ± S.E.M. Statistical significance (Mann-Whitney U test, with Bonferroni correction) indicated with asterisks: ***p<0.001.
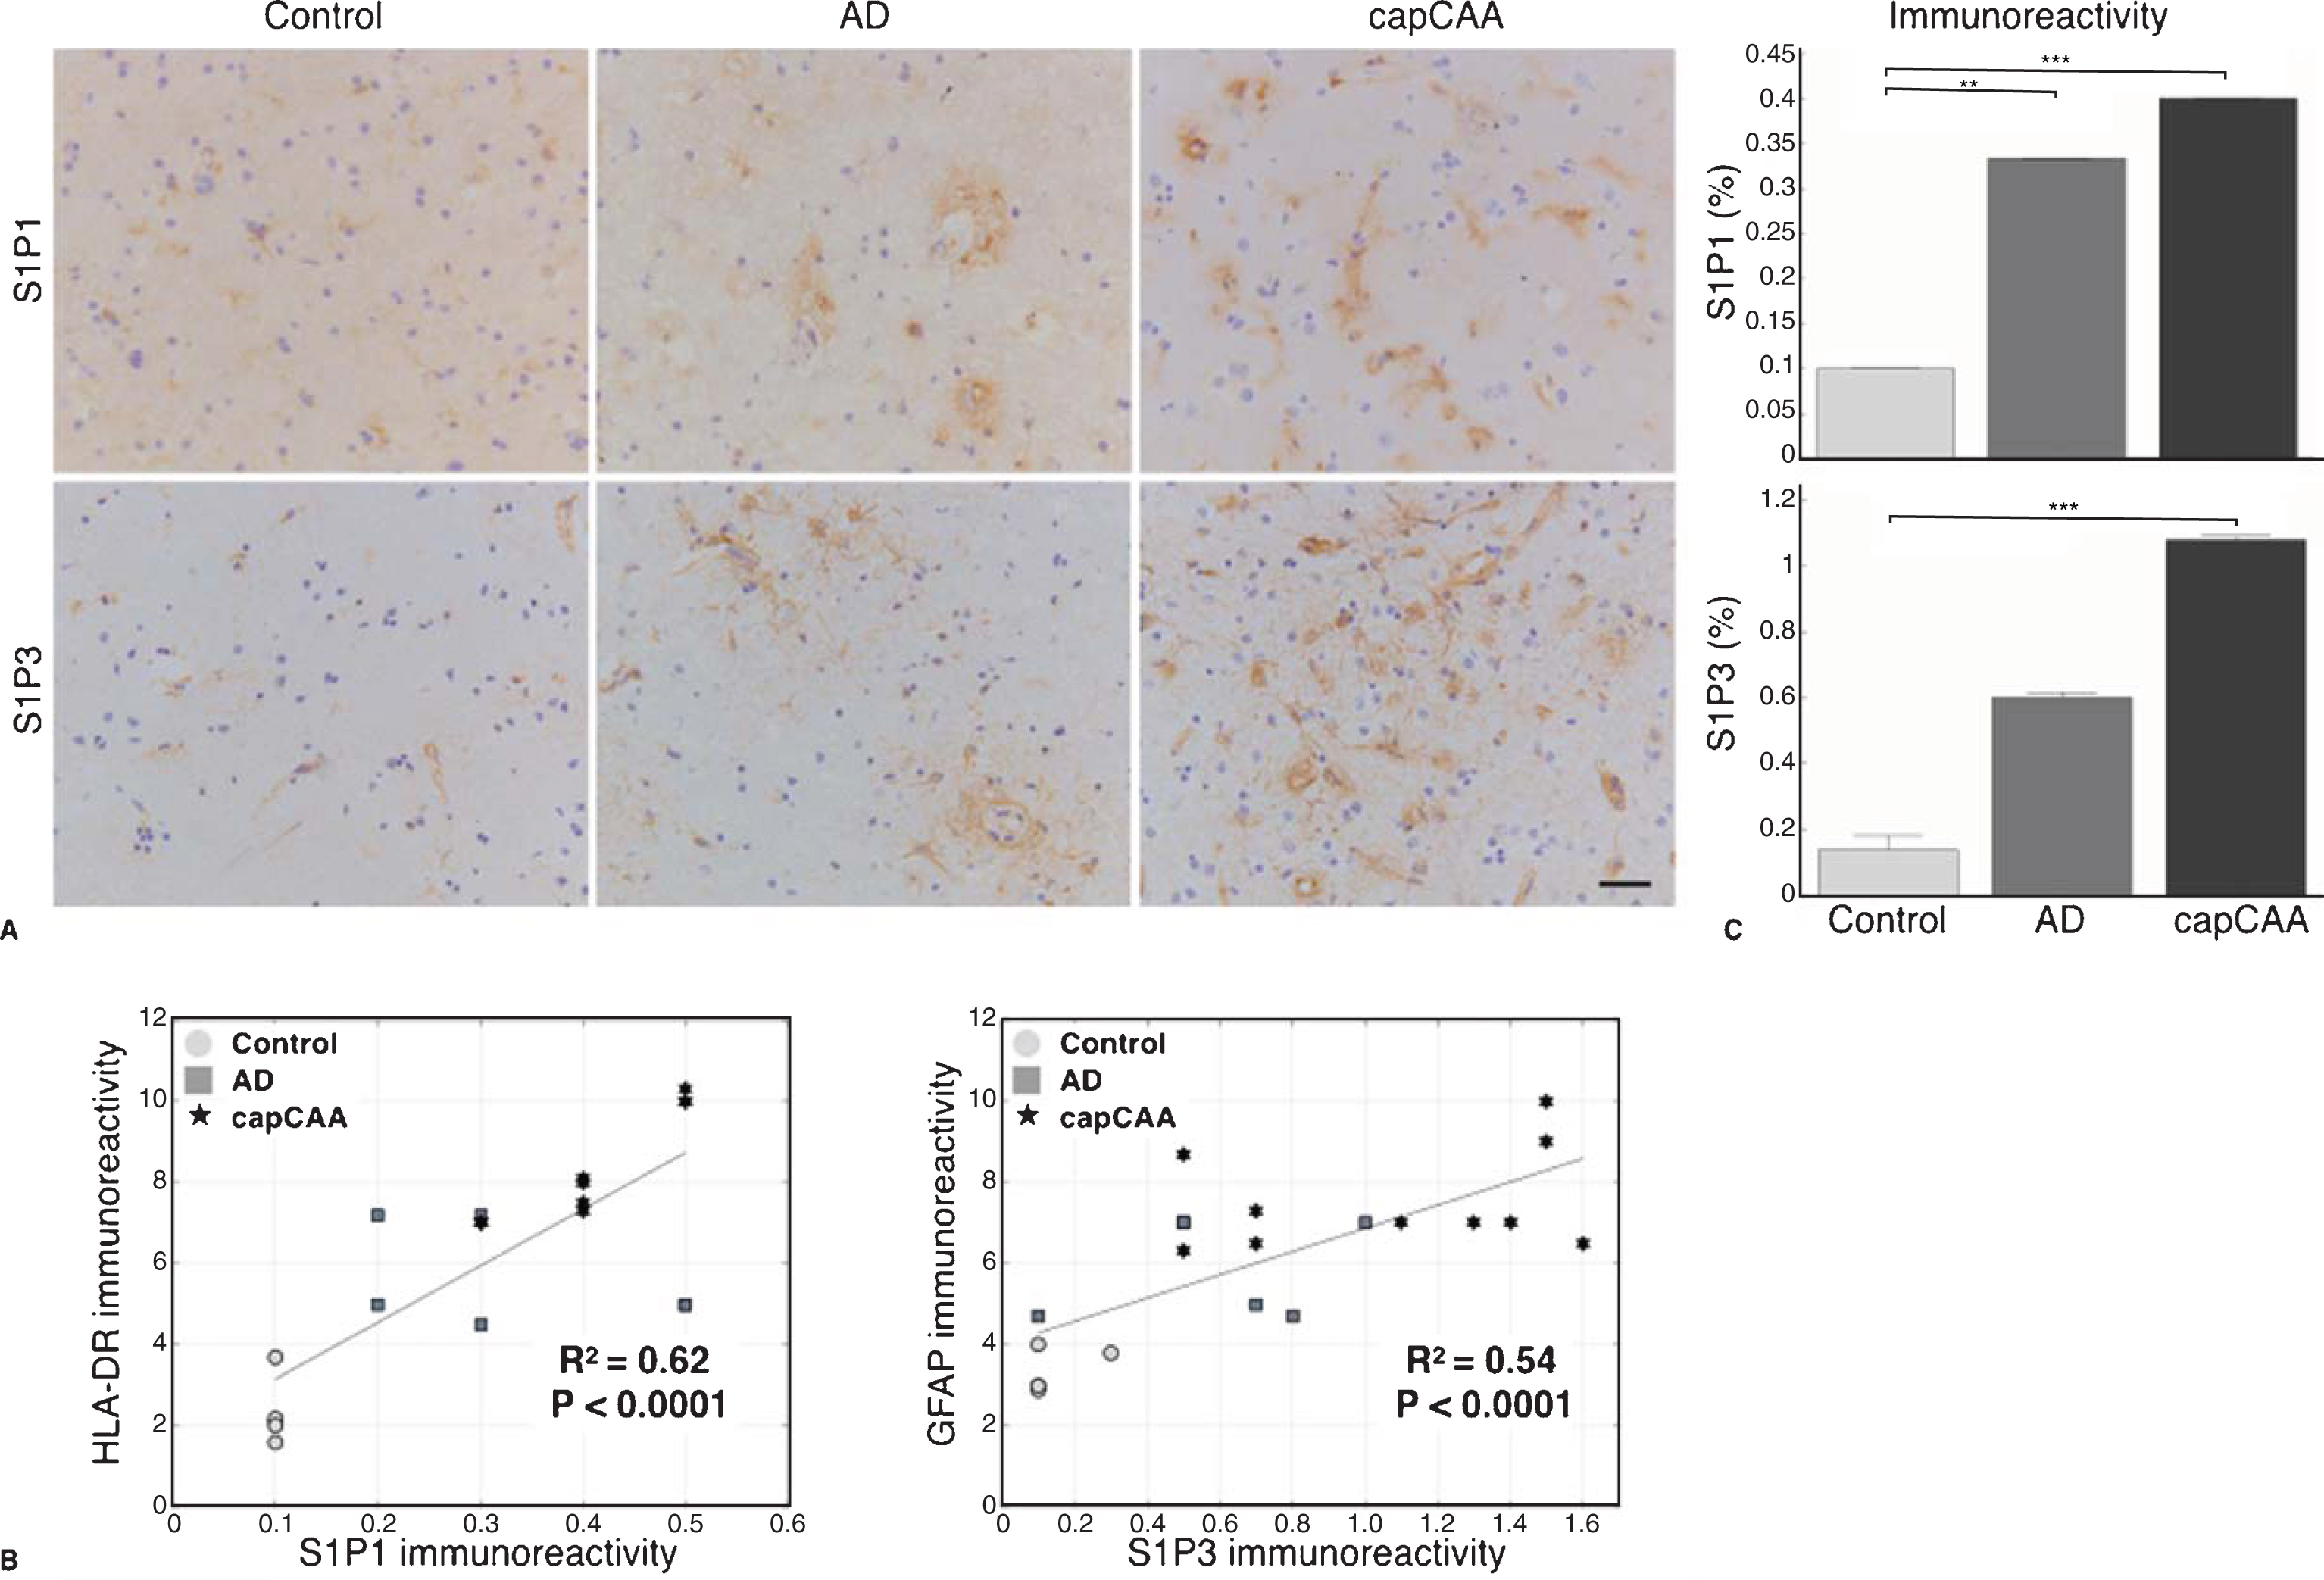
S1P1 and S1P3 receptors are upregulated in capCAA
The upregulation of S1P led us to investigate the expression of S1P receptors. Immunohistochemical analysis of S1P receptor 1 and 3 (S1P1 and S1P3) showed a prominent expression of S1P1 in microglia and S1P3 in astrocytes in capCAA (Fig. 6A). A significant correlation was observed between the expression of S1P1 in microglia (R2=0.62, p<0.0001) and S1P3 in astrocytes (R2=0.54, p<0.0001) (Fig. 6B).
Increased expression of S1P receptors S1P1 and S1P3 in capCAA. A) Immunohistochemical staining for S1P1 and S1P3 in the occipital cortex of non-demented controls, AD, and capCAA. DAB (brown) was used as chromogen and hematoxylin (blue) was used for counterstaining of the nucleus. Bar: 50μm. B) Correlation analysis of the immunoreactive levels of S1P1 and S1P3 to microglia (HLA-DR) and astrocytes (GFAP), respectively. C) Quantitative analysis of the immunoreactive area for S1P1 and S1P3 in capCAA (n=10), AD (n=6), and controls (n=5). The values represent the mean ± S.E.M. Statistical significance (Mann-Whitney U test, with Bonferroni correction) indicated with asterisks: **p<0.01, ***p<0.001.
The quantification of S1P1 showed a significant difference between the three groups (Ctrl: 0.10%, AD: 0.33%, capCAA: 0.40%). The significant increase was found in the percentage of the immunopositive area for S1P1 in AD and capCAA pathology compared to controls (p<0.004, p<0.0006, respectively) (Fig. 6C). In addition, the quantification of S1P3 also showed a significant difference between the three groups (Ctrl: 0.14%, AD: 0.60%, capCAA: 1.08%). However, only a significant increase was found in the percentage of the immunopositive area for S1P3 in capCAA pathology compared with non-demented controls (p<0.0006) (Fig. 6C).
S1P receptor expression on microglia and astrocytes colocalize with Aβ
Finally, double labeling of the S1P receptors and Aβ deposits visualized using Congo Red showed increased levels of immunoreactivity for S1P1 in microglial cells and S1P3 in astrocytes surrounding amyloid-laden capillaries in cases with capCAA pathology compared to the immunoreactive levels in microglia and astrocytes associated with senile plaques in AD without capCAA (Fig. 7).
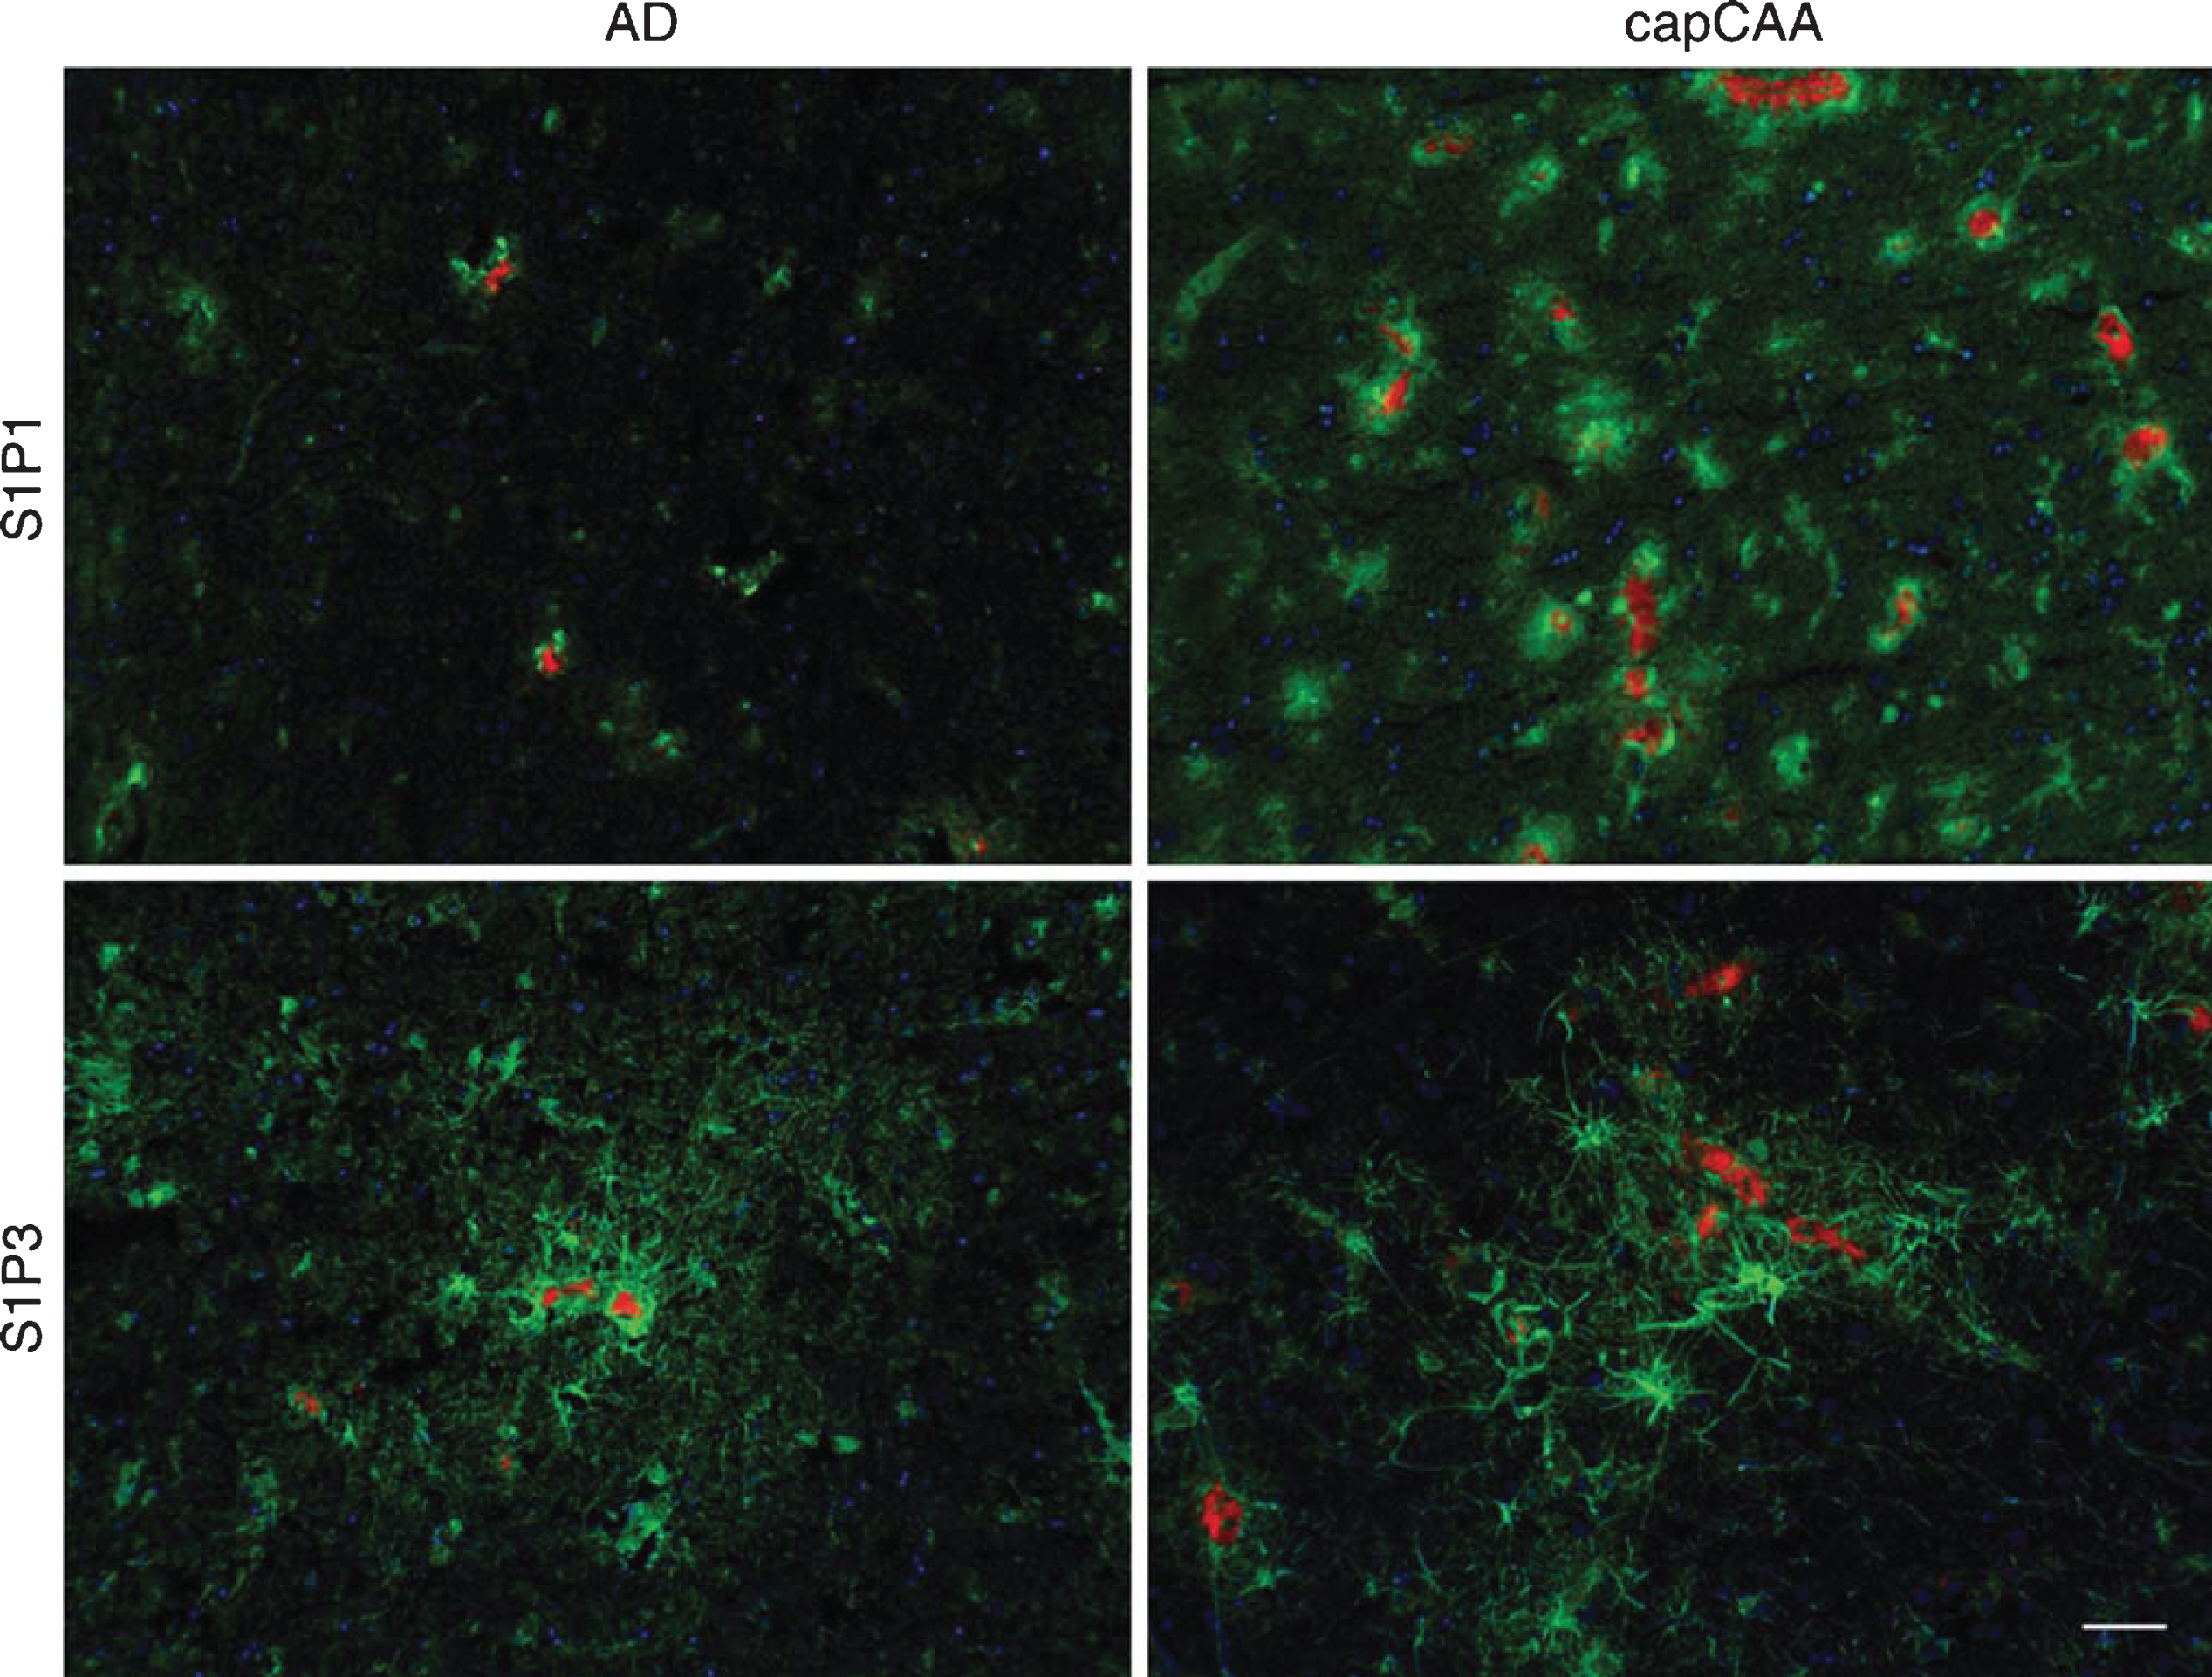
Colocalization of S1P1 and S1P3 with amyloid in AD and capCAA cases. Double immunohistochemical staining was performed for S1P1 and S1P3 (green) together with Congo Red for amyloid deposits (red) in AD cases and capCAA. Hematoxylin (blue) was used for counterstaining the nucleus. Bar: 50μm.
DISCUSSION
The present study for the first time suggests alterations of the sphingolipid pathway in AD patients with capCAA in the occipital cortex, a brain region that is most often selectively affected by capCAA in AD. Moreover, our results indicate that the sphingolipid pathway is differently regulated in AD with capCAA compared to AD without capCAA.
Our findings that pathogenic mechanisms in capCAA seem to differ from AD without capCAA is in line with our previous data in which we have shown that predominantly capCAA is associated with loss of tight junction proteins and a reduced expression and function of ABC transporters such as P-glycoprotein at the level of the blood-brain barrier (BBB), reflecting its dysfunction which may result in decreased transport of Aβ across the BBB respectively. In addition, our earlier analysis indicated that capCAA is selectively associated with the occurrence of a neuroinflammatory response involving microglia, astrocytes and oxidative stress[24, 25].
In the present study we investigated the expression of sphingolipids that are linked to the neuroinflammatory response. For instance, oxidative stress and cytokines are able to enhance sphingomyelinase activation and ceramide production [18, 26]. Our results show an accumulation of ceramide in astrocytes whereas microglia have increased ASM reactivity in capCAA compared to age-matched controls. The accumulation of ceramide in astrocytes and not in microglia corresponds to findings in reactive astrocytes in multiple sclerosis, indicating a role for ceramide in the neuroinflammatory response in both diseases [27].
The clear distinction in our study between the activity of ASM and ceramide production in the glia cells suggest that ceramide production in astrocytes in AD with and without capCAA is independent of ASM. Indeed, in ischemic stroke ceramide production in astrocytes is dependent on neutral sphingomeylinase (nSMase) and not on ASM [28]. However, in multiple sclerosis, it has been shown that the increase of ceramide expression in astrocytes was linked to the increase of ASM activity [18]. These results imply that the enzymes are differently activated under disease specific conditions. It is known that both ASM and nSMase can act on sphingomyelin to generate ceramide. However, these two enzymes are differentially regulated. For instance, they are localized to distinct subcellular compartments and may even generate ceramides with distinct molecular species [29]. Therefore, in our case the increase in ceramide accumulation might also be nSMase dependent since AD is associated with hypoxia [30].
Our results further suggest that the observed increase in ASM reactivity seems not to be relatedto ceramide production. Although it is knownthat the overall activity of ASM is upregulated in AD in comparison with age-matched controls no distinct cell type has yet been identified [31]. Here we show that the increase in ASM activity in capCAA is specific for microglia. Interestingly, recent studies have shown that ASM is needed by microglia for the formation of microparticles. Microglia-derived microparticles can act as amplifying agents of inflammation by storing and releasing the inflammatory cytokine interleukin-1β [32, 33]. Thus, the increased activity of ASM in microglia in capCAA may indicate that microglia actively contribute to the neuroinflammatory environment.
To gain more insight into the altered ceramide level, we measured ceramides of different chain-lengths in brain homogenates of the occipital cortex. Ceramide can be generated through three main pathways: de novo synthesis, via the breakdown of sphingomyelin by sphingomyelinases, and via the salvage pathway [29]. Moreover, ceramides exist in different molecular species as defined by their fatty acyl chain-length and it has been suggested that the function of ceramides differs depending on acyl chain-length and cell type. In the context of the function of ceramide in the brain and in neurodegenerative diseases, it is clear that not only the amount of ceramide is important but also the relative amount of the different chain-lengths [34]. It is proposed that very long-chain ceramides are involved in cell proliferation. In contrast, long-chain ceramides are associated with apoptosis [35]. In the present study, we show an increase in the levels of long-chain ceramides (CER14 : 0 to CER22 : 0) in AD with capCAA while the very long-chain ceramides (CER24 : 0 and CER24 : 1) are less abundant in AD with capCAA compared to controls, indicating a shift in their overall balance, possibly favoringapoptosis.
The ceramides with different acyl chains are synthesized by six ceramide synthases (CerS1-6), which differ in their tissue specific expression pattern and in their substrate specificity [36]. For instance, in the central nervous system (CNS), CerS1 is expressed at high levels producing large amounts of CER18 : 0 ceramide, whereas CerS2, CerS4, CerS5, and CerS6 are expressed at lower levels and CerS3 is not detectable [37]. Interestingly, S1P is able to inhibit CerS2 activity, which synthesizes ceramides containing mainly CER20 : 0–CER26 : 0 fatty acids [38]. So, the increase of S1P levels in capCAA may explain the lower concentrations of the very long-chain ceramides in capCAA. Therefore, it would be interesting to investigate whether the ceramide acyl chain composition correlates with the expression of CerS genes in capCAA.
The found increase of S1P in capCAA is consistent with earlier results where it was shown that S1P stimulates the β-secretase BACE1 by direct interaction with the enzyme, increasing Aβ production[39]. Moreover, primary cultured neurons of mice deficient in the enzyme responsible for thebreakdown of S1P revealed a striking correlation of elevated S1P concentration and neuronal death [40]. These results were replicated in in vitro studies suggesting that S1P can modulate both Aβ generation and toxicity [41]. A possible mechanism by which increased S1P can cause neuronal death is via activated microglia. Secreted S1P can regulate the release of proinflammatory cytokines and nitric oxide by microglia in an autocrine/paracrine signaling fashion [42]. However, the role of S1P in AD needs to be further elucidated since other studies have shown that a reduction of S1P is associated with neurodegeneration [11, 43].
As mentioned, the therapeutic agent FTY720 has beneficial effects in models of AD pathology although the underlying mechanisms are not yet clear. In multiple sclerosis, it has been shown that FTY720 may exert its therapeutic impact via astrocytes, which show enhanced S1P1 and S1P3 receptor expression levels in the disease [44]. However, to date it is unknown whether receptor expression is changing in AD or capCAA. Our results demonstrate a strong increase in S1P1 and S1P3 receptor expression in microglia and astrocytes in AD with capCAA, respectively. Whether the increased receptor expression is a response to the increase in S1P levels or part of the inflammatory response needs to be determined.
The interpretation of data from the current study should be taken with caution. Only a relatively small sample size was feasible in this study, which somewhat decreases the statistical power, but also the positive predictive power [45]. Nevertheless, the significant differences that were found in the sphingolipid balance between the three groups appear to give fruitful avenues for further research and possible future treatments. For instance, an important issue that still needs to be determined is whether the found relationships are cause or consequence ofthe disease.
In conclusion, we provide data that suggests a deregulated sphingolipid balance in AD with capCAA. The increased production of ASM and ceramide by activated glia cells may contribute to the neuroinflammatory environment present in capCAA pathology. In addition, the possible shift in the production of the different ceramides might be an interesting avenue to further investigate in relation to capCAA. Furthermore, our results demonstrate an increase in S1P content together with enhanced expression of S1P1 and S1P3 on microglia and astrocytes in capCAA. Therefore, the activated glia cells may represent a potential target for FTY720treatment.
Footnotes
ACKNOWLEDGMENTS
We would like to thank the Netherlands Brain Bank and Laboratorium Pathologie Oost-Nederland for supplying human brain tissue, and Elise van Haastert, David Hondius, and Marlies Jacobs for their assistance in the laboratory. In addition, we would like to thank Alwin Kamermans (Department of molecular cell biology and immunology, VU medical center, Amsterdam, The Netherlands) for his technical support with the Leica TCS SP8.
This work was supported by grants to NMdW, SdH, MTM, JW, AR, PMM, and HEV from ZonMw Memorabel program (project nr: 733050105) and by the Erasmus Mundus foundation and European Neuroscience Campus (ENC) Network, which had no role in study design, data collection and analysis, decision to publish, or preparation of the manuscript. Research at the Department of Pathology and Molecular Cell Biology is part of the neurodegeneration research program of the Neuroscience Campus Amsterdam. PMM is also supported by the international foundation for Alzheimer Research (ISAO) (project nr: 14545).