
Abstract
Episodic memory tests with cued recall, such as the Free and Cued Selective Reminding Test (FCSRT), allow for the delineation of hippocampal and prefrontal atrophy contributions to memory performance in Alzheimer’s disease (AD). Both Word and Picture versions of the test exist but show different profiles, with the Picture version usually scoring higher across different cohorts. One possible explanation for this divergent performance between the different modality versions of the test might be that they rely on different sets of neural correlates. The current study explores this by contrasting the neural correlates of the Word and Picture versions of the FCSRT with voxel-based morphometry (VBM) in AD and healthy subjects. We predicted that the Picture version would be associated with different cortical regions than the Word version, which might be more hippocampal-centric. When comparing 35 AD patients and 34 controls, AD patients exhibited impairments on both versions of the FCSRT and both groups performed higher in the Picture version. A region of interest analysis based on prior work revealed significant correlations between free recall of either version with atrophy of the temporal pole and hippocampal regions. Thus, contrary to expectations, performance on both the Word and the Picture version of the FCSRT is associated with largely overlapping networks. Free recall is associated with hippocampal volume and might be properly considered as an indicator of hippocampal structural integrity.
Keywords
INTRODUCTION
Dementia rates are increasing on a global scale, especially in Latin America and Asia, where Alzheimer’s disease (AD) is the most prevalent type of dementia [1, 2]. Its amnesic type, characterized by a marked impairment in both the encoding and recall of new information, is the most common syndromic presentation of AD [3, 4]. This amnestic form of AD has been associated with neuropathological changes of the anatomical structures related to episodic memory, mainly the hippocampi and other structures of the medial temporal lobes [5, 6]. In particular, dysfunction of the hippocampal complex in AD leads to a specific episodic memory impairment characterized by a diminished free recall that is only marginally improved by providing a cue [7]. Such memory impairment can be better detected using a cued recall assessment, which is capable of isolating AD-typical hippocampal involvement in the most effective manner, increasing the accuracy of the diagnosis in AD [8, 9]. In this respect, the Free and Cued Selective Reminding Test (FCSRT), a cued recall evaluation for episodic memory, has proven to be an effective tool to detect AD at its early stages [10, 11], and predict future cases of AD dementia [7, 13]. It identifies patients with mild cognitive impairment (MCI) who are at a higher risk for developing AD [7] and also differentiates AD from other types of dementia [14, 15].
Two versions of the FCSRT with stimuli in different modalities have been widely used, namely the “Word” (verbal) [7, 12] and “Picture” (visual) versions [10]. In a previous study [16], the authors of the present investigation reported that both the Word and Picture versions of the FCSRT present almost the same diagnostic utility for the diagnosis of mild AD, although the scores obtained from the Picture version were significantly higher on the total recall than those of the Word version in mild AD patients and controls [16]. On one hand, these results suggest that the Picture version of the FCSRT might be easier than its Word version, or alternatively, that mild AD patients benefit more from pictures than from words. The latter explanation could suggest involvement of different cognitive processes and therefore different neural networks supporting performance on each version of the test. PET studies have reported an association between free recall of the Word version of the FCSRT and right frontal perfusion, with cued recall associated instead with parahippocampal metabolism [17]. Furthermore, structural neuroimaging studies with the FCSRT Word version have exhibited an association between free recall and hippocampal volume measured with MRI-based volumetry in AD and MCI patients [18–20]. Free recall of the Picture version has been associated with left and right hippocampal volume, although the association was either stronger for left hippocampal, or only reported for the left hippocampal volume in AD patients and non-demented elderly people [21, 22]. Recall of the spatial localization of items has been associated with bilateral hippocampal volumes, although somewhat stronger with the right hippocampal volume in ADpatients [21].
To the best of our knowledge, no studies have made a direct comparison between the Word and Picture versions of the FCSRT within the same population of mild AD patients. Likewise, the main objective of this study is to elucidate whether there actually are differential neural correlates for the Word or Picture versions of the FCSRT concerning episodic memory performance. As the main objective of our study was to compare the neural correlates of both modalities of presentation of the FCSRT, we focused on a single measure of FCSRT (free recall). This aim was addressed using voxel-based morphometry (VBM) analyses across a sample of mild AD patients and cognitively normal controls. We predicted that performances on the Word version of the FCSRT would be inversely associated with left hippocampal atrophy and the Picture version with bilateral hippocampal atrophy. Additionally, we expected that the performance on the Picture version would rely more on other cortical structures, than the hippocampus. Hence we predicted that other cortical areas, such as higher visual association area in the ventral pathway, mainly the fusiform and the parahippocampal area, would be more involved in the Picture version than in the Word version, which would be more hippocampal-centric. This difference would reflect the less pronounced impairment in free and total recall of the Picture version in comparison with the Word version of the FCSRT in patients with AD [23].
METHODS
Participants
The sample consisted of 69 participants in this study. This cohort was divided into two groups matched by sex, age, and years of education and included 35 subjects with a clinical diagnosis of AD and 34 cognitively normal (CN) subjects.All patients considered in this study were recruited from two Memory Clinics: the Cognitive Neurology and Dementia Unit of the Neurology Department at Hospital del Salvador and Faculty of Medicine, Universidad de Chile, and the Neuropsychology Unit of the Neurology and Neurosurgery Department at Hospital Clínico Universidad de Chile (HCUCH), which are both located in Santiago, Chile. CN subjects were recruited from a variety of sources, including spouses or relatives of the patients with dementia also considered in this investigation and older adults who regularly attended community groups of elderly people. Inclusion criteria considered Spanish-speaking participants older than 60 years of age with a proper capacity to provide consent for research, whether they were patients diagnosed with AD or cognitively healthy individuals. All participants required a reliable proxy, such as a carer, who had known them for at least 5 years. Specifically, a person that was able to provide information about the activities of daily living performance and the behavior of the participants as well as a general medical history was considered a proxy. The exclusion criteria entailed illiteracy, underlying neurological or psychiatric illness that could affect cognition (except for AD) such as significant head injuries, movement disorders, cerebrovascular diseases, alcohol and other drug abuse, physical disability, sensory disturbances, or disabling cognitive impairment that could interfere with the neuropsychological assessment, and the absence of a reliable proxy. All AD patients met the NINCDS-ADRDA criteria for probable AD [24]. Diagnosis was made by consensus between senior neurologists (AS and CD) based on extensive clinical investigations, interviews with a reliable proxy, laboratory tests, and global cognitive functioning. Briefly, AD patients displayed a history of significant episodic memory loss, within the context of a preserved behavioral and personality score above 0.5 on the Clinical Dementia Rating scale (CDR) (25 with CDR = 1; 8 patients with CDR = 2; 2 with CDR = 3) [25]. CN subjects did not report memory complaints, had a score of 0 on the CDR [25], and their cognitive performance was considered as normal according to local normative data for the Addenbrooke’s Cognitive Examination –Revised Chilean Version (ACE-R-Ch) (>76) [26]. Scores of the FCSRT were not considered to establish the diagnosis.
Ethical approval for this study was obtained from the Ethical and Scientific Committee of the East Metropolitan Health Service and HCUCH Ethic Committee in Santiago, Chile. All participants, or their person responsible, provided informed consent in accordance with the Declaration of Helsinki.
Clinical and neuropsychological examination
All proxies were interviewed together with the participants in order to estimate the CDR scores of the sample. Concerning neuropsychological assessment, experienced clinical psychologists extensively trained at conducting neuropsychological evaluations (CMN and FH) and blinded to the condition of each subject administered a battery of tools that, in addition to both Word and Picture FCSRT versions to measure episodic memory, included the Mini-Mental State Examination (MMSE) [27], the Montreal Cognitive Assessment (MoCA) [28], and the Addenbrooke’s Cognitive Examination-Revised, Chilean version (ACE-R-Ch) [26] to assess global cognitive functioning; the Boston Naming Test as an index of naming; the Rey-Osterrieth Complex Figure Test as an indicator of visuospatial constructional ability [29]; the Forward and Backward Digit-Span task as an index of working memory; the Frontal Assessment Battery (FAB) [30], the Modified Version of the Wisconsin Card Sorting Test (MCST) [31], Verbal Fluency tests [Phonemic Verbal Fluency test (i.e., words beginning with letters A, F, and S in 1 min) and Semantic Fluency test (i.e., animals in 1 min)] and the Trail Making Test A and B [32] as indicators of executive function (EF) (see Supplementary Material).
Episodic Memory testing: Word and Picture FCSRT versions
Spanish versions of the Word and Picture FCSRT were conducted on the entire sample. The Word version of the Spanish FCSRT (words as stimuli) was first administered, and seven days later the Picture version of the Spanish FCSRT was applied (black and white line drawings). The Verbal and the Picture versions of the test used different semantic categories (items) to avoid a learning effect between both versions of the test.
Both versions of the FCSRT were conducted according to the procedure defined by Grober and Buschke [33] and described in detail elsewhere [16]. The FCSRT is based on a semantic cueing method that controls for effective encoding of 16 words or pictures and facilitates retrieval by semantic cueing. Immediate cued recall is tested in a first phase to control for encoding (encoding score). Then, the memory phase is performed in three successive trials. The learning phase of the 16 items was followed by one minute of counting backwards to avoid the recency (short-term memory) effect. This interference task was followed by a free recall trial for all 16 items, and a cued recall trial for those items not retrieved at free recall, and for which the same semantic cues as those used during encoding were verbally given. The first and second recall trials were followed by20 seconds of counting backwards [17]. Overall, both versions of the FCSRT yield several memory measurements, namely the immediate recall (IR) (for the study phase), free recall (FR), cued recall, total recall (TR) scores (maximum score = 48) and sensitivity to cueing index (for the memory phase). As other studies, we did not include the delayed recall and recognition phase in this study, to avoid extending the neuropsychological assessment. It should be noted that the Word and Picture versions of the FCSRT are both ‘verbal memory tasks’ as they both require ‘verbal processing’ while they are being performed encoding, consolidating, recalling or retrieving. The main difference is that the Picture version uses visual items in the test administration.
Statistical analyses for demographical and neuropsychological data
The Statistical Package for the Social Sciences (SPSS) version 20 for Windows (IBM Corp., Armonk, NY, USA) was used to analyze the demographic and neuropsychological data. Together with estimating descriptive indicators for the latter, comparisons between AD and CN subjects were conducted using chi-squared tests for the categorical variables and unpaired two-tailed t-tests for the continuous variables. Differences with a p < 0.05 were considered significant. In addition, the effect sizes (Cohen’s d statistic) were calculated to determine the magnitude of the group differences. According to Cohen, effect sizes between 0.2 and 0.49 are considered small; those between 0.5 and 0.79, moderate; and those 0.8, large [34].
MRI acquisition
MRI acquisition was performed on two 1.5 Tesla MRI scanners, a Philips Intera Nova Dual gradient system (45 mT/m), and a Siemens Symphony Maestro Class (Ernlagen, Germany) with 20 mT/m gradient system. High resolution anatomical scans were obtained using a T1-weightedthree-dimensional gradient recalled echo acquisition: 3D T1 fast field echo sequence on Philips scanner, and 3D T1 fast low angle shot on Siemens scanner, both with the same acquisition parameters (TE = 4.6 ms, TR = 25 ms; flip angle = 30°, field of view on frequency = 250 mm, 256×256 matrix, isotropic voxel size 1×1×1 mm). We present a comparison between subjects scanned at each scanner in Supplementary Table 2. AD subjects scanned are comparable except for performance in total visual recall.
Statistical analyses for neuroimaging data
VBM analysis
MRI data were analyzed with FSL-VBM, a VBM analysis [35, 36] that is part of the FSL software package (http://www.fmrib.ox.ac.uk/fsl/fslvbm/index.html) [37]. First, tissue segmentation was carried out using FMRIB’s Automatic Segmentation Tool (FAST) [38] from brain-extracted images. The resulting grey matter partial volume maps were then aligned to the Montreal Neurological Institute standard space (MNI152) using the nonlinear registration approach using FNIRT [39, 40] which uses a b-spline representation of the registration warp field [41]. As visual inspection revealed that none of the controls had hippocampal atrophy, we boosted statistical power by conducting the analysis across controls and patients, as the controls would not have memory deficits or hippocampal atrophy, as reported in our previous work [42, 43]. A study-specific template was created, combining AD and CN images, to which the native grey matter images were re-registered nonlinearly. This procedure reduces anatomical biases compared to studies including only a patient group [44]. The registered partial volume maps were then modulated (to correct for local expansion or contraction), by dividing them by the Jacobian of the warp field. The modulated images were then smoothed with an isotropic Gaussian kernel with a sigma of 3 mm (FWHM: 8 mm). Because we had strong regional a priori, based on previous literature [42], a region of interest (ROI) mask for prefrontal and medial temporal brain regions was created, by using the Harvard-Oxford cortical and subcortical structural atlas. The following atlas regions were included in the mask: hippocampus, parahippocampal gyrus, fusiform cortex, temporal pole, superior frontal gyrus, middle frontal gyrus, inferior frontal gyrus, orbitofrontal gyrus, subcallosal cortex, medial prefrontal cortex, paracingulate gyrus, anterior cingulate gyrus, and frontal pole. The statistical analysis was performed by employing a voxel-wise general linear model (GLM) which was applied to investigate grey matter intensity differences, and permutation-based nonparametric testing (with 5000 permutations per contrast) [45] was used to form clusters with the threshold-free cluster enhancement method [46], tested for significance at p < 0.05, and corrected for multiple comparisons via Family-wise Error (FWE) correction across space, unless otherwise stated. In that case, a threshold of 100 contiguous voxels was used, uncorrected at the p < 0.001threshold.
In a first step, differences in gray matter intensities between AD patients and CN subjects were assessed. To control for a possible scanner effect, we introduced these data as a covariate (see Supplementary Table 3 and Figure 1). Next, correlations between gray matter atrophy and Word and Picture free recall scores of the FCSRT were entered as covariates in the design matrix of the VBM analysis for AD patients combined with controls. It has been previously reported [47] that this procedure improves the statistical power to detect brain-behavior relationships. In a third step, an overlap analysis was conducted to identify common regions of gray matter atrophy correlating with both Word and Picture free recall scores. The statistical maps generated from the contrast using Word and Picture free recall scores as a covariate, were scaled using a threshold of p < 0.01, following which, the scaled contrasts were multiplied to create an inclusive, or overlap, mask across groups. In a final step, we performed a contrast analysis between Word and Picture versions to study the existence of significant anatomical differences between both versions. For the exclusive masks, the same procedure as above was adopted; however, the scaled images weresubsequently divided by each other, to create an exclusive mask for each condition.

VBM analysis showing brain areas of decreased gray matter intensity in AD patients in comparison with Controls (MNI coordinates X = 36; Y = –30; Z = –4). Colored voxel show regions that were significant in the analysis with p < 0.05 corrected for multiple comparisons (FWE), with a cluster threshold of 100 contiguous voxels. Clusters are overlaid on the MNI standard brain.
For all covariate analyses, a threshold of 100 contiguous voxels was used, with FWE correction at the p < 0.05 threshold, unless otherwise stated. In that case, a threshold of 100 contiguous voxels was used, uncorrected at the p < 0.001 threshold. Regions of significant atrophy were superimposed on the MNI standard brain, with maximum coordinates provided in MNI space. Areas of significant gray matter loss were localized with reference to the Harvard-Oxford probabilistic cortical and subcortical atlas. For statistical power, we used a covariate-only statistical model with a t-contrast, providing an index of association between brain atrophy and episodic memory performance on the experimental measures.
RESULTS
Demographic and neuropsychological data
Demographics and neuropsychological scores are shown in Table 1. AD and control groups did not differ in terms of sex, age or education (all ps > 0.05). In brief, AD patients exhibited scores significantly higher on assessments of severity of the disease (CDR) and lower on measures of global cognitive efficiency (ACE-R-Ch, MMSE, and MoCA) and episodic memory (free and total recall of Word and Picture versions of the FCSRT) than those observed for CN subjects. Compared to the CN group, the AD group was significantly impaired on all scores of the Word and Picture versions of the FCSRT. Still, both controls and AD patients performed better in the Picture compared to the Word version of the task (see Table 1). (The details of the neuropsychologicalbattery in CN and AD subjects are shown in Supplementary Table 1).
Demographic characteristics of Alzheimer’s disease patients and normal controls
1Cohen’s d *p < 0.001. £AD patients and controls showed significantly higher scores in the Picture version compared to the Word version of the FCSRT. Data are presented in mean±standard deviation (minimum –maximum). ACE-R, Addenbrooke’s Cognitive Examination Revised; AD, Alzheimer’s disease; CDR, Clinical Dementia Rating; CDR-SB, CDR-Sum of box; MMSE, Mini-Mental State Examination, MoCA, Montreal Cognitive Assessment.
VBM: Group comparison analysis
Results are shown in Table 2 and Fig. 1. The AD group was contrasted with the CN group to reveal patterns of brain atrophy in the fronto-medial temporal mask. The AD group showed significant grey matter atrophy in bilateral hippocampal brain regions, and a more right lateralized atrophy in the posterior part of the middle temporal gyrus, as well as atrophy involving both bilateral precentral and inferior gyri (par opercularis) (p fwecorr <0.05). The same results were obtained in the analysis including the scanner as a covariate (see Supplementary Table 2 and Supplementary Figure 1).
VBM results showing regions of significant gray matter intensity decrease for the contrast of AD and Control groups corrected by scanner type
All results corrected for multiple comparisons (FWE) at p < 0.05; only cluster with at least 100 contiguous voxels included. MNI, Montreal Neurological Institute.
VBM: Correlations with free recall scores of the Word version and the Picture version of the FCSRT
Results are shown in Table 3 and Fig. 2. Free recall scores of the FCSRT Word and Picture versions were entered as covariates in the design matrix of the VBM analysis. For the AD patients combined with controls, the free recall score of both the Word and Picture versions covaried with atrophy in the left temporal pole and bilateral hippocampal brain regions (p fwecorr <0.05). The Word version also covaried with atrophy in the right middle frontal gyrus(p fwecorr <0.05).
VBM results showing regions of significant gray matter intensity decrease that covary with free recall performance in AD combined with Controls, for the Word and Picture versions of the FCSRT
All results corrected for multiple comparisons (FWE) at p < 0.05. Only cluster with at least 100 contiguous voxels included. MNI, Montreal Neurological Institute.
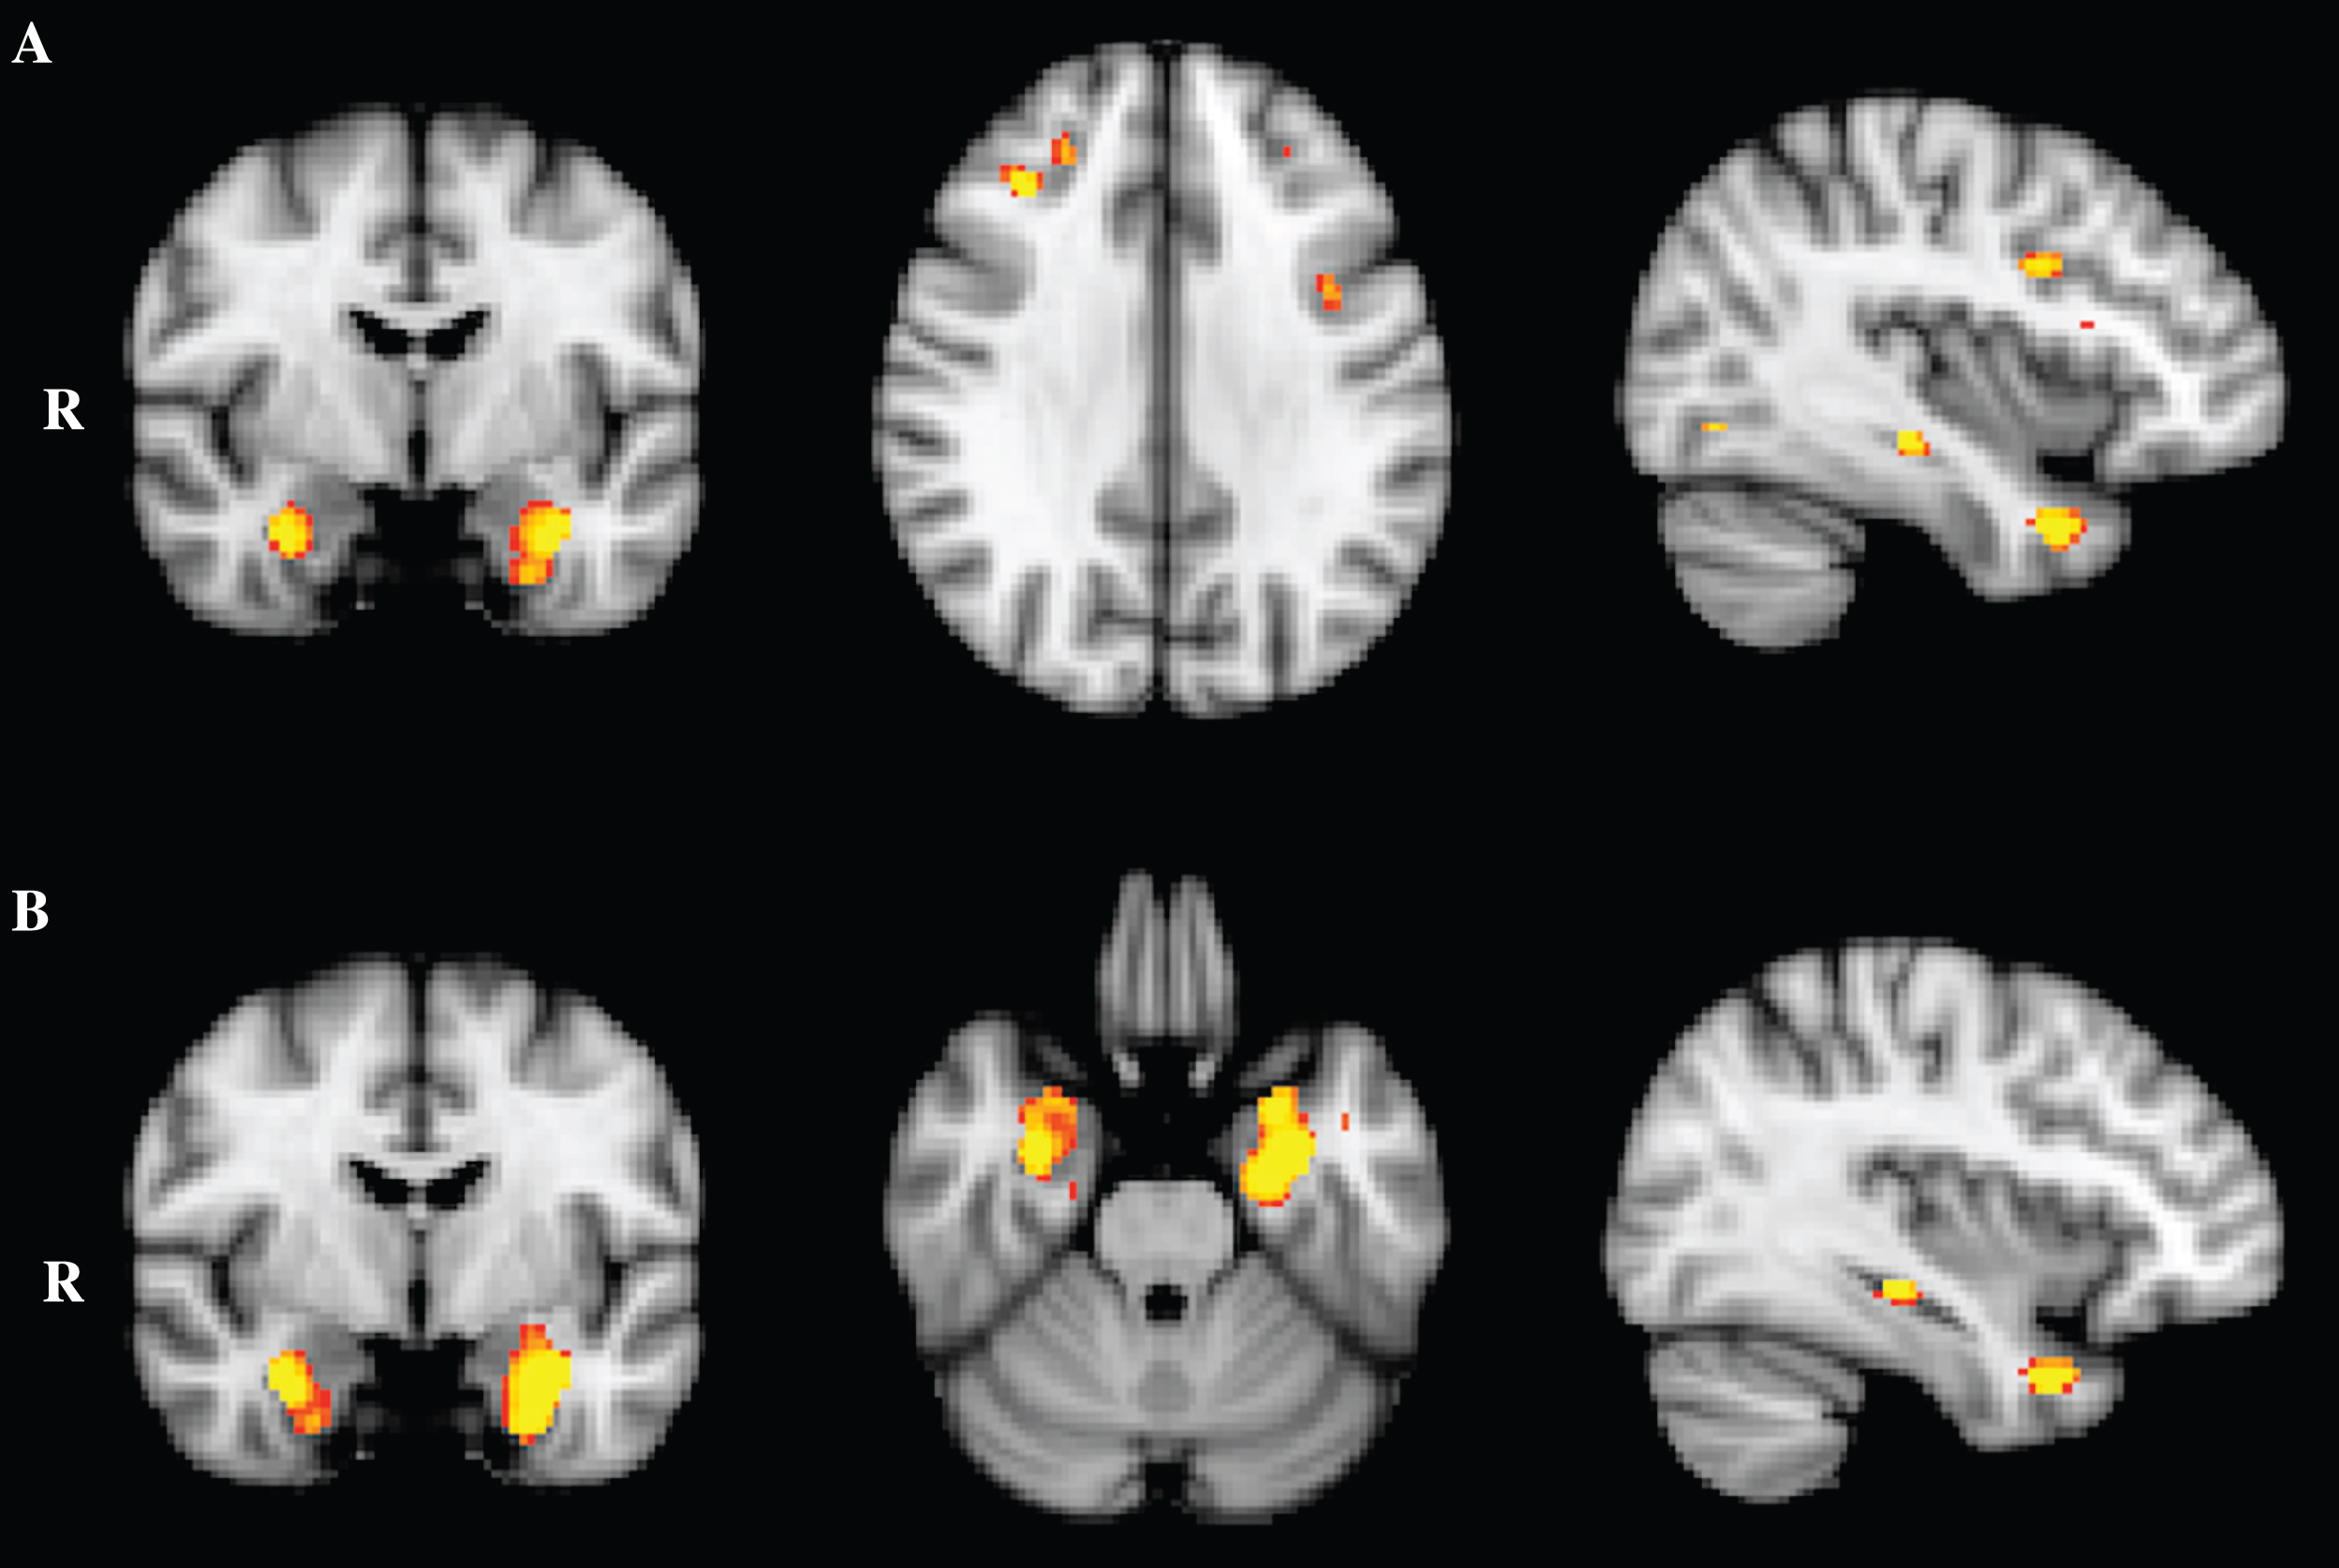
VBM analysis showing brain areas in which gray matter intensity correlates significantly with free recall performance in AD in comparison with Controls, for (A) Word (MNI coordinates X = –38; Y = –6; Z = 32) and (B) Picture (MNI coordinates X = –36; Y = –6; Z = –26) versions of the FCSRT. Colored voxel in A and B show regions that were significant in the analysis with p < 0.05 corrected for multiple comparisons (FWE). For all analysis, a cluster threshold of 100 contiguous voxels was used. Clusters are overlaid on the MNI standard brain.
VBM: Overlapping pattern of the Word and Picture versions of the FCSRT
Results are shown in Fig. 3. For the AD group combined with controls, the free recall score of the Word and Picture versions of the FCSRT showed high atrophy overlap mainly in the left temporal pole and hippocampal regions.

VBM analysis showing brain regions in which gray matter intensity correlates with free recall performance in both Word and Picture version of the FCSRT (MNI coordinates X = –38; Y = –6; Z = –26). Colored voxel show regions that were significant in the analysis with p < 0.05 corrected for multiple comparisons (FWE). For all analysis, a cluster threshold of 100 contiguous voxels was used. Clusters are overlaid on the MNI standard brain.
VBM: Differential patterns of the Word and Picture versions of the FCSRT
Results are shown in Fig. 4. For the AD group combined with controls, only the free recall score of the Word version covaried with atrophy in the rightmiddle frontal gyrus (p fwecorr <0.05). The free recall score of the Picture version covaried only with atrophy in the right and left parahippocampus regions and the right temporal fusiform region (p fwecorr <0.05).
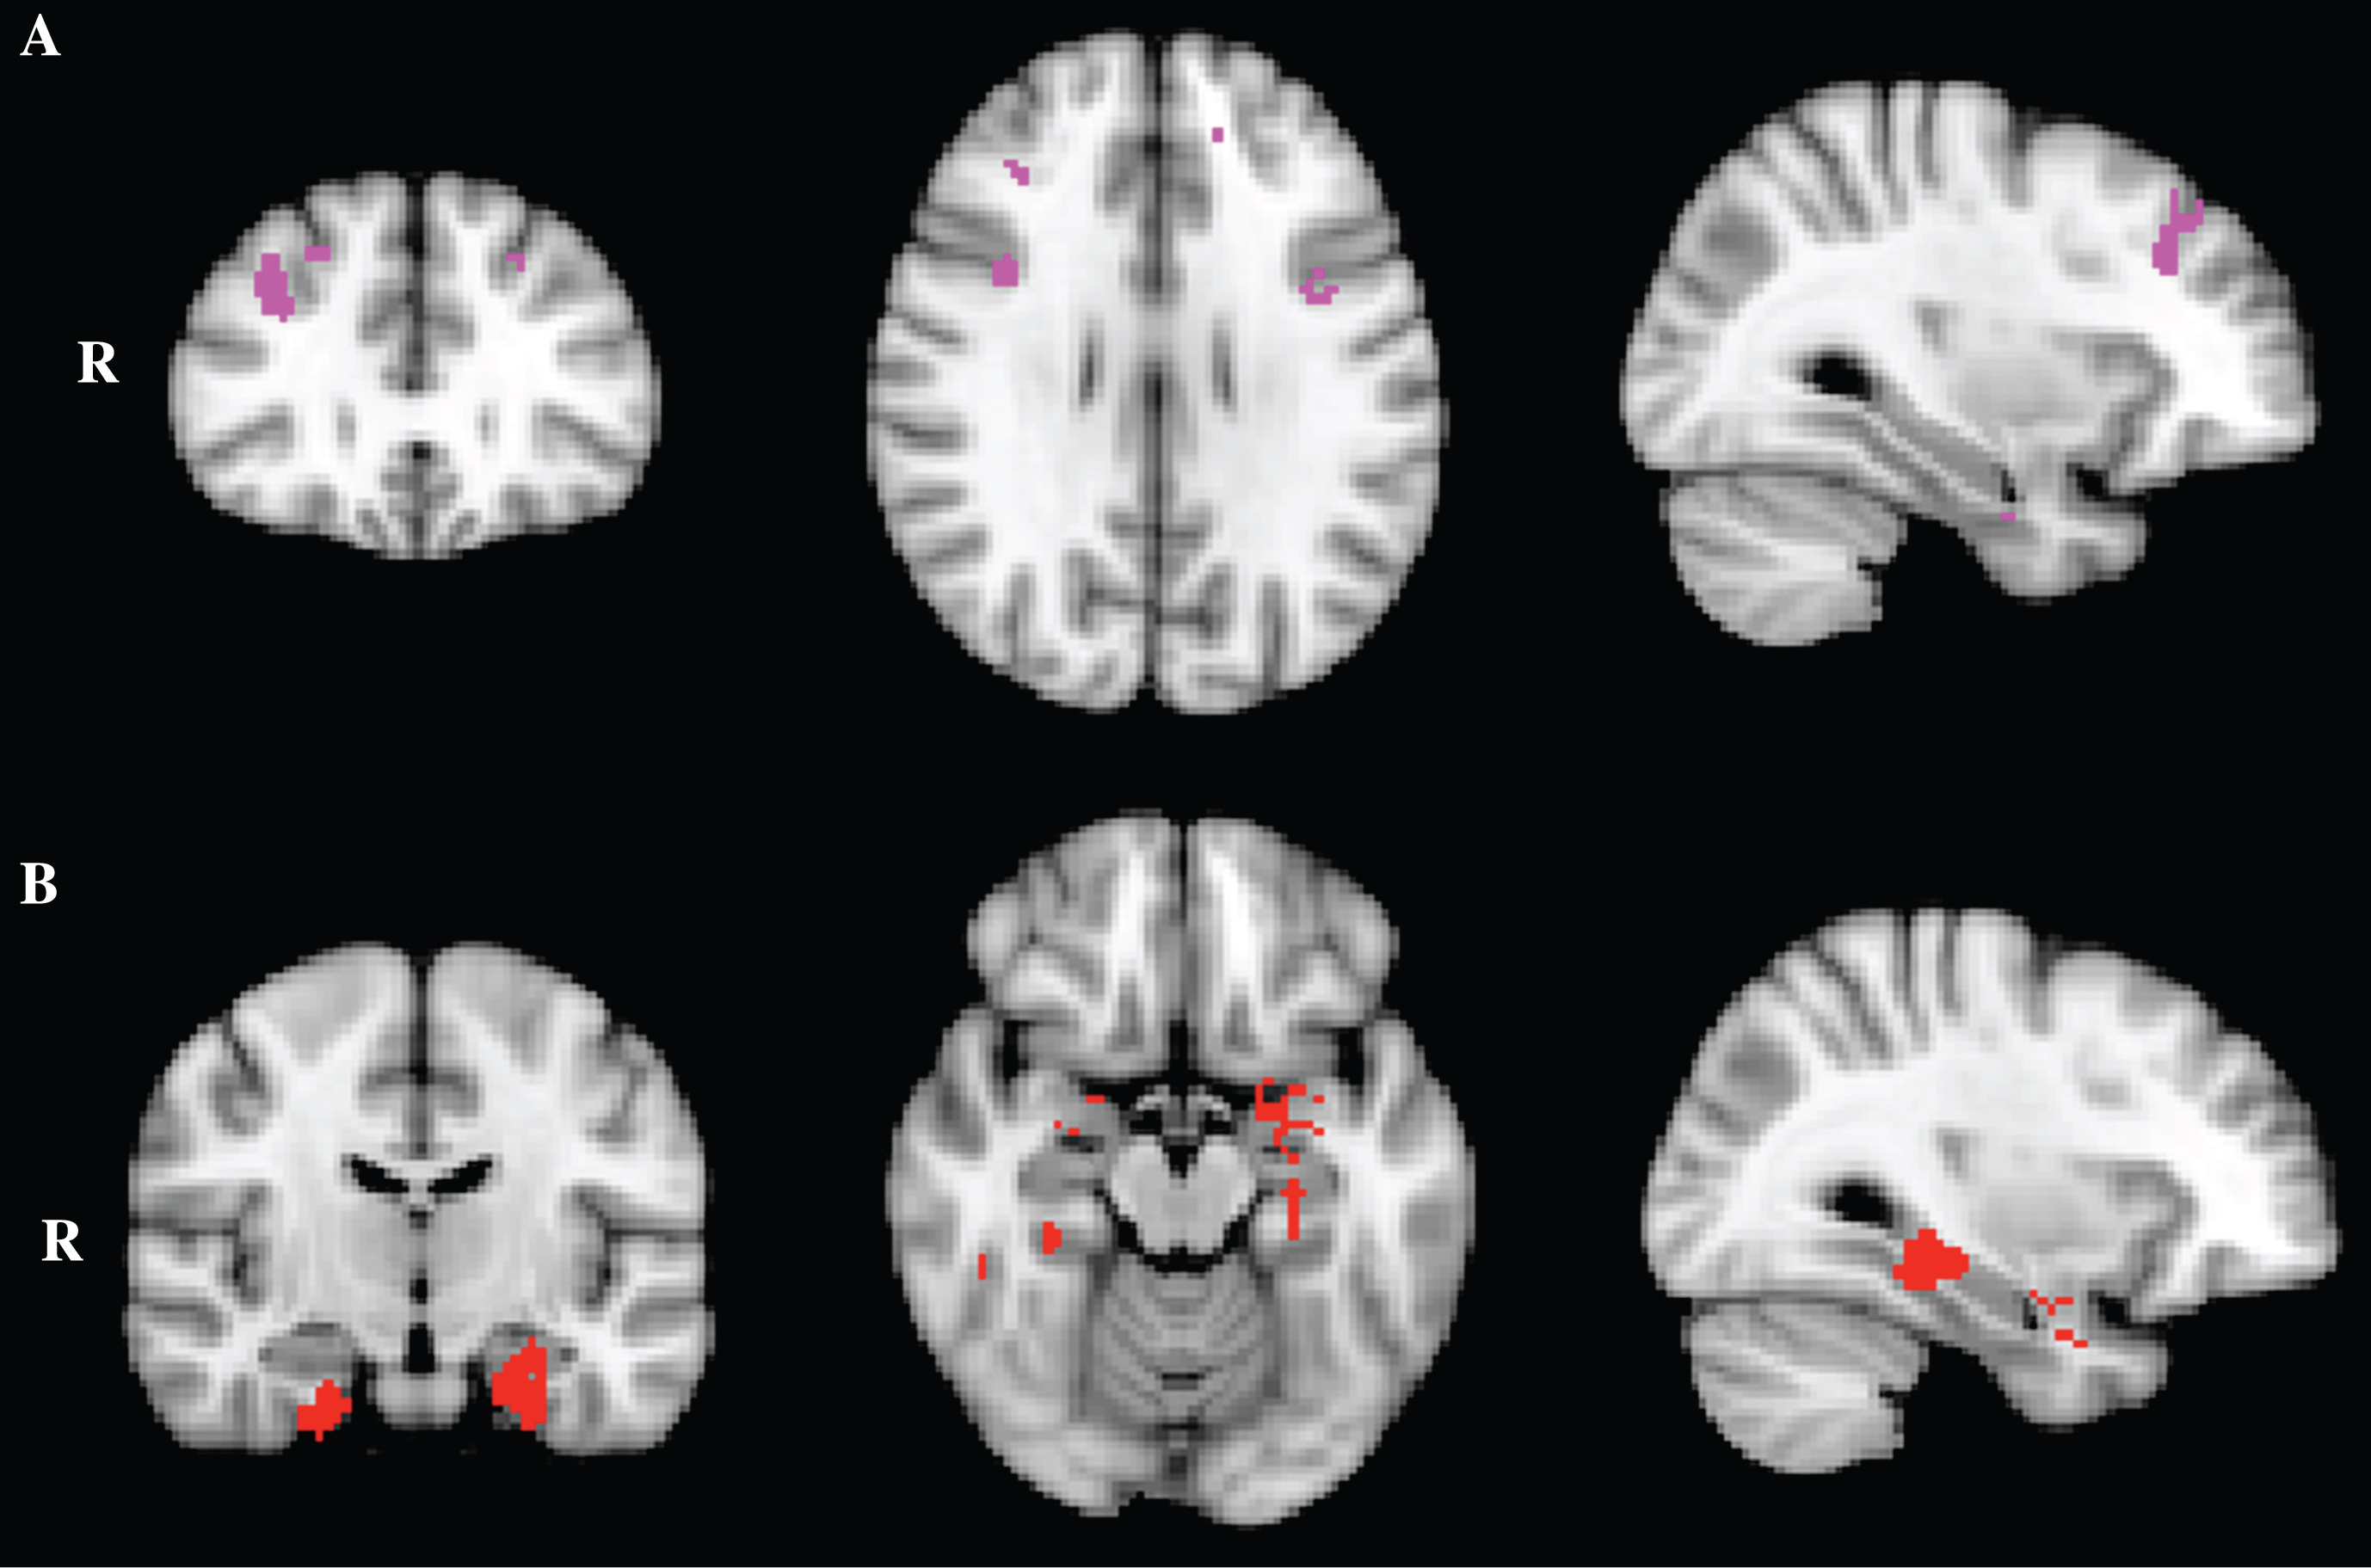
VBM analysis showing exclusive brain areas in which gray matter intensity correlates significantly with free recall performance in AD in comparison with Controls, for (A) Word (MNI coordinates X = 32; Y = 30; Z = 28) and (B) Picture (MNI coordinates X = 32; Y = –14; Z = –16) versions of the FCSRT. Colored voxel in A and B show regions that were significant in the analysis with p < 0.05 corrected for multiple comparisons (FWE). For all analysis, a cluster threshold of 100 contiguous voxels was used. Clusters are overlaid on the MNI standard brain.
VBM results showing common regions of significant grey matter intensity decrease that correlate with free recall performance in AD combined with Controls, which overlap in Word and Picture versions of the FCSRT
All results corrected for multiple comparisons (FWE) at p < 0.05. Only cluster with at least 100 contiguous voxels included. MNI, Montreal Neurological Institute.
VBM results showing exclusive regions of significant gray matter intensity decrease that correlate with free recall performance in AD combined with Controls, for the Word and Picture versions of the FCSRT
All results corrected for multiple comparisons (FWE) at p < 0.05. Only cluster with at least 100 contiguous voxels included. MNI, Montreal Neurological Institute.
DISCUSSION
Our results showed that free recall for both the Word and Picture versions of the FCSRT correlated bilaterally with several brain structures, including mainly commonalities but also some differences between both versions.
Concerning the neuroanatomical comparison of the Word and Picture versions, performances on free recall were mainly correlated with two large clusters in the hippocampus and the temporal pole. For the Word version, there were additional smallerclusters in the frontal cortex. For the Picture version, there were also two clusters in both parahippocampal regions and the right fusiform gyrus. Notably, we performed the VBM analysis using only one measure of memory performance, i.e., free recall, due to the fact that free and total recall measures are highly correlated due to total recall consisting of both free and cued recall. As our main goal was to compare the two-modality versions of the FCSRT, we constrained our analysis to the free recall scores only (however, results of the total recall can be found in the Supplementary Material). In general, our results replicate previous findings that free recall is a measure of encoding and storage processes that are dependent on the hippocampus [48]. The hippocampus has been reported as a critical region for episodic memory. Indeed, involvement of the hippocampus is a hallmark feature of AD and is considered to underlie the predominant amnesic syndrome [49]. Furthermore, previous studies reported correlation between scores of FCSRT free recall and atrophy in the left hippocampus and parahippocampus in AD and MCI subjects [19, 22].
This finding is concordant with a recent study reporting that either the Rey Complex Figure delayed recall and the FCSRT delayed Recall, visual and a verbal episodic memory tests, are associated with total hippocampal volume in cognitively normal older adults [47]. Moreover, studies with visual tests show association with right hippocampus MCIsubjects [20].
Picture free recall was also associated with a cluster in both the parahippocampus region and the right fusiform cortex. The involvement of the right fusiform gyrus in our study could be explained by its role in the recognition of objects categories, such as animals, houses, and man-made tools [50]. The association of the Picture version with both parahippocampal regions is expected due to the visual characteristics of the test. This result is also in agreement with the evidence suggesting that both parahippocampal regions are involved in memory-related processing that involves associations between elements [51].
Finally, free recall on the Word version was also associated with one small cluster in the middle frontal gyrus. A similar result has been reported by Lekeu et al. in AD patients [17] and has been recently reported by Philippi et al. in patients with mild cognitive impairment using the Word version of the FCSRT [20]. It has been suggested that this association is related to the implication of search activity and strategic retrieval of the information during free recall [20]. The involvement of prefrontal regions in memory processing is well established, and patients with prefrontal lesions exhibit impaired performance in free recall in memory [52–54]. The lateral frontal pole has been implicated in working memory and episodic memory retrieval [55]. The association of episodic memory performance with frontal polar atrophy is concordant with previous studies in AD [42, 56]. Moreover, Irish et al. [56] reported, using another verbal memory task (RAVLT), an association between memory impairment and frontal lobe atrophy. Interestingly, two divergent patterns of prefrontal and medial frontal atrophy have been described in AD. Atrophy of the prefrontal cortex has been associated with poor memory performance only in AD patients with impairment in EF [42]. Concordant with this result, our AD subjects present a significant impairment in EF tests. The extent to which frontal pathology contributes to episodic memory dysfunction in AD needs to be explored further [56]. Interestingly, the contrast analysis revealed that this association is exclusively for the Word version, suggesting that it could be material specific.
Also, free recall of both versions of the FCSRT was associated with a large cluster in the temporal pole. This cluster could be explained by semantic memory processing involved in the FCSRT [57]. Therefore, an involvement of these areas might explain poor performances on episodic memory tasks taking into account that episodic memory problems can be underpinned by impairment of semantic memory network.
The behavioral results showed higher performances on the Picture version than for the Word version in AD and controls, as previously reported [16]. Several factors could account for this result. First, the category of cue-items pairs differs between the Word and Picture version, i.e. the Picture version includes only concrete items whereas the Word version include more abstract cue-item pairs. A positive effect of word concreteness has been previously reported in episodic memory [58]. Additionally, according to the dual encoding theory of memory, pictures are remembered better than words because their representations in memory include both verbal and visual storage while words are encoded only verbally [59]. An alternate account for the picture superiority effect on memory performance is that pictures give rise to more distinct semantic representations than words [60]. The contrast imaging analysis revealed that the Picture version was associated with a broader network of regions involved in the recognition of object categories, which could facilitate memory for the Picture version, and brain regions involved in semantic memory.
Despite these interesting findings, some methodological issues warrant consideration in the current context. We cannot exclude that other atrophy in the temporal and frontal lobes is involved in these tests. We applied a conservative multiple comparison correction threshold as well as cluster extent thresholds of 100 contiguous voxels to reduce the number of false positives. Importantly, Monte Carlo simulations and experimental data demonstrate that cluster thresholding is an effective tool to reduce the probability of false positive findings without compromising the statistical power of the study [56, 61]. However, it will be important to replicate these findings in independent patient cohorts using similar correction methods. Finally, the diagnosis of AD was established on clinical grounds without any neuropathological confirmation for the diagnoses. Nevertheless, clinical pathological studies suggested that NINCDS-ADRDA criteria are reliable for the diagnosis of AD [62]. Finally, even if most of AD patients included in our study are at the mild stage of AD, several subjects present with moderate AD and were severely impaired in the FCSRT, in line with previous studies with AD [19, 64]. Indeed, a floor effect in some patients is also reported in previous studies and does not affect the VBM analysis.
In conclusion, our results suggest that both versions of the FCSRT are appropriate measures of episodic memory in AD. Performances on these tests are associated with dysfunction of a neural network with an established role in episodic memory impairment in early AD [65]. Our results suggest that free recall can be considered a hippocampal test. The Picture version of the FCSRT could have great utility to evaluate episodic memory impairment in a low-educated population or more severe patients. Finally, further insight on the neuroanatomical correlates of the FCSRT requires the study of other neurodegenerative diseases.
DISCLOSURE STATEMENT
Authors’ disclosures available online (http://j-alz.com/manuscript-disclosures/16-0973r2).