
Abstract
The aim was to evaluate brain amyloid-β (Aβ) deposition in patients with mild cognitive impairment (MCI) due to Alzheimer’s disease (AD) using amyloid PET imaging and clarify the relationship between the annual change in Aβ deposition and disease progression. Forty-eight MCI patients underwent neuropsychological assessment and amyloid PET imaging using [11C]-PIB over a follow-up of 5.7±1.5 years. Thirty-nine MCI patients who had an amyloid-positive scan were defined as MCI due to AD, and 9 MCI patients who had an amyloid-negative scan were included. Regions of interest were defined on co-registered MRI, and the PIB standardized uptake value ratio (SUVR) on the same regions was used over follow-up. Annual change in PIB SUVR was calculated. Patients with MCI due to AD had higher baseline PIB SUVR (1.81±0.32, n = 39, p < 0.01) and a greater annual rate of change in PIB SUVR (0.044±0.027, n = 39, p < 0.01) compared to amyloid-negative MCI patients. Twenty-eight (71.8%) progressed to AD. In patients who progressed during a short duration of 1.7±0.8 years, the annual rate of increase in PIB SUVR was 0.101±0.094 (n = 16, p < 0.05), which was greater compared to patients with long conversion or stable patients. There was a negative correlation between the annual rate of increase in PIB SUVR and duration of progression to AD among individual MCI converters (r = –0.47, n = 28, p < 0.05). The patients defined as MCI due to AD could progress to AD with a shorter period if they have a greater increased annual rate in brain Aβ deposition.
INTRODUCTION
The National Institute on Aging (NIA)-Alzheimer’s Association (AA) working group hasreferred to the diagnostic criteria for the symptomatic predementia phase of AD as mild cognitive impairment (MCI) due to Alzheimer’s disease (AD), which is used to identify individuals with AD pathophysiological processes as the primary cause of their progressive cognitive dysfunction [1]. MCI due to AD could be more certainly diagnosed in individual MCI subjects based on core clinical criteria for MCI with biomarkers of amyloid-β (Aβ) accumulation and/or neurodegeneration. We have recently demonstrated that the Aβ biomarker with [11C]-labeled Pittsburgh Compound-B (PIB) positron emission tomography (PET) identified MCI due to AD with greater sensitivity (100%), specificity (66.6%), and positive predictive value (80%) in MCI patients compared to the fluorodeoxyglucose (FDG) PET biomarker alone or both PET biomarkers combined [2]. MCI with a biomarker indicative of AD molecular neuropathology, positive PET amyloid imaging, could be defined as MCI due to AD, indicating that patients actually have an early form of AD.
Amyloid PET imaging with the tracer [11C]-PIB, which has high affinity for fibrillar Aβ, is a distinctive and reliable biomarker of Aβ accumulation [3]. We have already reported that a diagnostic framework with Aβ deposition by [11C]-PIB PET in different clinical stages of AD allows for an earlier and more specific AD diagnosis process [4]. Some longitudinal studies have demonstrated that MCI patients with a positive Aβ PET scan with [11C]-PIB had increases in Aβ deposition with time and are at risk for progression to AD dementia [5, 6].
The rate of change in brain amyloid deposition has been recently estimated during the AD process using multiple PIB PET scans. These amyloid deposition rates have been reported to be rapid early, with later flattening to a plateau in the subjects over the entire course of AD, although the annual change in global PIB retention did not differ among clinical stages [7]. However, it remains unclear how the change in brain Aβ deposition with time is related to the progression to AD at the MCI stage. When intra-individual changes in brain Aβ deposition and cognitive decline are evaluated among the patients defined as MCI due to AD, a more accurate process of disease progression could be elucidated. Therefore, long-term follow-up is needed to investigate the trajectories of brain Aβ deposition.
The aim was to evaluate the longitudinal change in brain Aβ deposition over a long-term follow-up period in patients with MCI due to AD using amyloid PET imaging with [11C]-PIB. We sought to clarify the relationship between the annual change in brain Aβ deposition, cognitive decline, and disease progression.
MATERIALS AND METHODS
Subjects
Forty-eight MCI patients aged 50 to 90 years were recruited from our memory clinic and included in a long-term follow-up study. They underwent neurological and neuropsychological assessment and PET amyloid imaging using [11C]-PIB. Global cognitive status was assessed with the Mini-Mental-State Examination (MMSE) [8] and severity of dementia was rated on the Clinical Dementia Rating (CDR) scale and CDR sum of boxes (CDR SB) [9]. Memory measurement of immediate and delayed recall of a paragraph from the Wechsler Memory Scale-Revised (WMS-R) Logical Memory II (maximum score 25) was performed as a simple episodic memory test [10]. The apolipoprotein E (APOE) genotype was determined. Participants were excluded when they had other neurodegenerative condition, vascular disease, major depression, traumatic brain injury, or any other medical disease. MCI was diagnosed according to the Core Clinical Criteria for MCI proposed by the NIA-AA workgroup [1]. All MCI patients had an MMSE score of 24 or higher and global CDR score of at least 0.5 in the memory domain.
Of these participants, 39 patients who met the core clinical criteria for MCI and had an amyloid-positive scan at baseline were defined as MCI due to AD. Some of them had participated in our earlier study [2]. Nine patients who met the MCI criteria and had an amyloid-negative scan were also included in the negative MCI group. All MCI patients were clinically followed-up every 6 months and underwent [11C]-PIB PET at baseline and two to five times over a mean follow-up of 5.7±1.5 years (range, 3.5–8.3 years), approximately 12 to 24 months apart. AD was diagnosed at each visit if the MCI subjects fulfilled the criteria of the National Institute of Neurological and Communicative Disorders and Stroke-Alzheimer’s Disease and Related Disorders Association (NINCDS-ADRDA) [11]. AD patients had an MMSE score of 23 or less, global CDR score of 0.5 or 1, CDR SB score that had increased more than two scores and impaired activities of daily living. The study was approved by the Ethics Committee of Mirai Iryo Research Center Inc. (Tokyo, Japan). All subjects provided written informed consent before participating in the study.
Amyloid PET imaging
All PET scans were performed on the same day as the cognitive assessment, using a Siemens ECAT ACCEL scanner in 3-dimensional scanning mode, which provided 63 contiguous 2.46-mm slices with a 5.6-mm transaxial and a 5.4-mm axial resolution. All imaging data were reconstructed into a 128×128 matrix. Amyloid PET imaging was accomplished with [11C]-PIB, which was produced in our PET center according to standard procedures, as previously described [4]. [11C]-PIB was injected intravenously as a bolus with a mean dose of 550.0±10% MBq. Dynamic PET scanning was performed for 60 min according to a predetermined protocol.
Image analysis
A region of interest (ROI) analysis was performed on individual PET images. All subjects underwent T1-weighed MRI (1.5T) for co-registration with PET images. MRI-based correction of PET data was performed using PMOD software (PMOD Technologies Ltd., Adliswil, Switzerland). The ROIs were manually drawn on the co-registered MR image along the AC-PC plane for each subject and included the following 20 bilateral cortical regions: lateral temporal cortex (LTC), medial temporal cortex (MTC), frontal cortex (FC), occipital cortex (OC), parietal cortex (PC), sensory motor cortex (MC), anterior cingulate gyrus (ACG), posterior cingulate gyrus (PCG), precuneus cortex (Pre), and cerebellar cortex. The cerebellar gray matter was used as a reference region, to which these cortical regions were normalized. The ROIs of follow-up PET images were co-registered with the initial PET images, and the same ROIs were applied to baseline and follow-up images.
The retention of [11C]-PIB was calculated as the regional-to-cerebellum standardized uptake value ratios (SUVR) for 35 to 60 min. The regional PIB SUVR in each cortical region and cortical PIB SUVR for the mean of the regional SUVR over nine cortical regions across both hemispheres, including LTC, MTC, FC, OC, PC, MC, ACG, PCG, and Pre, were defined.
The amyloid-positive scan was determined based on PIB SUVR of 1.39 or more in any of cortical regions at baseline, and was classified as a typical or focal positive scan in our clinical setting. Cut-point value was based on the bimodal distribution of [11C]-PIB uptake in 56 cognitively normal controls and 32 AD patients and discriminated AD patients from healthy controls with a sensitivity of 97.2% and specificity of 85.3%, as previously described [12].
Data management
An annual change in PIB SUVR was calculated for each subject at the time of conversion to AD and a last follow-up time point using the following equation: annual change = [(SUVR at follow-up – SUVR at baseline) / follow-up period (years)]. Furthermore, annual change in PIB SUVR was evaluated from the time of conversion to the last follow-up point.An annual change in MMSE scores was also performed in the same way.
Statistical analysis
Group differences were evaluated with repeated-measure analysis of variance, followed by post hoc tests to assess the significance. When comparing two groups, two-sample, unequal variance, two-tailed Student’s t-tests were used. Analysis correlation between PIB SUVR values, age, MMSE scores, CDR SB scores, and WMS-R recall scores yielded Pearson’s product moment correlation coefficient (r). Categorical variables were examined with Fisher’s exact test. Paired t-tests were used to study changes between baseline and follow-up data. Results were considered significant at p < 0.05. Data are presented as means±standard deviations (SD). All analyses were performed with the use of Statcel 3 software version 3 (OMS Inc., Japan).
RESULTS
Clinical data
Twenty-eight of 39 patients with MCI due to AD clinically progressed to AD during a mean follow-up of 5.7±1.5 years. Of these 28 patients, 16 progressed to AD within 3 years after baseline over a short-term follow-up of 1.7±0.8 years (short conversion), whereas 12 progressed to AD during 3.5 to 6.3 years over a long-term follow-up of 4.4±1.1 years (long conversion). The remaining 11 patients remained stable during a follow-up of 5.1±1.5 years (stable). The conversion rate of MCI due to AD was 41.0% within 3 years whereas it was 71.8% over a mean follow-up of 5.7 years. The overall conversion rate was 20.7% per year. None of amyloid-negative MCI patients progressed to AD during a follow-up period of 6.0±1.8 years.
The demographic characteristics of the patients with MCI due to AD and amyloid-negative MCI at baseline and last follow-up are shown in Table 1. Thirty-nine patients with MCI due to AD had a mean age of 70.4±6.2 (range, 53–80) and had the cognitive impairment with a mean MMSE score of 26.8±1.5 and a CDR SB score of 0.7±0.2 at baseline. Age, gender, education level, MMSE, or CDR SB did not differ by each subgroup of patients at baseline whereas WMS-R delayed recall scores at baseline was low in a subgroup with short conversion.At last follow-up, the mean MMSE score declined to 21.5±4.2, and CDR SB worsened to 2.5±1.4.
Demographic characteristics of patients with MCI due to AD and amyloid-negative MCI at baseline and at follow-up
n, number of patients, y, years, MMSE, Mini-Mental State Examination, CDR, Clinical Dementia Rating, CDR SB, CDR sum of boxes, Rec, WMS-R recall scores, APOE, apolipoprotein E. Data are presented as means±SD. *Statistically significant difference from baseline by two-sample t-tests (p < 0.05).
Twenty (51%) of 39 patients with MCI due to AD had an APOE ɛ4 allele whereas 3 (33%) of 9 amyloid-negative MCI patients had it. Also, an APOE ɛ4 allele was present in 17 (61%) of 28 MCI patients who progressed to AD, which was not significantly different from 3 (27%) of 11 patients who did not progress.
In the MCI patients with short conversion, the mean MMSE score significantly decreased from 26.0±1.5 to 21.0±1.9 (n = 16, p < 0.01), and the CDR SB score increased to 2.4±0.7 (n = 16, p < 0.01) at time of conversion. Similarly, the MCI patients with long progression had a mean MMSE of 21.5±1.7 (n = 12, p < 0.01) and CDR SB of 2.7±0.8 (n = 12, p < 0.01). In contrast, in the stable patients, mean MMSE and CDR SB scores at last follow-up were not different from those at baseline. The annual rate of decline in MMSE score in the MCI patients until progression to AD was –2.7±2.3 per year (n = 28, p < 0.01), which was significantly larger than that in the stable patients (–0.30±0.47, n = 11).
Aβ deposition
Patients with MCI due to AD had significantly high cortical PIB SUVR at baseline (1.81±0.32, n = 39, p < 0.01) compared to amyloid-negative MCI patients (1.12±0.06, n = 9). In all cortical regions except for the MTC, the regional PIB SUVRs in MCI due to AD at baseline were also significantly higher than those in the amyloid-negative MCI (Table 2). The cortical PIB SUVR in APOE ɛ4 carriers with MCI due to AD at baseline (1.77±0.31, n = 20) did not significantly differ from that in APOE ɛ4 non-carriers (1.85±0.34, n = 19). When cortical PIB SUVRs were correlated to age at baseline among the patients with MCI due to AD, there was no significant relationship between them (r = 0.15, n = 39,p = 0.35).
Regional PIB SUVR at baseline and at last follow-up in patients with MCI due to AD and amyloid-negative MCI patients
n, number of patients; MTC, medial temporal cortex; LTC, lateral temporal cortex; ACG, anterior cingulate; FC, frontal cortex; OC, occipital cortex; PCG, posterior cingulate; Pre, precuneus; PC, parietal cortex; SMC, sensory motor cortex; Cortical, whole cortical regions. Data are presented as mean±SD. *Statistically significant difference from baseline by two-sample t-tests (p < 0.05).
In MCI patients who progressed to AD, the cortical PIB SUVR at baseline (1.87±0.34, n = 28, p < 0.05) was significantly higher than in those who did not progress. In particular, the MCI patients with short conversion had higher cortical PIB SUVR at baseline (1.95±0.38, n = 16, p < 0.05) compared to the stable patients (Fig. 1). In contrast, in the MCI patients with long conversion, cortical PIB SUVR at baseline (1.78±0.27, n = 12) did not significantly differ from that in MCI patients with short conversion.
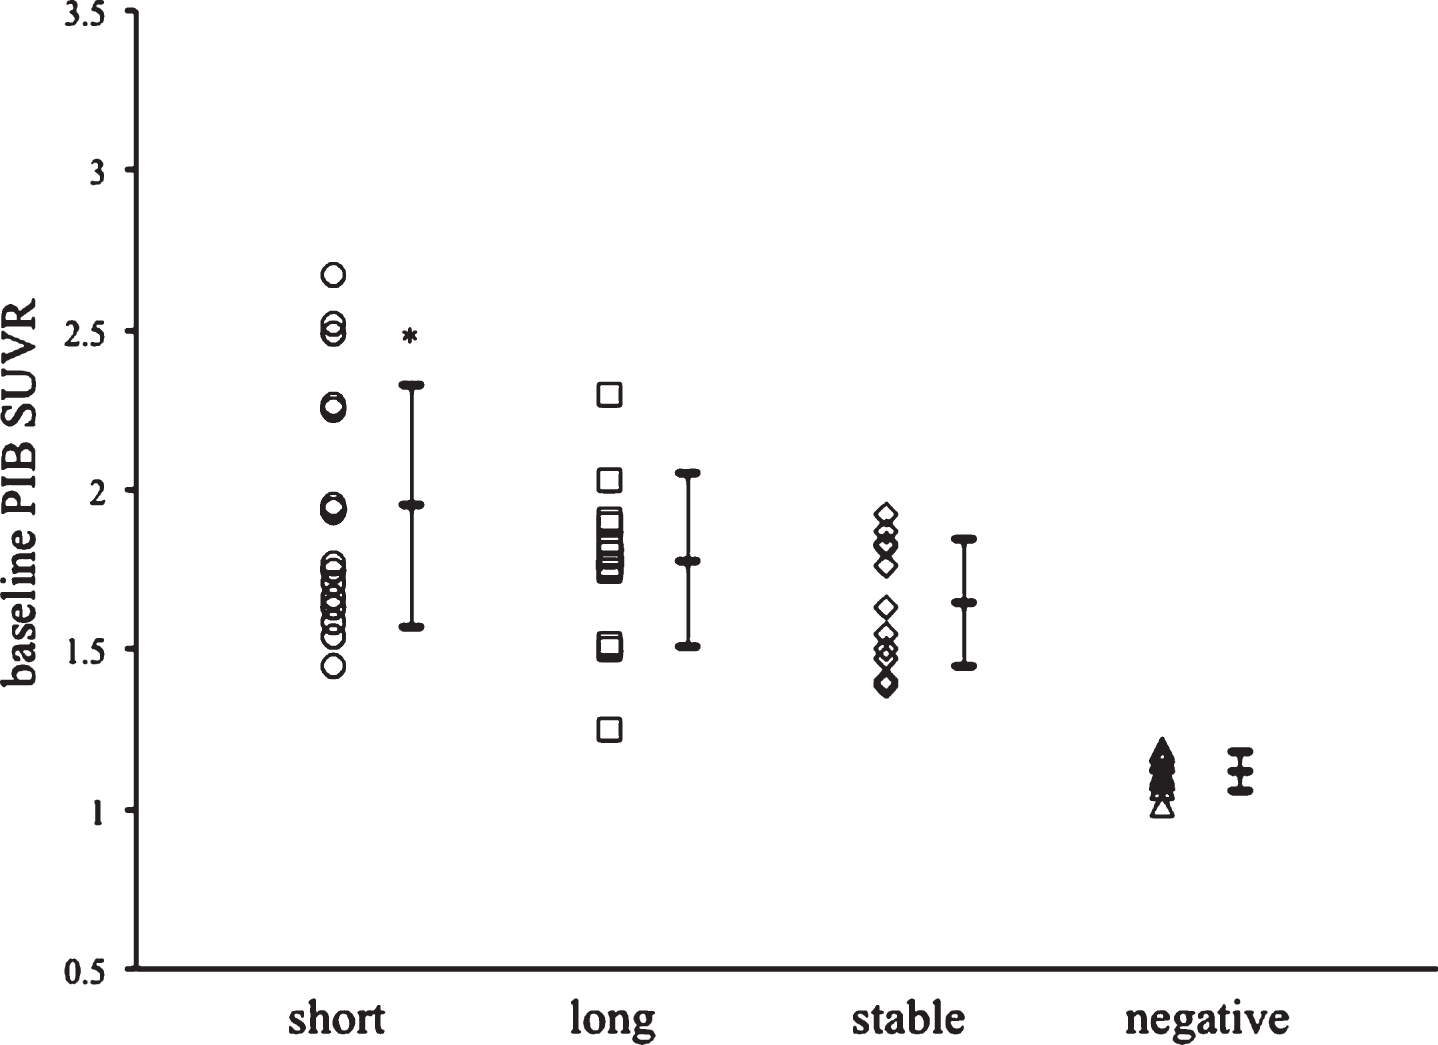
Individual and mean cortical PIB SUVR at baseline in MCI due to AD patients with short conversion (circles, n = 16), long conversion (squares, n = 12), stable patients (diamonds, n = 11), and negative MCI patients (triangles, n = 9). Data are presented as mean±SD. *Statistically significant difference by multiple comparisons post hoc tests (p < 0.05). con, conversion.
At last follow-up, the mean cortical PIB SUVR in patients with MCI due to AD significantly increased to 2.00±0.32 (n = 39, p < 0.05) compared to that at baseline. Also, regional PIB SUVR increased in all cortical regions except for the MTC, especially greatest in the Pre (2.44±0.41) (Table 2). In patients with short conversion, cortical PIB SUVR increased to 2.13±0.36 (n = 16, p < 0.05) at last follow-up, being significantly higher than that in patients with long conversion or stable patients.
Change in Aβ deposition
The mean annual rate of change in cortical PIB SUVR in patients with MCI due to AD was 0.044±0.027 per year (n = 39, p < 0.01), which was significantly greater than that in amyloid-negative MCI patients (0.004±0.007, n = 9). This was a mean 2.5% annual rate of increase in cortical PIB SUVR from baseline. However, there was no significant relationship between annual rates of change in cortical PIB SUVR and baseline PIB SUVR among patients with MCI due to AD (r = 0.05, n = 39, p = 0.74). In APOE ɛ4 carries with MCI due to AD, an annual rate of increase in cortical PIB SUVR (0.043±0.021, n = 20) did not significantly differ from that in APOE ɛ4 non-carriers (0.045±0.033, n = 19). Also, there was no significant correlation between the annual rate of change in cortical PIB SUVR and baseline age (r = 0.003, n = 39, p = 0.98). In the patients with MCI who progressed to AD, the annual rate of increase in cortical PIB SUVR until conversion to AD was 0.076±0.078 (n = 28, p < 0.05), being significantly greater than that after conversion (0.013±0.027) (Fig. 2).

Individual and mean annual change in cortical PIB SUVR in MCI patients before and after progression to AD (circles, n = 28) and stable MCI patients (squares, n = 11). Data are presented as mean±SD. *Statistically significant difference by multiple comparisons post hoc tests (p < 0.05).
An annual rate of increase of cortical PIB SUVR in MCI patients with short duration was 0.101±0.094 (n = 16, p < 0.05), which was significantly different from that in patients with long conversion or in the stable patients (Fig. 3). Among cortical regions in MCI patients with short conversion, the annual rates of increase in regional PIB SUVR was significantly greater in LTC, ACG, FC, and Pre than those in MCI patients with long conversion (Table 3).

Individual and mean annual change of cortical PIB SUVR in the MCI patients with short conversion (circles, n = 16) and long conversion (squares, n = 12), stable patients (diamonds, n = 11), and negative MCI patients (triangles, n = 9) during follow-up. Data are presented as mean±SD. *Statistically significant difference by multiple comparisons post hoc tests (p < 0.05).
Annual change of regional PIB SUVR in cortical regions in MCI patients with short conversion and long conversion to AD, and stable patients
n, number of patients; MTC, medial temporal cortex; LTC, lateral temporal cortex; ACG, anterior cingulate; FC, frontal cortex; OC, occipital cortex; PCG, posterior cingulate; Pre, precuneus; PC, parietal cortex; SMC, sensory motor cortex; Cortical, whole cortical regions. Data are presented as mean±SD. *Statistically significant difference from long conversion by multiple comparisons post hoc tests (p < 0.05).
Aβ deposition, cognitive status, and disease progression
When an individual annual change of cortical PIB SUVR was plotted according to the duration of conversion among MCI patients who progressed to AD, the annual change of cortical PIB SUVR was significantly correlated to the duration of MCI progression to AD (r = –0.47, n = 28, p < 0.05) (Fig. 4). In contrast, in the stable patients, the annual change was not significantly correlated to the follow-up duration. Furthermore, the annual changes of cortical PIB SUVR were significantly related to the annual changes of MMSE scores until the progression to AD (r = –0.63, n = 28, p < 0.01) (Fig. 5). In contrast, after progression, the annual changes did not significantly relate to the annual changes of MMSE scores (r = 0.15, n = 28, p = 0.43).

Relationship between annual change of cortical PIB SUVR and period of progression in MCI patients with progression to AD. An annual change is significantly correlated to the period of MCI progression to AD (r = –0.47, n = 28, p < 0.05).

Relationship between annual changes of cortical PIB SUVR and MMSE scores in MCI patients with progression to AD. Annual change of PIB SUVR is significantly correlated to that of MMSE scores (r = –0.63, n = 28, p < 0.01).
DISCUSSION
The present study found that the brain Aβ deposition at baseline was higher in the patients with conversion than that in the stable patients during a follow-up of 5.7±1.5 years. However, there was no significant difference in Aβ deposition at baseline between the MCI patients with short and long conversion. The previous study has shown that higher PIB binding at baseline was detected in the PIB-positive converters during a-3-year follow-up [5]. These findings indicate that the high brain Aβ deposition at baseline is associated with the progression from MCI to AD, but not the period of up to progress to AD.
Recently, the increase rate of brain Aβ deposition have evaluated during the process of progression to AD. Villemagne et al. reported that MCI patients with elevated PIB retention showed significantly faster rates of Aβ deposition (0.049 SUVR per year) during follow-up of 3.8 years [6]. Also, Kemppainen et al. have reported that the 5-year follow-up study using [11C]-PIB PET revealed an increase in PIB uptake from baseline to 2 years (4.7% per year) and from 2 to 5 years (5.0% per year) in MCI patients [13]. However, these studies have not shown, in the patients defined as MCI due to AD, whether the annual rate of increase in Aβ deposition is associated with the progression from MCI to AD or not.
We demonstrated that the patients with MCI with short conversion had significantly greater annual rates of increase in Aβ deposition compared to patients with long conversion or stable patients. The annual rate of increase in Aβ deposition was 0.101±0.094 PIB SUVR per year during a follow-up of 1.7±0.8 years, with a 5.5% annual increase from baseline. Among individual patients with MCI due to AD, in addition, the annual rate of increase in brain Aβ deposition was significantly correlated with the duration of progression from MCI to AD. These findings imply, in the patients defined as MCI due to AD, that the increased annual rate of brain Aβ deposition affects the duration of progression from MCI to AD and a greater annual rate of increase in Aβ deposition progresses to AD with a shorter period. We suggest that the patients with MCI due to AD could quickly progress to AD when they have a greater increased annual rate in brain Aβ deposition.
In the present study, furthermore, the annual rates of increase in regional PIB SUVR among cortical regions in MCI patients with short conversion were significantly greater in the lateral temporal cortex, anterior cingulate, frontal cortex, and precuneus than in those with long conversion. The rate of Aβ accumulation has been reported to be higher within the posterior cingulate, prefrontal cortex, and lateral temporal cortex in PIB-positive participants [14]. Thus, the greater rates of increase in regional Aβ deposition in regional cortical regions, especially the posterior cingulate/precuneus, frontal cortex, and lateral temporal cortex, might be associated with disease progression. The regional patterns of longitudinal increases in Aβ retention are also important in disease progression to AD during the MCI stage.
This study found, in MCI patients who progressed to AD, that an annual increase of brain Aβ deposition before conversion was significantly greater than that after conversion. This implies that patients with MCI due to AD have greater rate of increases in brain Aβ deposition during the process of progression to AD, followed by smaller rates of increase in Aβ deposition at AD stage. Our results support the hypothetical model of the sigmoid-shape trajectory of amyloid PET biomarker with time, proposed by Jack et al. [15], that brain Aβ accumulates more rapidly in the early phase of AD process and then only little or very slowly in the more advanced phase of the disease.
Furthermore, in the present study, an annual rate of increase in Aβ deposition was significantly correlated to an annual rate of decline in MMSE scores among the MCI patients until the progression to AD. A previous study has reported that there was a significant association between the rates of Aβ deposition and memory decline in the MCI patients with a follow-up of 3.8 years [6]. Another study has recently shown that episodic memory decline continued at a constant rate over 18 and 36 months in the preclinical and prodromal stages of AD [16]. Thus, the increased rate in brain Aβ deposition could have a role in cognitive decline during the very early stages of the disease although it might not be a causal role. It is suggested that the greater rate of increase in Aβ deposition accelerates cognitive decline and progression from MCI to AD.
The present study revealed that when the patient with MCI due to AD had the long-term follow-up, 28.2% of them did not progress to AD and 30.8% progressed to AD. The increased rate of Aβ deposition in stable patients was not significantly different from that in MCI patients with long conversion. These findings imply that the lower increased rate of brain Aβ deposition is not related to conversion to AD. The progression from MCI to AD has been reported to be modified by individual factors such as risk amplification genes, age, education, and cognitive reserve [15]. In the present study, there was no significant difference in baseline age, education level, and APOE ɛ4 carriers status between patients with long conversion and stable patients. The factors related to cognitive reserve or other downstream factors could affect cognitive decline and long duration of progression from MCI to AD.
Several Aβ-lowing strategies have been recently developed for clinical use. Excess brain Aβ deposition has been suggested to trigger a downstream mechanism that plays a more direct role in driving cognitive decline and has an effect on symptom progression. The scientific community has shifted its focus to target patients in the earlier stage of the disease continuum, because those patients are more likely to benefit from anti-amyloid therapy. The present study demonstrates that 41% of the patients with MCI due to AD progressed to AD within 3 years and 71.8% progressed during a mean long-term follow-up of 5.7 years. The overall conversion rate was 20.7% per year. Therefore, when a patient is identified as MCI due to AD, anti-amyloid therapy needs to be given early in the course of the disease to be effective. Based on our study, if the rate of new Aβ production can be reduced by therapeutic interventions during the MCI stage, production of brain Aβ deposition could be smaller, leading to potentially slower progression to AD.
In conclusion, the great increased annual rate of brain Aβ deposition has an effect on cognitive decline and disease progression at MCI stage before progression to AD. The patients defined as MCI due to AD progress to AD with a shorter duration when they have a greater increased annual rate in brain Aβ deposition, in addition to high Aβ deposition atbaseline.