
Abstract
Background:
Alzheimer’s disease and depression can start with combined cognitive and depressive symptoms [1, 2]. Accurate differential diagnosis is desired to initiate specific treatment.
Objective:
We investigated whether amyloid-β PET imaging can discriminate both entities.
Methods:
This retrospective observational study included 39 patients (20 female, age = 70±11years) with both cognitive and depressive symptoms who underwent amyloid-β PET imaging and in whom clinical follow-up data was available. Amyloid-β PET was carried out applying [18F]Florbetaben or [11C]PiB. The PET images were analyzed by standardized visual and relative-quantitative evaluation. Based on clinical follow-up (median of 2.4 years [range 0.3 to 7.0 years, IQR = 3.7 years] after amyloid PET imaging which was not considered in obtaining a definite diagnosis), discrimination ability between AD-related depression and pseudo-dementia in depression/depression with other comorbidities was determined.
Results:
Visually, all 10 patients with pseudo-dementia in depression and all 15 patients with other depression were rated as amyloid-β-negative; 2 of 14 patients with AD-related depression were rated amyloid-β–negative. ROC curve analysis of the unified composite standardized uptake value ratios (cSUVRs) was able to discriminate pseudo-dementia in depression from AD-related depression with high accuracy (AUC = 0.92). Optimal [18F]Florbetaben discrimination cSUVR threshold was 1.34. In congruence with the visual PET analysis, the resulting sensitivity of the relative-quantitative analysis was 86% with a specificity of 100%.
Conclusion:
Amyloid-β PET can differentiate AD-related depression and pseudo-dementia in depression. Prospective clinical studies are warranted to confirm this result and to potentially broaden the spectrum of clinical applications for amyloid-β PET imaging.
Keywords
INTRODUCTION
It is known that Alzheimer’s disease (AD) and depressive disorders may clinically manifest, at their early symptomatic stages, with both cognitive and depressive deficits [1, 2].
For the coexistence of cognitive deficits in case of depressive disorders, the term “pseudo-dementia” is established [3]. In pseudo-dementia, cognitive deficits are typically not showing substantial progression over time and are potentially reversible, when remission of the depressive disorder is achieved [4, 5].
Also, recent studies are indicating that anti-depressive treatment options may diminish cognitive impairment caused by depressive disorder [6]. Despite ultimate treatment consequences, clinically, the differential diagnosis between AD-related depression and pseudo-dementia in depression is challenging [7]. So far, employing [18F]fluorodeoxyglucose (FDG) positron emission tomography (PET) imaging is recommended for this purpose [8]. The use of FDG is based on the fact that brain metabolism shows a typical reduction pattern in AD which is different from the pattern in pseudo-dementia in depression [9–11]. Nevertheless, studies evaluating the diagnostic power of FDG PET imaging for this purpose are, to the best of our knowledge, sparse. Interestingly, Panegyres et al. reported a sensitivity of only 18% (95% CI: 0–41%) and a specificity of 100% (95% CI: 99 –100%) of FDG PET for the diagnosis of pseudo-dementia in depression in a prospective sample of 102 suspected early-onset demented elderly individuals [12].
In the last years, PET imaging of amyloid-β aggregates has emerged as a valuable tool to support the diagnosis of AD [13]. Our and other groups were able to demonstrate a high diagnostic accuracy of amyloid-β PET to diagnose AD, for which either the clinical [14] or the histopathological [15] diagnosis were taken as standard of truth. As the amyloid-β cascade theory hypothesizes neurodegeneration (as measured by FDG PET) being a consequence of amyloid-β pathology [16], amyloid-β PET should, theoretically, be more sensitive than FDG PET also in the differential diagnosis between AD-related depression and pseudo-dementia in depression.
Two former studies investigated the association between [18F]FDDNP (a combined amyloid-β and tau PET tracer [17]) binding and depressive phenotype. Lavretsky et al. reported a significant relationship between geriatric depression scale scores and [18F]FDDNP binding values in a cohort of non-demented individuals in the medial temporal lobe [18]. Similarly, Kumar et al. found a significantly higher global [18F]FDDNP binding level in a group of individuals with major depressive disorder compared to controls [19]. It can be speculated that the above results obtained with [18F]FDDNP are to a relevant part caused by tau binding of the tracer. To our knowledge, the potential of specific amyloid-β PET imaging to discriminate between AD-related depression and pseudo-dementia in depression has not been systematically studied yet. To address this question, the present study was initiated. We hypothesized that amyloid-β PET imaging is able to discriminate between AD-related depression and pseudo-dementia in depression.
MATERIALS AND METHODS
Our retrospective observational case control study was carried out in accordance with the Declaration of Helsinki. This data analysis was approved by the local Ethics Committee. All participants provided written informed consent for the post-hoc scientific analysis of their brain scans. We searched our brain PET imaging databases for patients: 1) who underwent amyloid-β PET imaging, 2) who, at the time-point of PET imaging, presented with both cognitive deficits (at least of the degree of a mild cognitive impairment as defined by the revised NINCDS/ADRDA criteria [20]) and depressive symptoms (at least of the degree of a minor depression as defined by the DSM IV) [21], and 3) in whom at least one clinical follow-up assessment of both the cognition and the depressive phenotype was available. Our search resulted in 39 subjects (20 females, age 70±11 years), who underwent amyloid-β PET imaging between 2012 and 2017. With regard to the clinical cognition testing at the time-point of referral to the amyloid-β PET imaging, 20 subjects were diagnosed with mild cognitive impairment, 15 patients with possible Alzheimer’s disease dementia (ADD), and 4 patients with probable ADD according to the revised NINCDS/ADRDA criteria [20]. The Mini-Mental State Examination (MMSE) scores were at a median of 27 (range 4 to 30, IQR = 3). With regard to the clinical depression testing, 11 subjects presented with major depression, 26 subjects with minor depression, and 2 subjects with bipolar disorder according to DSM IV [21]. A median of 2 (range 1 to 13, IQR = 2) clinical follow-ups were documented. Clinical follow-up period was at a median of 2.4 years (range 0.3 to 7.0 years, IQR = 3.7 years) after the amyloid-β PET imaging. Clinical follow-up assessment was done by neuropsychiatry specialists of secondary and tertiary dementia and depression care centers. It comprised a 3-item (increase versus stable versus decrease of symptoms) evaluation of change in severity of cognitive and depressive symptoms over time. Steady and irreversible increase of cognitive impairment with mostly constant depressive symptoms were interpreted as AD-typical. Pseudodementia in depression and/or depression with other comorbidities were stated in patients with 1) fluctuating (between at least two follow-ups) depressive symptoms with corresponding short-termed inconsistent changes of cognitive impairment, and/or in patients with 2) successful antidepressant/neuropsychiatric medication with stabilization or decrease of cognitive and depressive symptoms during follow-ups. The use of anti-dementia and anti-depressive drug medication as well as other neuropsychiatric medication was documented. After the last follow-up per patient, a definite diagnosis was reached, taking all available longitudinal clinical data into account, including drug-treatment, cognitive and depression testing scores as well as medial temporal atrophy /cerebrospinal fluid AD biomarker information. The baseline amyloid PET imaging information was not considered when deriving the definite diagnosis.
Amyloid-β PET imaging was performed on a hybrid PET/MRI (Siemens Biograph mMR; Erlangen, Germany) system after the administration of standard doses of [18F]Florbetaben (n = 30) or [11C]Pittsburgh Compound B (PiB) (n = 9). Static 90-110 min p.i. ([18F]Florbetaben) or 40-70 min p.i. ([11C]PiB) PET images were acquired. Details of the PET data reconstruction, correction, and processing are described elsewhere [22]. The resulting PET images were analyzed visually and relative-quantitatively by experienced readers who were certified for reading [18F]Florbetaben scans. Visual analysis resulted in binary (amyloid-β-positive or -negative) categorization. Relative-quantitative analysis was done using the BRASS software on a Hermes Medical Solution (Stockholm, Sweden) workstation. As described previously [14], composite standardized uptake value ratios (cSUVRs) were determined by averaging the SUVRs (reference region = cerebellar cortex) of the bilateral frontal, parietal, lateral temporal, occipital and cingulate cortices. In order to unify the cSUVRs for the two different amyloid-β tracers used, the cSUVRs for [11C]PiB were transformed to [18F]Florbetaben cSUVRs using the established equation:
cSUVR [18F] Florbetaben = (cSUVR [11C] PiB + 0.32)/1.32 [22]
Statistical analysis was carried out using SPSS version 25 (IBM Inc., Amonk, NY, USA). Comparisons of the demographic, clinical, and relative-quantitative PET imaging data between the study subgroups were done using ANOVAs and Chi-square testing. Bonferroni-adjusted post-hoc testing for comparison of the relative-quantitative PET imaging data and for comparison of initial MMSE scores between subgroups was carried out. Receiver operating characteristic (ROC) curves were analyzed to evaluate the potential of the relative-quantitative PET data to discriminate between the study subgroups. p values < 0.05 were considered significant.
RESULTS
According to clinical follow-up, 10 patients (26%) were categorized with pseudo-dementia in depression, 14 patients (36%) with AD-related depression, and 15 patients (38%) with depression with other comorbidities. In the subgroup of depression with other comorbidities, the following comorbidities with possible influence on cognition were found: six patients with suspected other psychiatric disorder, two with epilepsy [23, 24], one with Lewy body dementia, and five with vascular disorder. One patient presented clinically with indefinite comorbidity and was therefore also added to this subgroup. The baseline demographic and clinical data for all patient subgroups are provided in Table 1.
The study cohort was categorized according to the final (after clinical follow-up) diagnosis. If not stated otherwise, data are mean value±standard deviation. AD, Alzheimer’s disease; MCI, mild cognitive impairment; ADD, AD dementia; MMSE, Mini-Mental State Examination; IQ, inter-quartile
Age at image acquisition differed between the subgroups with the AD-related depression patients representing the oldest subgroup, followed by the depression with other comorbidities and the pseudo-dementia in depression patients. Gender, initial cognition, and initial depression diagnoses did not differ between the study subgroups. Initial MMSE scores (available in 31 cases) were significantly lower for the AD-related depression group as compared to the depression with other comorbidities group (21±9 versus 27±2, p = 0.031). There was no statistical significance for initial MMSE scores between the AD-related depression group and the pseudo-dementia in depression group (21±9 versus 26±3, p = 0.14). There were no differences in the periods of clinical follow-up. While only patients with the final diagnosis of AD-related depression used anti-dementia drugs, the use frequency of anti-depressive and other drugs did not differ between the subgroups.
With regard to the visual analysis of the PET scans, all 10 patients with pseudodementia in depression and all 15 patients with depression with other comorbidities were rated as amyloid-β-negative. In contrast, 2 of the 14 patients with the clinical follow-up diagnosis of AD-related depression were rated amyloid-β negative. This led, for the discrimination between pseudo-dementia in depression versus AD-related depression, to a sensitivity of 86% and a specificity of 100%. Two amyloid-β PET cases are shown in Fig. 1. With regard to the relative-quantitative PET data analysis, the distribution of the cSUVRs for all subgroups is shown in Fig. 2. ANOVA showed significant differences between the cSUVRs of the subgroups (p < 0.001). According to Bonferroni-adjusted post-hoc analysis, the cSUVRs of the AD-related depression patients were significantly higher as compared to those of the pseudo-dementia in depression patients (1.55±0.29 versus 1.10±0.13, p < 0.001). Similar differences were found comparing the AD-related depression versus the depression with other comorbidities patients (cSUVR: 1.11±0.10, p < 0.001). There was no significant cSUVR difference between the pseudo-dementia in depression and the depression with other comorbidities patients (p = 1.00). The ROC curve analysis for the cSUVR-based discrimination between the pseudo-dementia in depression versus AD-related depression subgroups resulted in an area under the ROC curve of 0.92, with an optimal discrimination cSUVR threshold of 1.34. Employing the established [18F]Florbetaben to Centiloid transformation equation [22], this threshold corresponds to 51 Centiloids. Applying this threshold resulted, as with the visual PET image analysis results, in a sensitivity of 86% and a specificity of 100% in discriminating pseudo-dementia in depression versus AD-related depression.

Two paradigmatical cases with different amyloid-β PET findings and different clinical follow-up. Coregistered [18F]Florbetaben amyloid-β PET/T1-MPRAGE MR images. For the study cohorts in this project, optimal [18F]Florbetaben cSUVR discrimination threshold was found to equal 1.34. cSUVR = composite standardized uptake value ratios (reference region: cerebellar cortex). AD, Alzheimer’s disease; MMSE, Mini-Mental State Examination; Yrs, years.
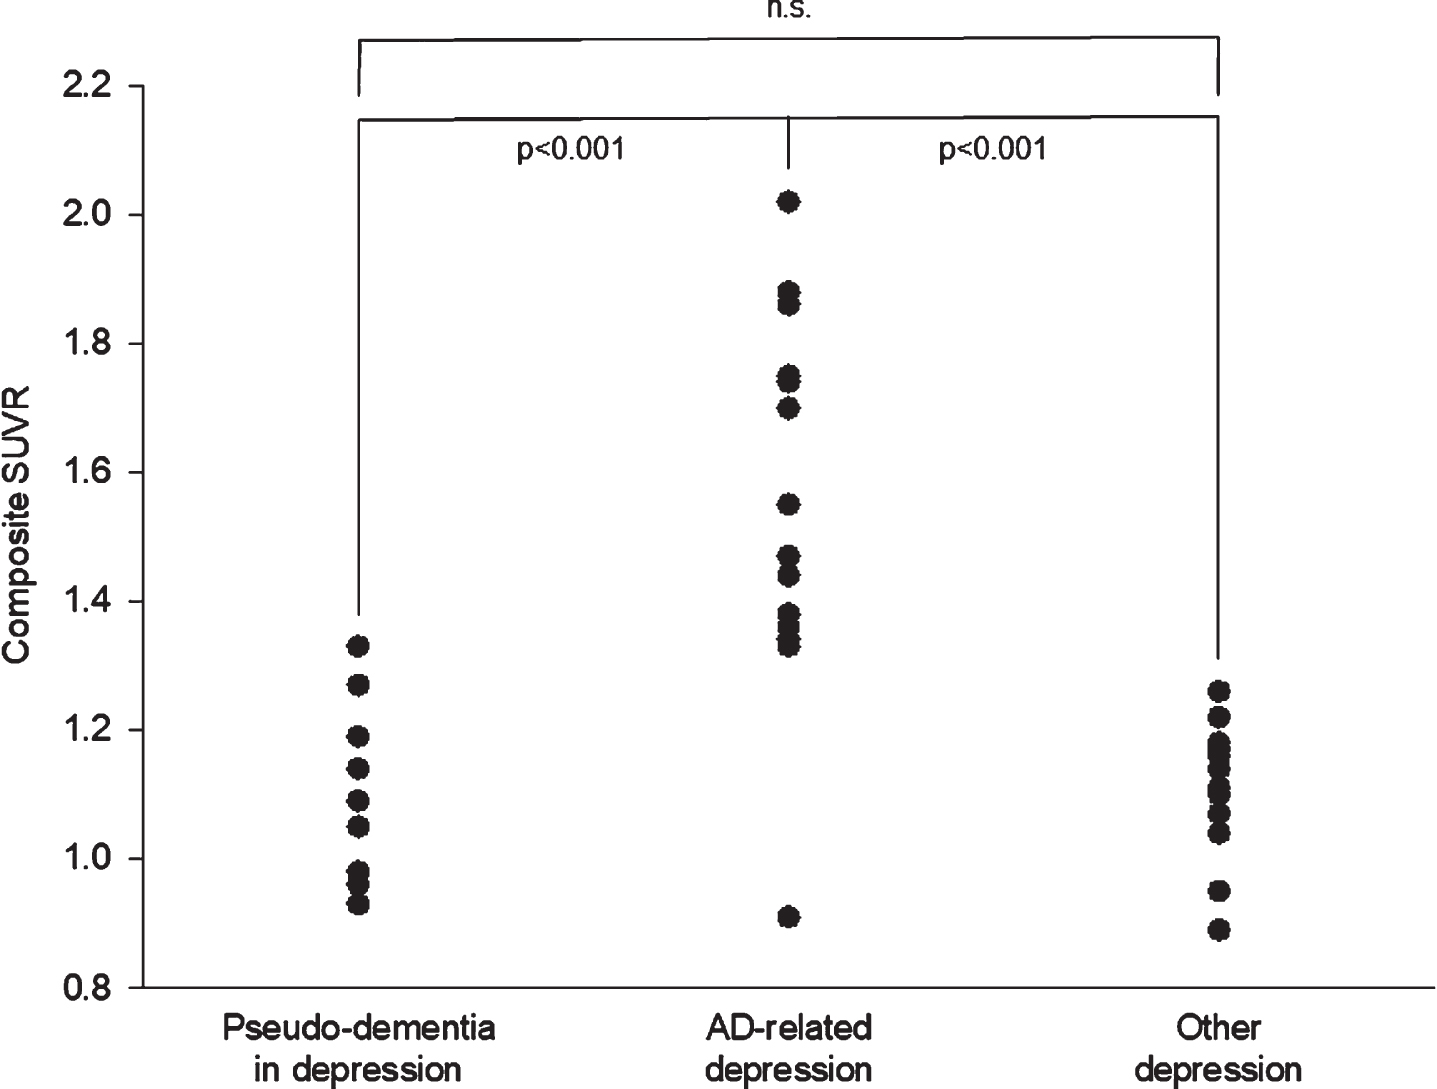
Individual [18F]Florbetaben amyloid-β PET composite standardized uptake value ratios (SUVRs, reference region: cerebellar cortex) in relation to the final diagnosis after clinical follow-up. Note that the low SUVR dot for the Alzheimer’s disease (AD)-related depression subgroup represents two subjects.
DISCUSSION
In this retrospective study, we investigated the potential of amyloid-β PET imaging technique to discriminate AD-related depression from pseudo-dementia in depression in subjects who initially presented with both cognitive and depressive symptoms. Clinical follow-up served as standard of truth. Both visual and relative-quantitative PET data analysis was able to discriminate both entities with high sensitivity and specificity.
To our knowledge, this is the first study addressing this question. With a slightly different focus, numerous PET studies investigated the relationship between depressive phenotype, cognitive impairment, and AD pathology. The use of amyloid-β PET imaging in this context is based on the assumption that amyloid-β aggregates are causal for subsequent AD-typical changes like tau pathology, neurodegeneration, and subsequent neuronal dysfunction. In a prospective cohort study, Villemagne et al. found evidence that amyloid-β accumulation in AD itself seems to be a slow process, seemingly starting two decades before clinical manifestation [25, 26].
Interestingly, a number of studies reported elevated amyloid-β tracer uptake in depressed individuals, both with and without cognitive impairment [27, 28]. This raises the assumption that depression either acts as a risk factor or in some cases as an early clinical sign of AD [29, 30]. Indeed, depressive symptoms were found to be an accelerating factor of conversion from MCI to AD dementia in amyloid-β-positive patients [31]. However, Madsen et al. investigated the [11C]PiB uptake in a group of cognitive normal patients 6 years after their first event of a major depressive episode and found no significant elevation of tracer uptake values, compared to healthy individuals [32]. Also, Babulal et al. found in a cohort of cognitively normal individuals that depressive symptoms were not associated with the amyloid-β PET results, but rather with those of tau PET imaging [33]. Furthermore, a neuropathological study in a group of patients with major depressive episode at the time of death found no significant difference in the cerebral amyloid-β plaque and tau tangle counts between cognitively impaired and cognitively normal individuals [34].
These studies implicate that depressive disorders themselves do not correlate with amyloid-β accumulation and therefore, presumably, pseudo-dementia in depression does not present elevated amyloid-β tracer uptake values. This is in line with the results of our study, which found a larger portion (69%) of cases of partially reversible cognitive impairment in depressed elderly individuals with normal cortical amyloid-β levels, hence cases not caused by AD pathology.
Most recent studies suggest that major depression and AD share oxidative stress as a central biochemical mechanism, which can be caused by inflammatory cytokines triggered by mental-affective diseases, threatening life events, and similar. Seemingly, the genomic vulnerability decides whether the initially resulting symptoms are rather presenting as depressive disorder or cognitive impairment [35]. This interesting feature should be further investigated by imaging neuroinflammation, for instance by TSPO PET tracers.
Regardless, our findings underline the high complexity of the relationship of depression and AD. In contrast to the above literature, our study investigated how well amyloid-β PET imaging is able to differentiate between pseudo-dementia due to non-AD pathology and cognitive impairment due to AD pathology. Our findings support the utility of amyloid-β PET imaging to answer this question in vivo.
As such, we see potential—providing the replication of our study results in prospective trials—of broadening the spectrum of current clinical routine amyloid-β PET indications [36].
As limitations of our study, due to the retrospective nature of our investigation, we were only able to include a rather heterogeneous and small cohort. Also, time-intervals and duration of clinical follow-up differed between subjects. We tried to overcome these limitations by carefully reviewing the clinical presentation of the patients past PET acquisition to ensure that the clinical diagnosis is based on the long-term development of the symptomology of patients. To implement these retrospective long-term data, we conducted a three-item-based system of data interpretation, regarding the assessed depressive and cognitive symptoms, which ensures the clinical diagnosis as gold standard.
Altogether, the pathological pathways of AD and major depression and their connection with each other persist to be a challenging field that requires further research. Additional studies are needed to investigate the underlying mechanisms of reversible cognitive impairment in depressed patients and, specifically, to further examine the links between depressive disorder, cognitive impairment, and brain amyloid-β pathology.
In conclusion, amyloid-β PET imaging seems to be able to differentiate between AD-related depression and pseudo-dementia in depression. Prospective clinical studies answering this question are thus justified to potentially broaden the spectrum of clinical applications of amyloid-β PET imaging.
Footnotes
ACKNOWLEDGMENTS
We would like to thank our patients and their caregivers for supporting this project. Special thanks to Frank Tietze, Birk Eggers, Stephan Weber, Gabriela Pradel, Henrik Pradel, and Jörg Berrouschot for giving us insights into the clinical follow-up of the patients.