



Abstract
Amyloid deposition occurs in aging, even in individuals free from cognitive symptoms, and is often interpreted as preclinical Alzheimer’s disease (AD) pathophysiology. YKL-40 is a marker of neuroinflammation, being increased in AD, and hypothesized to interact with amyloid-β (Aβ) in causing cognitive decline early in the cascade of AD pathophysiology. Whether and how Aβ and YKL-40 affect brain and cognitive changes in cognitively healthy older adults is still unknown. We studied 89 participants (mean age: 73.1 years) with cerebrospinal fluid samples at baseline, and both MRI and cognitive assessments from two time-points separated by two years. We tested how baseline levels of Aβ42 and YKL-40 correlated with changes in cortical thickness and cognition. Thickness change correlated with Aβ42 only in Aβ42+ participants (<600 pg/mL, n = 27) in the left motor and premotor cortices. Aβ42 was unrelated to cognitive change. Increased YKL-40 was associated with less preservation of scores on the animal naming test in the total sample (r = –0.28, p = 0.012) and less preservation of a score reflecting global cognitive function for Aβ42+ participants (r = –0.58, p = 0.004). Our results suggest a role for inflammation in brain atrophy and cognitive changes in cognitively normal older adults, which partly depended on Aβ accumulation.
INTRODUCTION
Low level of cerebrospinal fluid (CSF) amyloid-β 42 (Aβ42) represents a major risk factor for Alzheimer’s disease (AD) [1] but it is also a commonly described feature within clinically normal aging populations [2]. Numerous studies show high concordance between low CSF Aβ42 and high ligand retention on amyloid positron emission tomography (PET), irrespective of clinical status [3] indicating that low CSF Aβ42 reflects amyloid deposition. However, we still do not understand why Aβ42 is related to the development of disease in some persons, while others seem able to cope with substantial amyloid burden. Therefore, many studies point to an inconsistent relationship between Aβ42, brain atrophy as measured with magnetic resonance imaging (MRI), and cognition in aging, which can be caused by other factors that interact withamyloid [4].
In the sense of these interactions with amyloid, neuroinflammation has been proposed as one critical factor. Similar to amyloid deposition, neuroinflammation occurs in both AD and normal aging [5, 6]. Although neuroinflammation is observed in pathologically vulnerable brain regions in AD, it remains unclear whether insoluble Aβ deposits or neurofibrillary tangles are causing inflammation [7] or whether inflammation may actually promote or accelerate deposition of Aβ [8]. In addition, by means of neuropathological studies, we know that increasing age is associated with increased microglial activation accompanied by production of inflammatory cytokines and compromised neuronal function, including synaptic dysfunction [9]. The chitinase-3-like protein 1 (YKL-40) is a CSF biomarker reflecting neuroinflammation [10]. Some studies have reported higher YKL-40 levels in AD [11], and these increases have also been associated with conversion to dementia [10, 13]. YKL-40 has also been related to brain atrophy in AD [14, 15]. However, the capabilities of YKL-40 to distinguish AD from controls have so far been found to be moderate in comparison with other CSF-markers such as total tau (T-tau), phosphorylated tau (P-tau), and Aβ42 [16], and some report no relationship with AD [17, 18]. This may suggest that YKL-40 levels correlate with brain and cognitive processes just as much in normal aging asin AD.
In the present study, we tested the role of neuroinflammation in cortical atrophy and cognitive change in older adults without cognitive symptoms with either abnormal or normal amyloid status. For this purpose, we used baseline measures of Aβ42 and YKL-40, a measure of the brain cortical thickness and the scores of cognitive tests. Although there are reasons to expect a relationship between amyloid levels and neuroinflammation, no previous study has directly tested how these biomarkers interact in contributing to brain and cognitive decline in aging. While the role of YKL-40 in normal aging is almost unexplored, previous research on amyloid-related changes in the aging brain are conflicting, with some reporting more atrophy [19–21] in subjects with lower CSF Aβ42 levels and others larger volumes [22], or non-linear relationships [23]. It has also been suggested that the correlations between Aβ42 and atrophy can be different for Aβ42 positive versus negative individuals. This has been described in the Alzheimer’s Disease Neuroimaging Initiative (ADNI) database [24, 25], but has to our knowledge not been tested in other samples. With regard to cognitive changes, studies indicate that amyloid levels correlate, albeit not strongly, with cognitive function in normal populations [26]. Because of these controversies, it is necessary to study other factors that may show either amyloid-independent or amyloid-dependent relationships to atrophy and cognitive changes.
MATERIALS AND METHODS
Participants
The sample consisted of cognitively healthy older adults undergoing elective spinal surgery under spinal anesthesia and turning 65 years or older the year of inclusion. Exclusion criteria were dementia, previous stroke with sequelae, Parkinson’s disease, or other neurological condition likely to affect cognition. From the full sample recruited (n = 172), we selected those having available baseline CSF measures and both MRI and cognitive evaluation at the two time points (mean time between MRI scans: 2.18 years). None developed mild cognitive impairment at follow up. A total of 89 participants were included in the current analyses. Demographics, including years of education, are summarized in Table 1. The cognitive evaluation was identical at the two time points and included the Word List Memory Task from the Consortium to Establish a Registry for Alzheimer’s Disease battery (CERAD) [27], which was based on recall, the Animal Naming Test (ANT) [28] and the Trail Making Test B (TMTB) [29]. These tests represent verbal memory, verbal fluency, and executive function. We also report here the results of the Mini-Mental Status Examination (MMSE) [30]. In addition, the Clock Drawing Test [31] and Kendrick Object Learning Test [32] wereadministered, but were not included here because they tend to be less sensitive to variation in cognitively healthy samples.
Demographics, cognitive, and CSF data of the participants included in the analyses
MMSE, Mini-Mental State Examination; WMH, white matter hypointensities; TMTB, Trail Making Test –B; ANT, Animal Naming test; CERAD, Word list memory task from the consortium to establish a registry for Alzheimer’s disease battery. +Missing data of n = 1 subject; *excluded 1 subject below detection limit.
Ethical considerations
The study was conducted in accordance with the Declaration of Helsinki and approved by the Regional Committee for Ethics in Medical Research in Norway (REK 2011/2052). All participants provided written informed consent.
Rates of change and cognition factor
We computed the annual rate of change in the scores obtained from the cognitive tests using the symmetrized annual percent change. These values were obtained as the difference in scores between time points divided by its mean and by the time between them. The obtained scores are referred to as: CERAD-change, ANT-change, and TMTB-change.
We also calculated a global cognition change factor using principal component analysis on the rates of change obtained from the three tests. We used the first component, explaining the largest amount of variance. We refer to this score as COGfac-change.
CSF measures
CSF samples were taken at the time of the induction of spinal anesthesia. CSF was collected in polypropylene tubes, centrifuged, the supernatant aliquoted in polypropylene vials, frozen as soon as possible, and stored at –80°C pending analyses. CSF levels of Aβ42, T-tau, and P-tau were determined using INNOTEST enzyme-linked immunosorbent assays (Fujirebio, Ghent, Belgium). YKL-40 concentrations were measured using a commercially available ELISA (R&D systems, Minneapolis, MN). All analyses were performed by board-certified laboratory technicians, who were masked to clinical data, using one batch of reagents with intra-assay coefficients of variation below 10%.
Magnetic resonance imaging
In each scanning session, a T1-weighted MPRAGE 3D image was acquired in a 1.5T Siemens Avanto scanner using a 12-channel head coil (TR = 2400 ms, TE = 3.79 ms, slice thickness = 1.20 mm, pixel spacing = 1.25×1.25 mm).
MRI processing
Structural MPRAGE scans were processed with FreeSurfer (version 5.3) and its longitudinal stream (https://surfer.nmr.mgh.harvard.edu). The standard FreeSurfer pipeline performs a set of automated procedures for the cortical reconstruction and volumetric segmentation of the individual scans [33, 34]. In addition, the FreeSurfer longitudinal stream includes a set of methods designed to minimize the bias to any time point and which has been shown to lead to increased statistical power, better separation of groups based on atrophy and higher reproducibility [35–37]. Using these tools, we obtained vertex-wise maps of symmetrized atrophy rate, defined as the normalized difference in thickness at each vertex per year. FreeSurfer reconstructed brain surfaces were visually inspected and manually corrected when necessary. Manual interventions included the removal of non-brain areas and the use of control points to guide the automated reconstruction of white and pial surfaces. We obtained the volume of WM hypointensities (WMH) from the automated freesurfer subcortical segmentation [34]. WMH appear as dark WM on the T1-weighted image and the overall WMH volume is obtained from the sum of regions within the WM with T1-intensity values within a certain range defined from the probabilistic atlas. This measure is related to WM lesions and vascular disease and it has shown good agreement with manual measurements [38] as well as good reliability in aging cohorts [39]. In addition, we obtained the hippocampal volumes from the same processing stream.
Statistics
In order to test the overall effects of time on cortical thickness, the surface-based data representing thickness change for each subject was fit into a GLM model for group-statistics. We first calculated the mean rate of change between acquisitions for the whole sample, using a one-sample t-test model. We then performed vertex-wise correlations and tested interactions to investigate relationships between thickness, CSF markers, and cognition. First, participants were divided into two subgroups according to their levels of CSF Aβ42, namely Aβ+ (<600 pg/mL) and Aβ–(≥600 pg/mL). Because several cutoff values of CSF Aβ42 levels are described in the literature, ranging from 500 to 650 pg/mL [19, 40–42], we used a rather conservative level of 600 pg/mL, which is in-between the cut-off used in clinical routine in the Clinical Neurochemistry Laboratory and that for amyloid PET positivity [43], and also to accommodate possible variation or bias in the measurements and to ensure a considerable number of subjects within the group of healthy older adults with amyloid positivity.
General linear models (GLM) were used for vertex-wise analyses of cortical thickness change. All statistical maps were corrected for family wise-error (FWE) using precomputed simulated data in FreeSurfer [44]. Significance threshold was set at a p-value of 0.05, both for the initial thresholding of the maps and for the identification of significant clusters. Age and gender were used as covariates in all the surface-based analyses. We first calculated the mean rate of change between acquisitions as symmetrized annual percent change, and then tested whether this was different from zero. Additional GLMs were used to compare rate of change between the amyloid groups, and to test the relationship between thickness change and each variable of interest, i.e., the two CSF biomarkers and longitudinal change in each cognitive test score. To testinteractions, we used a model with two groups (i.e., subjects being positive or negative for Aβ42) and CSF YKL-40 levels or the cognitive score as the continuous variable, and tested whether the slopes of the groups differed.
We tested for group differences in 2-year change in the cognitive scores by use of t-tests. We also used t-test to test for group differences in education and WMH, and used partial correlations, controlling for age and gender, to test whether these variables were related to CSF levels of YKL-40, cognitive scores, or mean cortical thickness. Statistics on non-imaging data were performed with SPSS and MATLABtools.
RESULTS
Demographics and cognitive data
A total of 27 subjects were included in the Aβ+ group and 62 in the Aβ–group. Principal component analysis of cognition change depicted three components, from which the first one, used as global cognition change factor (COGfac-change) accounted for 42.63% of the total variance. There were no group differences in the rates of change in any of the cognitive measures or in baseline CSF YKL-40 and P-Tau or T-tau levels. The results of the TMTB at the second time point differed between groups (t = 2.54, p = 0.016). However, the rates of change within this measure were not significantly different (t = 1.3, p = 0.16). Years of education did not differ between groups (t = 1.43, p = 0.155) and did not correlate with CSF levels, cognitive scores or mean thickness values (p > 0.05 in all tests). In addition, there were no differences between groups in WMH at either time point or in percent change (Table 1), and WMH did not correlate with CSF YKL-40 levels or any of the cognitive measures used (allp’s>0.05).
Mean longitudinal changes in cortical thickness
We observed an average rate of cortical thinning of 0.53% (SD: 1.0%) per year in the full sample. General thinning was observable across large regions of the cortex (Fig. 1). Reductions in cortical thickness were significant (FWE corrected level of p < 0.05) in several clusters located bilaterally in superior parietal, supramarginal, precuneus, isthmus cingulate posterior cingulate, postcentral and paracentral cortices, in the right hemisphere including the superior frontal, caudalmiddlefrontal, inferior parietal, precentral fusiform, and parahippocampal cortices, as well as in left lingual cortex.

A) Mean effects of time on cortical thickness within the full sample. Percentage of thickness change measured between baseline and the 2-years scan. Green-blue areas indicate decreases over time and yellow-red indicate increases (see legend). B) Significant clusters showing the effect of time on cortical thickness after correction for multiple comparisons (p < 0.05).
Aβ42 and cortical thinning
Overall change in cortical thickness did not differ between Aβ+ and Aβ–participants (–0.50% and –0.54%, respectively, t = 0.11, p = 0.91). We used a vertex-wise GLM on the surface to investigate the effect of CSF Aβ42 levels on regional thickness change. Using a between-group comparison, we found that regional change in thickness did not differbetween groups. We then created a design with separate slopes for the relationship between Aβ and thickness change for the Aβ+ versus the Aβ–groups. We found a cluster where this interaction was significant, covering part of the left precentral, left caudal middle frontal and superior frontal cortex (p < 0.05, FWE corrected). In this region, there was a negative relationship between CSF Aβ42 levels and the reduction of cortical thickness in the Aβ+ group, but not in the Aβ–group(Fig. 2).
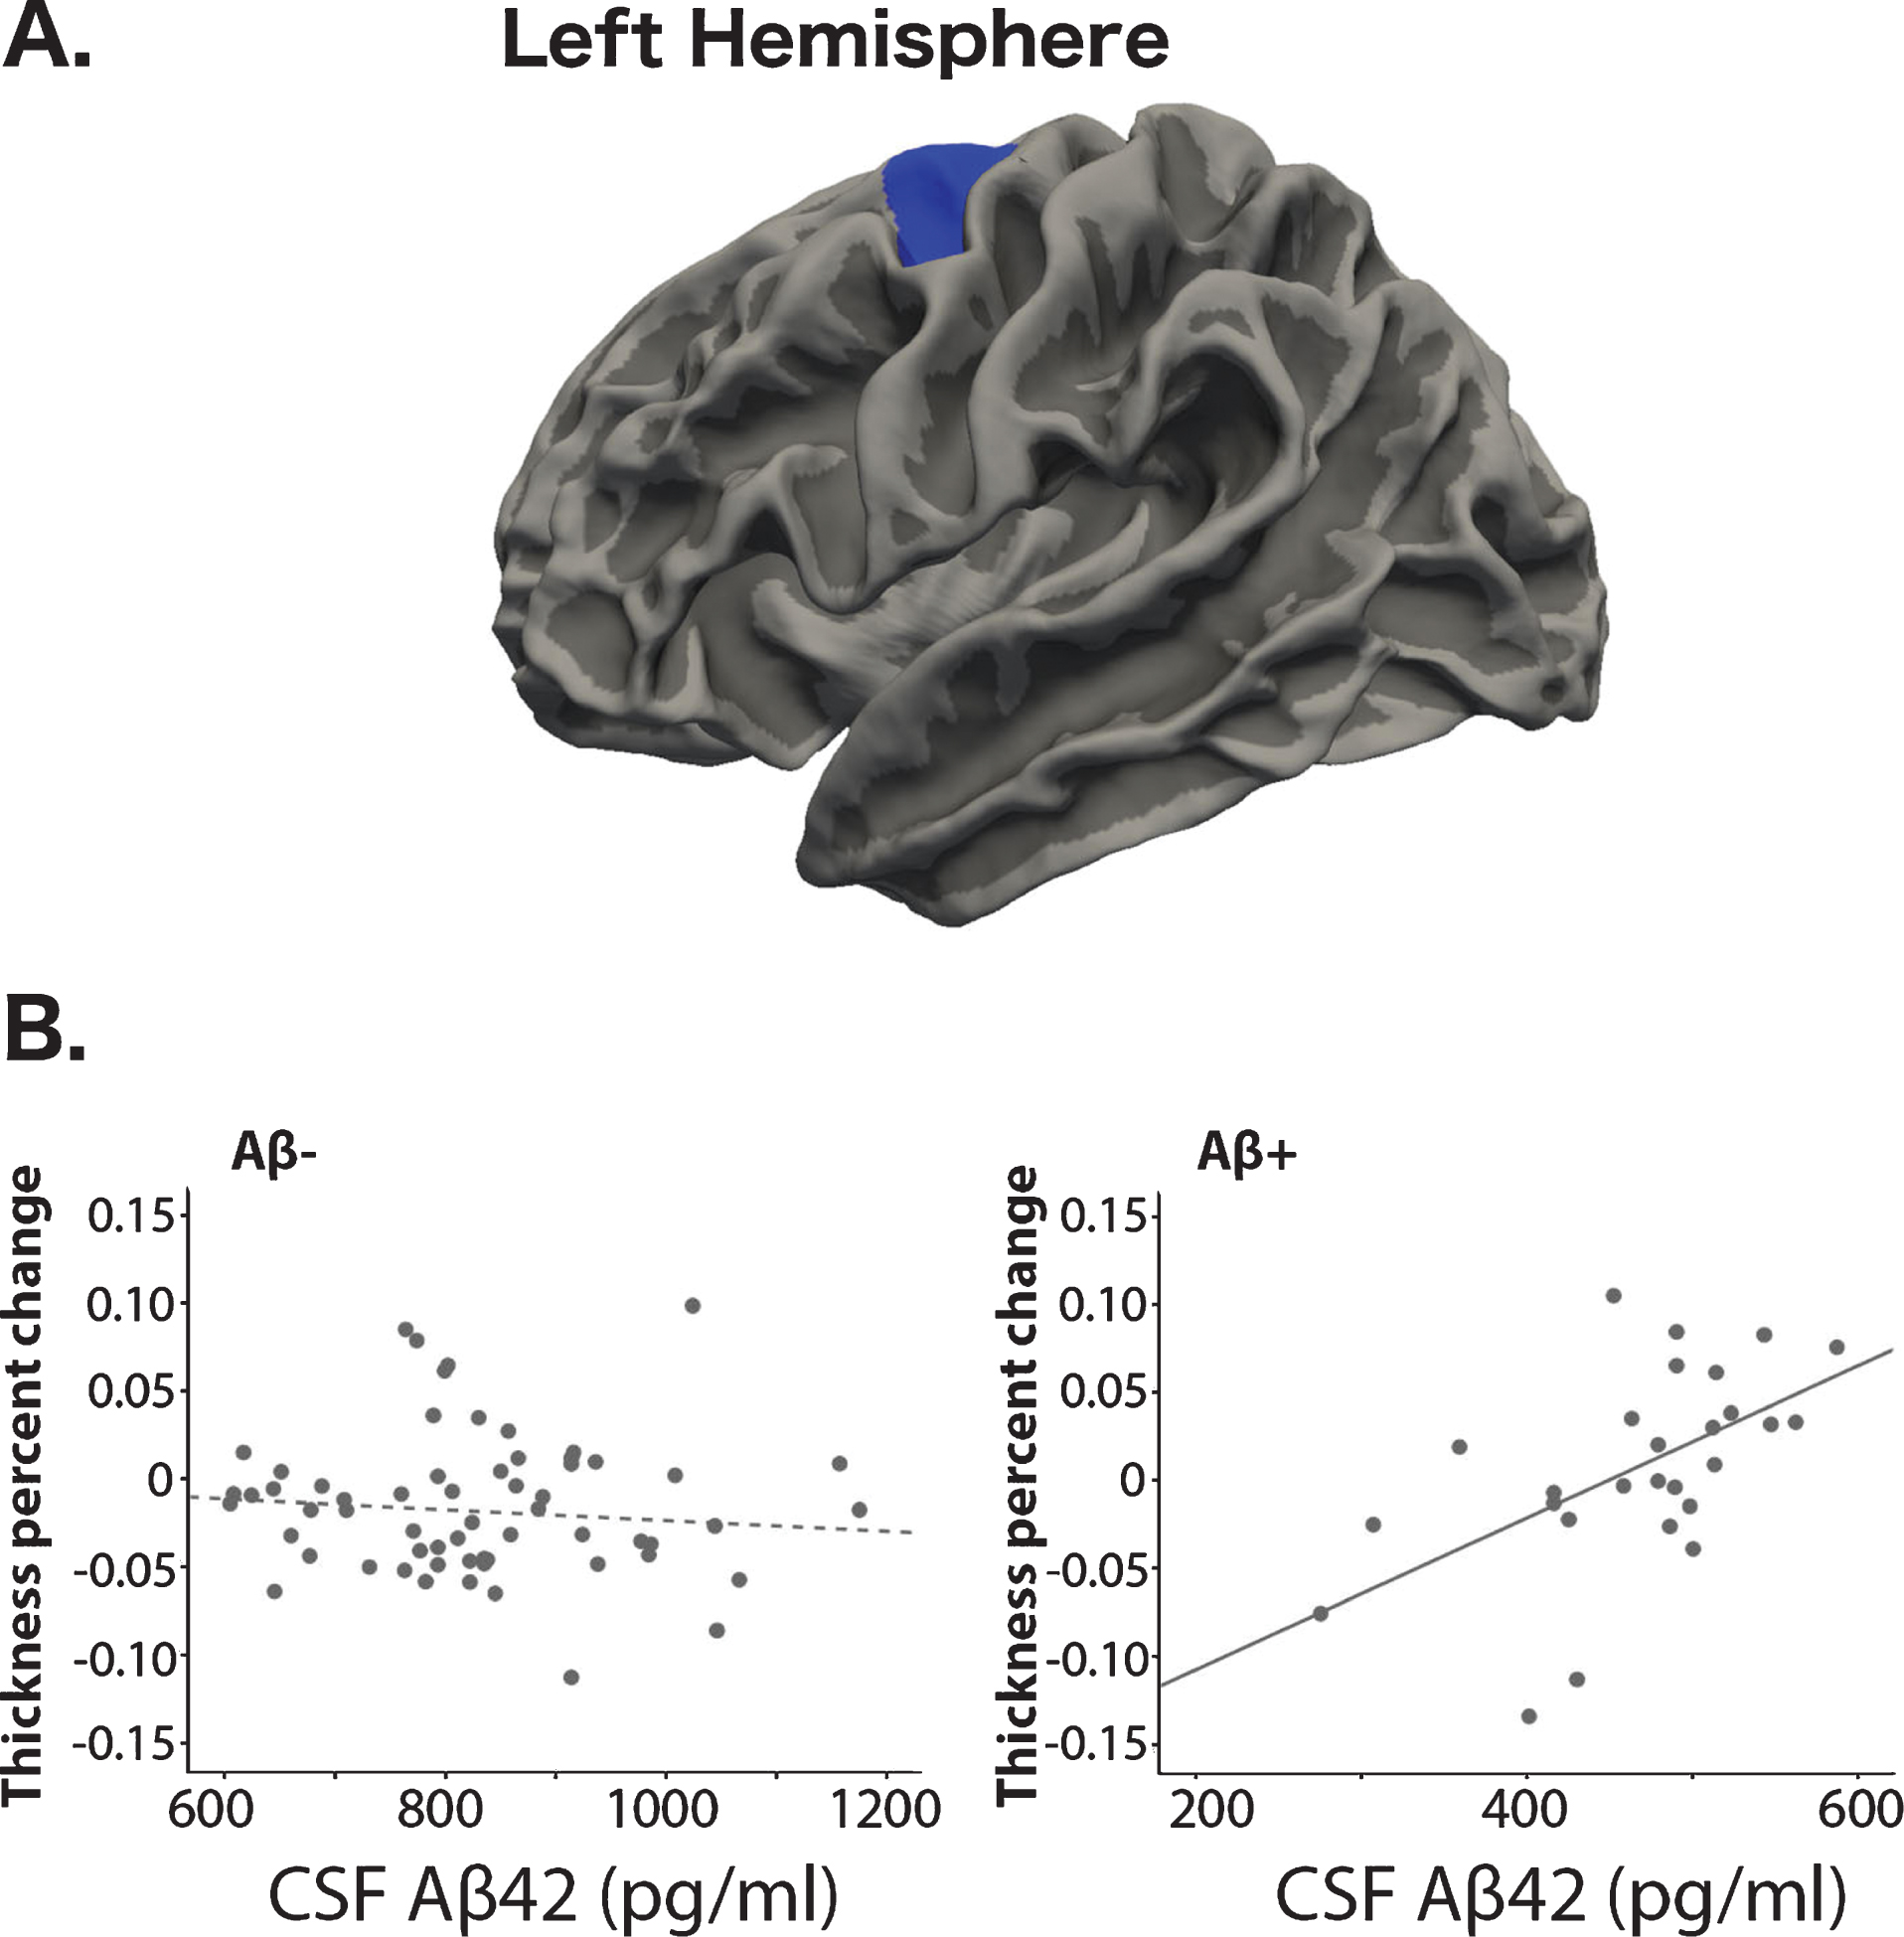
A) Region with a group-interaction with Aβ42 levels and cortical thickness change. B) Scatter plots showing the relationship between thickness change and Aβ42 levels for the two groups separately.
Aβ42 and cognition
Using partial correlations and Aβ42 as a continuous variable, we did not find any relationship between CSF levels of Aβ42 and the global cognitive change or change in any of the specific cognitive measures. More specifically, the correlation with TMTB-change, a test that showed differences between groups at the second time point, was not significant either (r = –0.173, p = 0.115).
YKL-40, Aβ42, and brain measures
We did not find any relationship between YKL-40 levels and change in cortical thickness or CSF Aβ42 levels. In addition, there were no interactions between these three measures. Even if it was not the aim of the current study, we observed that YKL-40 and hippocampal atrophy correlated on a trend level only (Aβ+ p = 0.06/ Aβ–p = 0.09). Therefore, more thorough analyses will be the focus of future studies.
YKL-40 and cognition
Change in the animal naming test (ANT-change) correlated with CSF YKL-40 levels within the whole sample, in that higher YKL-40 levels were related to more decline in the test scores (r = –0.28, p = 0.012) (Fig. 3A). Note that we observed rates of change above zero due to practice effects [45]. No significant correlations between YKL-40 and the other cognitive measures were found, but a trend was observed between YKL-40 and global cognition change (COGfac-change, r = –0.185, p = 0.096).
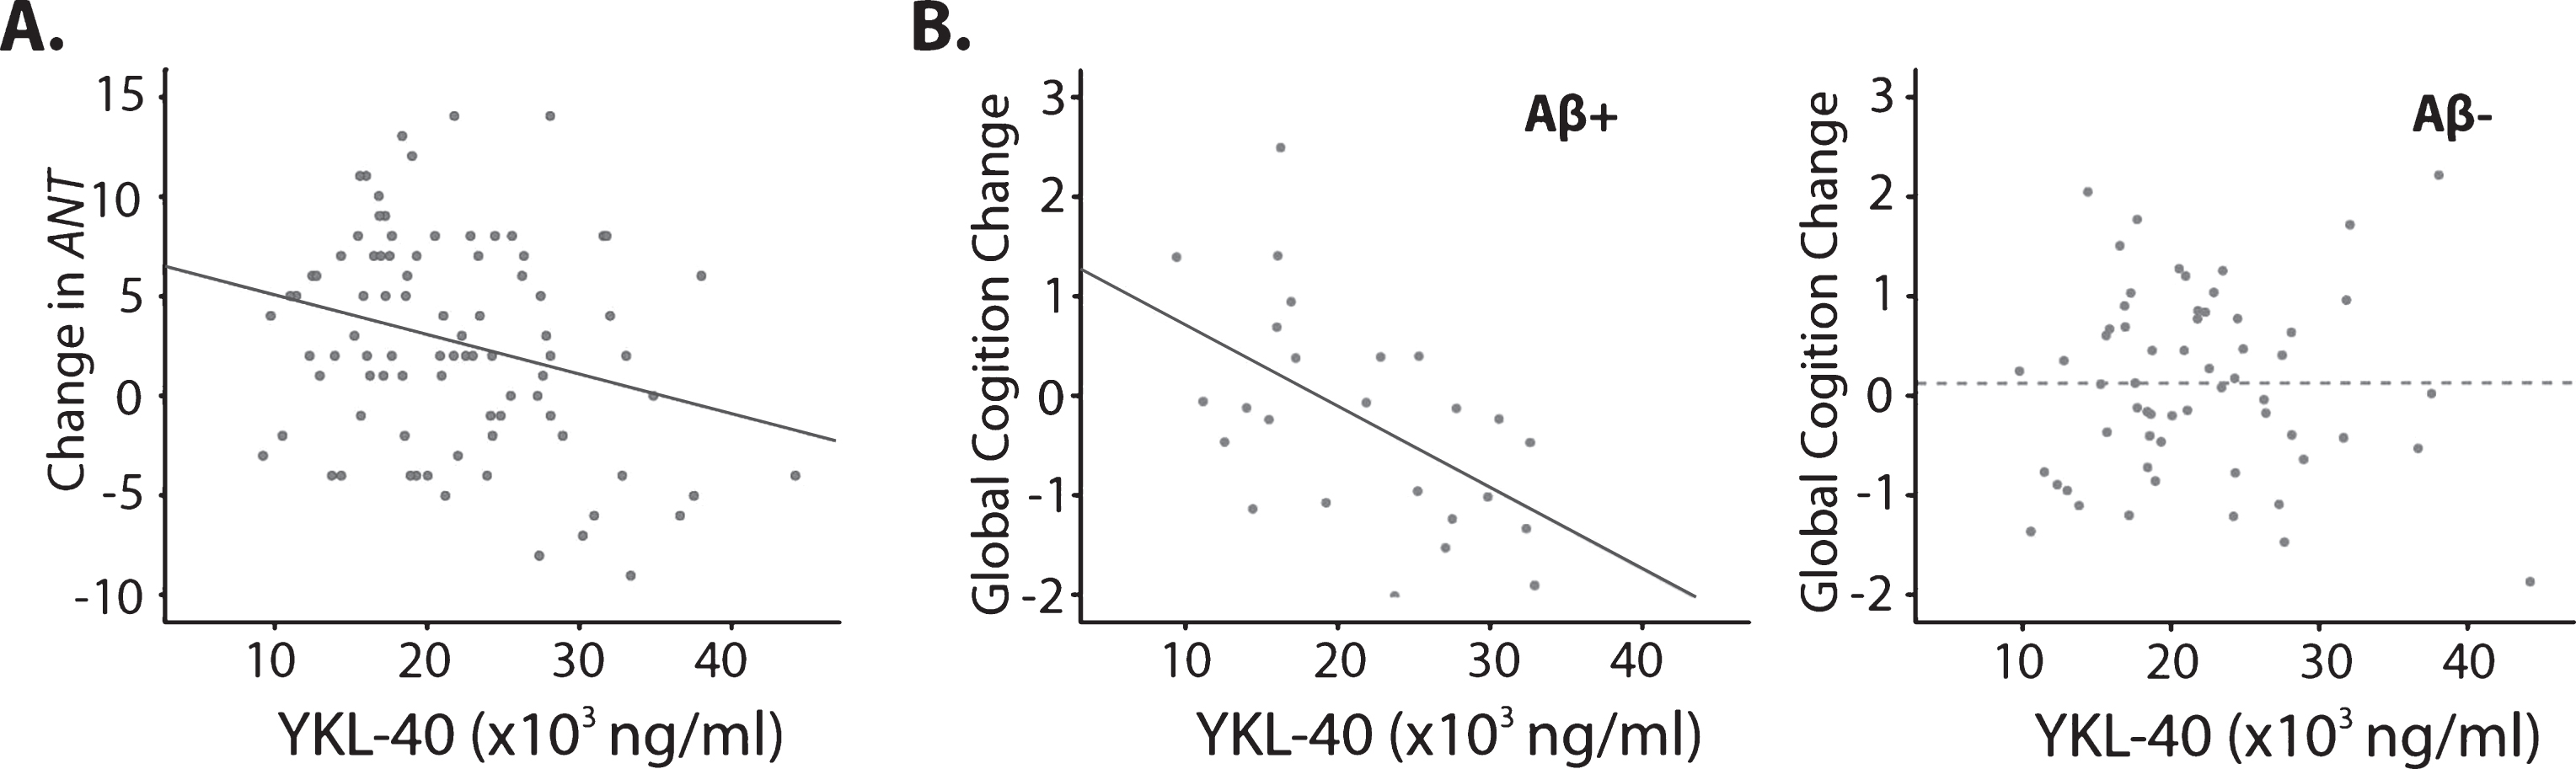
CSF YKL-40 levels and cognition. A) YKL-40 and changes in animal naming test in the full sample. B) Correlation between YKL-40 and global cognition in Aβ+ and Aβ–groups of participants.
Finally, we explored correlations with the CSF YKL-40 levels and cognition in Aβ+ andAβ–participants. In the Aβ+ group, we found a correlation between levels of YKL-40 and the COGfac-change (r = –0.58, p = 0.004, see Fig. 3B). This correlation was not found in the Aβ–group (r = –0.008, p = 0.955). These correlations were significantly different, as evidenced by use of the Fisher r-to-z transformation (z = 2.72, p = 0.0065, two-tailed).
Cortical thickness and cognition
Longitudinal change in cortical thickness correlated positively with change in the results of the animal naming test (p < 0.05), meaning that more thinning was associated with more decline in test scores. We found two significant clusters located in the right hemisphere, covering parts of the supramarginal, postcentral, and inferior parietal cortices (Fig. 4).
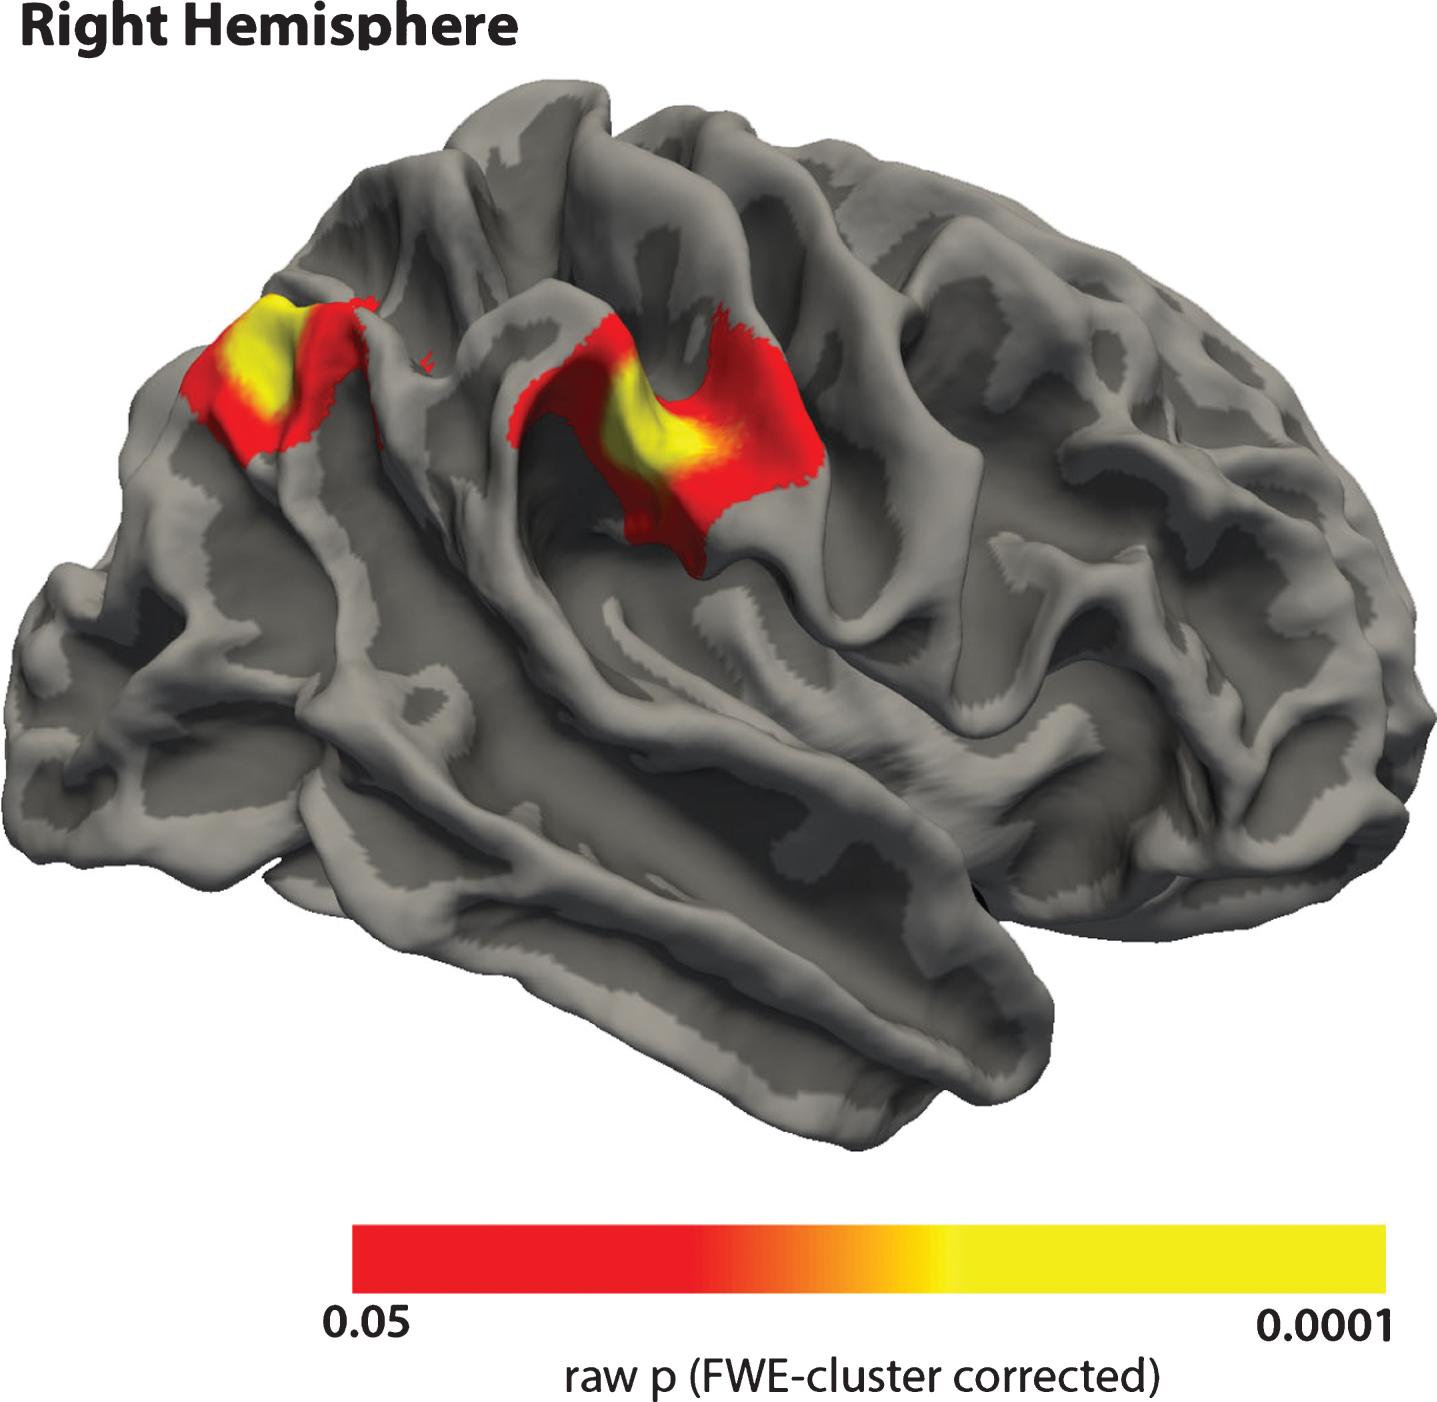
Correlation between change in cortical thickness and change in the results of the animal naming test. Red-yellow areas indicate that changes in thickness and changes in cognition have the same direction. Only results within significant clusters are shown.
Exploring possible single-subject effects
We excluded a single subject having MMSE of 24 at the second timepoint, which was classified into the Aβ–group and we observed that the main results of the study were preserved. Specifically, the correlations between CSF YKL-40 levels and the ANT scores (r = –0.281, p = 0.011), and with the COGfac-change in the Aβ–group (r = 0.103, p = 0.446) were preserved. In addition, the vertex-wise comparisons performed with Freesurfer yielded similar results.
DISCUSSION
In the present study, we showed that neuroinflammation, as indexed by CSF levels of YKL-40, were associated with reduced cognitive function two years later in cognitively normal older adults who were positive for Aβ42. Intriguingly, no relationship was observed for Aβ negative participants. As CSF levels of Aβ42 and YKL-40 were not related, this could indicate that these biomarkers are indicators of distinct processes in the brain that have additive detrimental effects on cognitive function in older adults at risk for AD. In addition, we found that CSF Aβ42 levels correlated with cortical atrophy only in amyloid positive participants. Seen together, these results indicate that mechanisms for brain atrophy and cognitive decline might be different in older adults that are positive in comparison with those negative for amyloid, underscoring the need to understand how amyloid relates to brain atrophy in cognitively normal older adults. The implications of the results are discussed below.
Age-related cortical thinning
We observed a pattern of age-related cortical thinning from baseline to the 2-year follow-up acquisition. This pattern is in accordance with what has been reported in other studies of healthy older adults and justifies the suitability of our sample to study the effect of CSF markers in this population. Higher rates of thinning were observed in areas corresponding to the default mode network, a system that is functionally altered in aging [46]. Interestingly, the higher vulnerability to cortical atrophy in areas of the DMN healthy aging has been already discussedelsewhere [47].
Neuroinflammation and cognition in Aβ+ older adults
Here we used CSF YKL-40 levels as a measure of neuroinflammation and we found that increased levels of this biomarker were correlated with global changes in cognition in the Aβ+ group, indicating that neuroinflammation might play an important role for cognitive changes in older adults with altered amyloid status. In addition, increasing age has been associated with increased microglial activation [9] increased levels of CSF YKL-40 are observed in AD patients [10, 16] but this is not invariably found [17, 18]. However, no studies have previously tested whether this biomarker is increased also in healthy older adults with altered amyloid levels. Intriguingly, our result suggests that even if the level of neuroinflammation as indexed by YKL-40 does not vary as a function of amyloid accumulation, the ability of the brain to cope with the inflammation is different depending on the subject amyloid status. Thus, inflammation is associated with cognitive reduction over time in the presence of higher amyloid levels only, with the lower risk older adults probably being able to better cope with the burden of neuroinflammation. This is not an on-off mechanism, however, as we found that changes in the animal naming test correlated with YKL-40 levels also within the full sample. Thus, the present results indicate that YKL-40 indexes neuroinflammatory processes that have mild but nevertheless detrimental effects on cognitive function in older adults, and that these detrimental effects are significantly larger in participants with increased Aβ42 levels.
Cortical thinning at the different CSF Aβ42 levels
In addition to the Aβ-dependent effects of neuroinflammation on cognition, we found that decreased CSF Aβ42 correlated with cortical thinning in the Aβ+ participants. This further indicate that there might be degenerative processes occurring at this narrow range of Aβ42 levels even in individuals free from clinical symptoms. This pattern has previously been described within the ADNI cohort of normal older adults [24, 25]. These two studies found that only under a certain threshold of Aβ42 levels in CSF, Aβ42 correlated with accelerated brain atrophy. The present study demonstrates this pattern in a different sample than the ADNI database. Taken together, these findings indicate that amyloid positive older adults are less able to cope with processes in the brain that might otherwise not be as harmful in older adults without evidence of brain amyloid accumulation. Previous studies have reported that the anatomical localization of Aβ-atrophy relationships tends to vary and seems to be rather widely distributed (for a review, see [47]). This fits well with the fact that amyloid accumulation in the cortex [48] is less anatomically specific than for instance neurofibrillary tangles, which initially is restricted to the medial temporal cortex. In the present study, the stronger relationship between Aβ42 and cortical thinning in the Aβ42+ group compared with the Aβ42- groups was seen in the motor and premotor cortices, overlapping reported effects from previous studies [21]. However, given the generally widespread distribution of effects in previous studies, we advise against putting too much weight on the precise anatomical location of this effect.
Neuroinflammation, amyloid, and changes in cognition
Previous literature has described null or relatively weak relationships between common CSF AD biomarkers such as Aβ42 and memory/cognition in healthy elderly participants [26, 49]. This has encouraged the community to study the roles of alternative markers in addition to amyloid to better explain cognitive reductions and brain atrophy in aging. Our results, though being moderate in strength, indicate that YKL-40 is one such marker, primarily when seen in coexistence with altered levels of established risk markers such as Aβ42. This fits with theories of amyloid and neuroinflammation working together to cause cognitive decline and brain atrophy in older adults with neurodegenerative conditions such asAD [6], even if the evidence for these theories in humans is scarce and to a large extent based on genetic studies. Further, additive roles of amyloid accumulation and neuroinflammation have not been tested in cognitively normal older adults. The results of the present study suggest that effects of inflammation on cognitive decline in older adults without dementia may partly depend on amyloid status.
Adding to this, we found that decline in the same cognitive test also correlated with longitudinal cortical atrophy. Participants with less capability to maintain or improve performance on the animal naming test showed more decreases in cortical thickness. These results are in accordance with previous studies showing correlations between longitudinal changes in brain structure and changes in cognition [50–52].
Although being related with reductions in cognition, CSF YKL-40 levels did not correlate with cortical thinning. Some previous studies have reported correlations between thinner cortex and higher YKL-40 levels [14, 15] or other markers of inflammation [5], while others did not find relationships with measures of brain structures such as hippocampal volume [53]. The studies mentioned above were all cross-sectional, in contrast to the present longitudinal design. Further, these former studies included patients with mild cognitive impairment or AD, thus not being fully comparable. Still, when the present results are seen in contrast to the identified relationship between amyloid levels and cortical thinning in the amyloid positive participants, it is evident that the relationship between amyloid levels, neuroinflammation, and brain atrophy is complex. To get a deeper understanding of the mechanisms at play, we will likely also need to include additional biomarkers as well as genetic factors in the analyses.
We performed several tests to evaluate the effect of possible factors confounding our results. We first confirmed that excluding one subject with MMSE of 24 at follow-up did not change the findings, and we found that variables such as WMH or years of education were not correlated with CSF markers or cognition.
However, other neuropathological processes than Aβ could be associated with inflammation even in cognitively well-functioning older adults, which should be focus of future studies. Similarly, even if we did not find any relationship between WMH and the CSF measures or cognitive scores, we believe that more accurate measures of white matter lesions can be used to evaluate in a deeper way the effect of cerebrovascular alterations related to CSF markers in aging. Finally, it has been reported that education, and more generally, cognitive reserve, has an important impact on the aging brain, and that it may interact with cortical thickness, CSF biomarkers, and cognition [54]. However, in our study, years of education were not correlated with cognition or CSF scores.
Our study has several limitations. We report significant correlations at the uncorrected level of p < 0.05 and therefore our results need to be considered exploratory. However, taking in account the novelty of the subject and the reduced number of related studies, we believe that our findings add relevant information to the field. In addition, as mentioned, further studies should include a wider range of biomarkers, as well as other variables, including genetic and environmental factors and a higher number of data-points. In this sense, we tested whether years of education had an impact on our results and we did not find significant correlation. However, we believe that further studies are needed to investigate these factors in more detail. Similarly, hippocampal atrophy was related to YKL-40 on a trend level, and these results will be followed up in future studies with more in-depth analyses. Another limitation refers to the characteristics of our sample (participants undergoing spinal surgery), which may be not fully representative of a normal aging population. However, the cognitive scores did not indicate cognitive decline, and the rate of change in cortical thickness, as well as the anatomical pattern of cortical thinning, was comparable to those commonly observed in other samples of healthy aging [50]. We believe this supports the validity of thefindings.
To conclude, one important theory holds that sustained inflammatory responses to amyloid accumulation increase brain atrophy in AD [6, 55], and the increased levels of neuroinflammation observed also in cognitively normal older adults make it important to investigate amyloid— inflammation relationships also in non-demented. Here we found that YKL-40, as a measure of neuroinflammation, correlated with global cognitive decline especially in amyloid positive older adults. In contrast, CSF Aβ42 levels per se did not correlate with cognitive decline, but still were related to brain atrophy in amyloid positive participants. Put together, these findings highlight the need for considering how newer biomarkers interact with the established ones in the study of cognitive and brain changes in aging. This may provide better understanding of the processes that are crucial in the transitional phase between normal aging and neurodegeneration.
Footnotes
ACKNOWLEDGMENTS
The project is funded by the Norwegian National Association for Public Health, Norway. Further, we have received funding from Innlandet Hospital Trust, the Knut and Alice Wallenberg Foundation, the Swedish Research Council, and the Torsten Söderberg Foundation at the Royal Swedish Academy of Sciences. The authors would also like to thank the study participants.
The funding sources had no role in the study design; in the collection, analysis and interpretation of the data; in the writing of the report; or in the decision to submit the article for publication.
