



Abstract
Background:
There is increasing evidence that AD progression differs by sex.
Objective:
The aim of this work was to determine sex differences in the association of baseline levels of cerebrospinal fluid (CSF) biomarkers (Aβ42, p-tau, YKL-40, sTREM2) with longitudinal brain changes in cognitively unimpaired (CU) older adults.
Methods:
This pilot study included 36 CU subjects (age 66.5±5.5, 12 male) scanned twice, two years apart. Using a voxel-wise analysis, we determined the sex differences in the association maps between CSF biomarkers and atrophy rates.
Results:
We did not find differences related to Aβ42. We found a greater impact of the rest of CSF biomarkers in areas of the Papez circuit in women versus men. Men showed greater involvement in lateral parietal and paracentral areas.
Discussion:
Results suggest an early differential progression of brain atrophy between sexes. Further research will elucidate whether the mechanisms responsible for sex-specific atrophy patterns are biological and/or environmental.
Keywords
INTRODUCTION
It is well known that the prevalence of Alzheimer’s disease (AD) is higher in women [1]. As age is the major risk factor for sporadic AD, this difference was thought to be due to women’s longer lifespan. However, there is increasing evidence of sex differences in brain evolution throughout the AD continuum [2–7]. Recent studies have investigated sex differences on amyloid-β and tau deposition, determined by abnormal concentrations of amyloid-β 42 (Aβ42) and phosphorylated tau (p-tau) in the cerebrospinal fluid (CSF) [8–10]. Few other studies have assessed sex-differences in voxel-wise longitudinal atrophy rates in cognitively unimpaired older adults (CU) [11, 12]. However, whether amyloid-β and tau deposition have a differential impact on longitudinal atrophy rates in CU women versus men remains unknown.
Additionally, looking at associations between glial biomarkers and sex-dependent longitudinal atrophy rates may give insight into potential mechanisms underscoring the differential susceptibility of men/women to AD pathology. Different sex-related microglial/astroglial association patterns might drive some of the differences observed between men and women across the AD continuum. The CSF concentration of YKL-40, a glycoprotein involved in inflammation and tissue remodeling expressed by reactive astrocytes [13], has been reported to be elevated in the preclinical stages of AD [14, 15]. On the other hand, the triggering receptor expressed on myeloid cells 2 (TREM2), involved in phagocytosis regulation, inflammatory signaling inhibition, and cell survival promotion, is selectively expressed by microglia in the brain [16–19]. Both YKL-40 and sTREM2 levels in CSF have been reported to correlate better with tau biomarkers than with Aβ42, which suggests that their main increase occurs once neurodegeneration is already in progress [15, 21]. Whether glial markers have a differential impact on brain structural changes in women versus men has not been evaluated.
In our previous works, we showed that baseline concentrations of CSF AD core biomarkers [22], as well as CSF glial ones [23], predicted longitudinal brain changes in a two-year follow-up study in CU. Therefore, the aim of this pilot work was to determine sex differences of the association between baseline levels of CSF Aβ42, p-tau, YKL-40, and sTREM2, and longitudinal brain volume changes in CU.
MATERIALS AND METHODS
Participants
This study has been approved by an independent Ethics Committee Hospital Clínic de Barcelona under the number HCB/2014/0923, and all participants gave written informed consent. Forty-six participants (57 to 78 years old at the baseline, 15 male) were recruited at the Alzheimer’s disease and other cognitive disorder unit, from the Hospital Clinic de Barcelona (Barcelona, Spain). Participants were subjected to the clinical and neuropsychological examination at three time points: the first two close to the two MRI scans and the last one a year after. The neuropsychological assessment included a Mini-Mental State Examination (MMSE), clinical dementia rating (CDR), and the Spanish version of Buschke memory tests [24, 25]. Normal cognition was defined by the MMSE score above or equal to 24 and the CDR scale score of 0. One participant was excluded from the study as they showed the MMSE score of 23 at the follow-up. Two participants did not fulfill the neuropsychological assessment at the third time point, but were not excluded from the analyses because they did meet the criteria at the second time point. Three other participants were excluded because their neurological diagnose was changed at the follow-up (one participant) or were classified as SNAPs (two participants). No psychiatric diagnoses were reported at both time points for any participant.
CSF sampling and quantification of biomarkers
CSF was collected by a lumbar puncture between 9in the morning and 12 noon and processed within 1 h. The determination of Aβ42 and p-tau levels was performed by enzyme-linked immunosorbent assay (ELISA) from Innogenetics (Ghent, Belgium). YKL-40 levels were analyzed with the commercial ELISA MicroVue™ YKL-40 EIA (Quidel Corporation, San Diego, CA, USA). All samples were run in duplicates (mean within run CV = 5.3%). CSF samples were diluted 1 : 2.5 in a final volume of 150μl to increase the upper limit of quantitation, which was 300 ng/mL, as to cover expected higher concentrations already reported in the literature. sTREM2 levels were measured in duplicate by an ELISA previously described using the MSD (MesoScale Discovery) Platform [18]. The mean intra-plate coefficient of variation (CV) of the ELISA was 2.9% and the inter-plate CV 12.9%. Duplicate measures with an intra-plate CV > 15% were excluded. In order to control for inter-plate variability, the same unique CSF sample (internal standard) was loaded in all plates and all measurements were expressed in relation to the internal standard of each plate.
At baseline, ten subjects showed Aβ42 values below the threshold for Aβ pathology, set at 500 pg/mL at the time of the analysis [26]. Three of them also presented abnormal high values of p-tau (greater than 75 pg/mL). Six subjects were excluded because of either outlier or absent values (as defined as over 2.5 standard deviations, STD) of p-tau (1 outlier: 5.2 STD), sTREM2 (1 subject: 3.8 STD), orYKL-40 (2 missing values, 2 outliers: 3.6 and 2.8 STD), leaving the final sample size to 36 subjects (12 males). Table 1 summarizes the main variables in the whole sample, categorized by sex.
Main variables for the whole sample and categorized by sex and p values of the corresponding women versus men T-tests. CSF biomarker levels in pg/mL except for sTREM2 that is in arbitrary units (logarithm of normalized values to an internal standard). Age and education (sch for school years) in years. No differences were below the statistical threshold (p < 0.05). although sex differences of CSF YKL-40 levels were close to be significant
Aβ42 was truncated at 750 pg/mL to perform statistical analyses on images. The rationale for this decision was that it could be inaccurate to correlate gray matter (GM) volume change per year (ΔGM) and white matter (WM) volume change per year (ΔWM) with higher values of Aβ42 [27]. That threshold was estimated as 20% over the threshold for pathology plus the precision of the measurement (estimated at 25% at the time the sample was analyzed [28], which includes the equipment accuracy and the procedures reproducibility). Thus, we ensured the absence of Aβ42 pathology above it in any of the cases. Instead, a new variable called AβP (for Aβ42 pathology), derived from Aβ42 through the formula AβP = maximum (1–Aβ42/750; 0), was used in subsequent imaging analyses. This way, AβP was zero in the absence of amyloid-β pathology (when Aβ42 >750 so 1–Aβ42/750 was negative) and increased in more severe the Aβ42 pathology [23].
Image acquisition
Subjects were scanned on a 3T MRI scanner (Magnetom Trio Tim, Siemens, Germany). The protocol included a high-resolution 3D structural T1-weighted MPRAGE acquisition (magnetization-prepared rapid gradient-echo; TR/TE/TI = 2300/2.98/900 ms, respectively, flip angle = 9°, 240 sagittal slices, 1×1×1 mm3 voxel) and those images were analyzed in this work. The mean time interval between lumbar puncture and baseline MRI was 41 days and ranged between 1 and 134 days. The interval between the first and second acquisition was 2.18±0.39 years. All images were visually inspected to discard artifacts and anatomical anomalies before the analyses.
Image preprocessing
Morphological longitudinal changes were evaluated by means of pairwise longitudinal registration [29] of SPM12 (Wellcome Trust Center for Neuroimaging; UCL, UK; http://www.fil.ion.ucl.ac.uk/spm/). This procedure results in a pre-post average image and an image of divergences of pre-post warps for each individual. Divergence maps, which accounted for local pre-post shrinking or expansion of the tissues, were divided by the interscan delay (years, one decimal) and masked into GM or WM in native space to get maps proportional to ΔGM and ΔWM, respectively. ΔGM and ΔWM were normalized to MNI (Montreal National Institute) using the flow fields obtained in the DARTEL normalization of pre-post average images [30]. Normalized images were smoothed with an isotropic Gaussian kernel of 10 mm FWHM (full width at half maximum) and masked with a common GM or WM mask in MNI space, as described in [31].
The two masking steps had different objectives. The first one was performed to avoid vanishing effects in the warp interpolations, since areas of shrinking (negative divergence, GM or WM) were surrounded by areas of expansion (positive divergence, mainly CSF). The interpolation of positive and negative values would result in close-to-zero values in MNI space, which would have partially removed the brain morphological changes. The second masking was used to restrict the analyses to GM or WM, since the smoothing spread the information across tissues. GM mask in MNI space, which was common to all the subjects, was manually edited to remove periventricular voxels, dilated one voxel to add GM partial volume voxels and completed with basal ganglia mask to fulfill the thalamus and globus pallidus, partially excluded during the segmentation. WM mask was calculated in an analogous way, but without dilatation.
Statistical analyses
For all statistical analyses, age refers to age at the time of the first scan. A Shapiro-Wilk test for normality was conducted on the CSF biomarker levels (Aβ42, p = 0.32; p-tau, p = 0.18; YKL-40, p = 0.98; sTREM2, p < 0.001). Therefore, sTREM2 was log-transformed to achieve normal distribution (Shapiro-Wilk normality test on log (sTREM2), p = 0.96). Henceforth, sTREM2 refers to the logarithm of CSF sTREM2 levels. A regression analysis was performed to assess the association of age, AβP, p-tau, YKL-40, and sTREM2. Welch’s t-tests were performed to assess sex differences in the main variables of interest and to discard longitudinal MMSE and Buschke tests differences that would reveal significant cognitive decline between time points. Results were considered significant at p < 0.05 (Table 1).
For the imaging analyses, we assessed the sex*baseline CSF biomarkers interactions on longitudinal morphological changes through general linear models, as implemented in SPM12. All covariates and regressors were linearly rescaled into the [0, 1] interval. The variable of interest (CSF biomarkers: Aβ42, p-tau, YKL-40, and sTREM2), age, sex, total intracranial volume (TIV), and increment of TIV (which accounted for eventual slight miscalibration of the scanner) were included in the model. We tested for sex*CSF biomarkers interactions correcting for the rest of the variables of interest, which allowed assessing the independent effect of each CSF biomarker. For instance, for sex differences in longitudinal GM changes associated to p-tau, the GLM formula was:ΔGM = p-tau_male + p-tau_female + age + sex + TIV +ΔTIV + AβP + YKL-40 + sTREM2, where p-tau_men and p-tau_women refers to the p-tau x sex interaction (p-tau values for the specified sex, zero otherwise). The contrasts of interest were p-tau_men >p-tau_women and p-tau_men <p-tau_women, which implied a significant higher dependence of ΔGM on p-tau in one sex with respect to the other.
The sign of the associations deserves special attention. According to the divergence sign criteria, a negative association means that greater biomarker levels are associated with greater loss of volume per year; while a positive correlation indicates that higher biomarker levels are associated with lower volume changes over age, maybe indicating a neuroprotective effect (lower atrophy rate) and/or to inflammatory or compensatory changes (increased volume) [32] Then, following the same example above, p-tau_male <p-tau_female indicated areas in the brain where atrophy rates associated to the same CSF p-tau levels were higher in females than in men.
For all statistical tests on images and taking into account the small size of the sample, we defined a lenient threshold of significance of p < 0.001, uncorrected for multiple comparisons with a minimum cluster size (k) of 100 voxels. Nonetheless, we posteriorly highlighted results surviving the more conservative statistical threshold of p < 0.05 FWE (family-wise error) corrected for multiple comparisons at the voxel level. AAL toolbox [33] was used to label GM statistical maps whereas JHU track atlas on FSL eyes was used to visually localize significant clusters in WM [34].
RESULTS
No significant differences in age, CSF biomarkers, education (years of school), and cognitive performance (MMSE) were found between sexes (Table 1). There was a trend toward a significant increase in CSFYKL-40 levels in men (p = 0.06).
We found significant associations between CSF p-tau, YKL-40, and sTREM2 levels (Table 2), but not with amyloid. No significant correlations were found between other variables, although there was a trend in the association between Aβ and age (p = 0.071). No significant differences were found in cognitive tests (MMSE, Buschke’s FCSRT) neither between sexes, nor time points and sex/time interaction (Table 3).
Correlation coefficients (associated p values) between main variables. CSF amyloid and age correlation was almost significant as expected. CSF p-tau and glial CSF biomarkers shown to be associated. The maximum correlation coefficient between these covariates was 0.52, which allowed the correction for the rest of them in the correlation analyses
correlation coefficient (
Cognitive assessment and between sexes T-test (associated p values). FDR, free delayed recall. TDR, total delayed recall in time points 1 (t1) and 3 (t3) and their difference between those time points (t1–t3). No significant differences were found in any test
With regard to imaging analyses, Fig. 1 and Tables 4 and 5 show significant clusters of sex differences in the association of CSF p-tau and glial biomarkers with volume change rates. We did not observe sex differences in longitudinal volume changes associated with baseline levels of CSF Aβ42 at this level of statistical significance. The most significant results, surviving p < 0.05 FWE corrected at peak level, were found in the interaction of YKL-40 and sex, in which women showed a greater atrophy in right insula, and left calcarine/precuneus, whereas men showed a greater atrophy in superior parietal and paracentral areas. Longitudinal atrophy associated with p-tau was restricted to medial temporal regions in women (including the hippocampus) while in men it was restricted to right superior temporal gyrus and parietal regions. Changes associated to sTREM2 were greater in women than in men and were adjacent to p-tau and YKL-40.
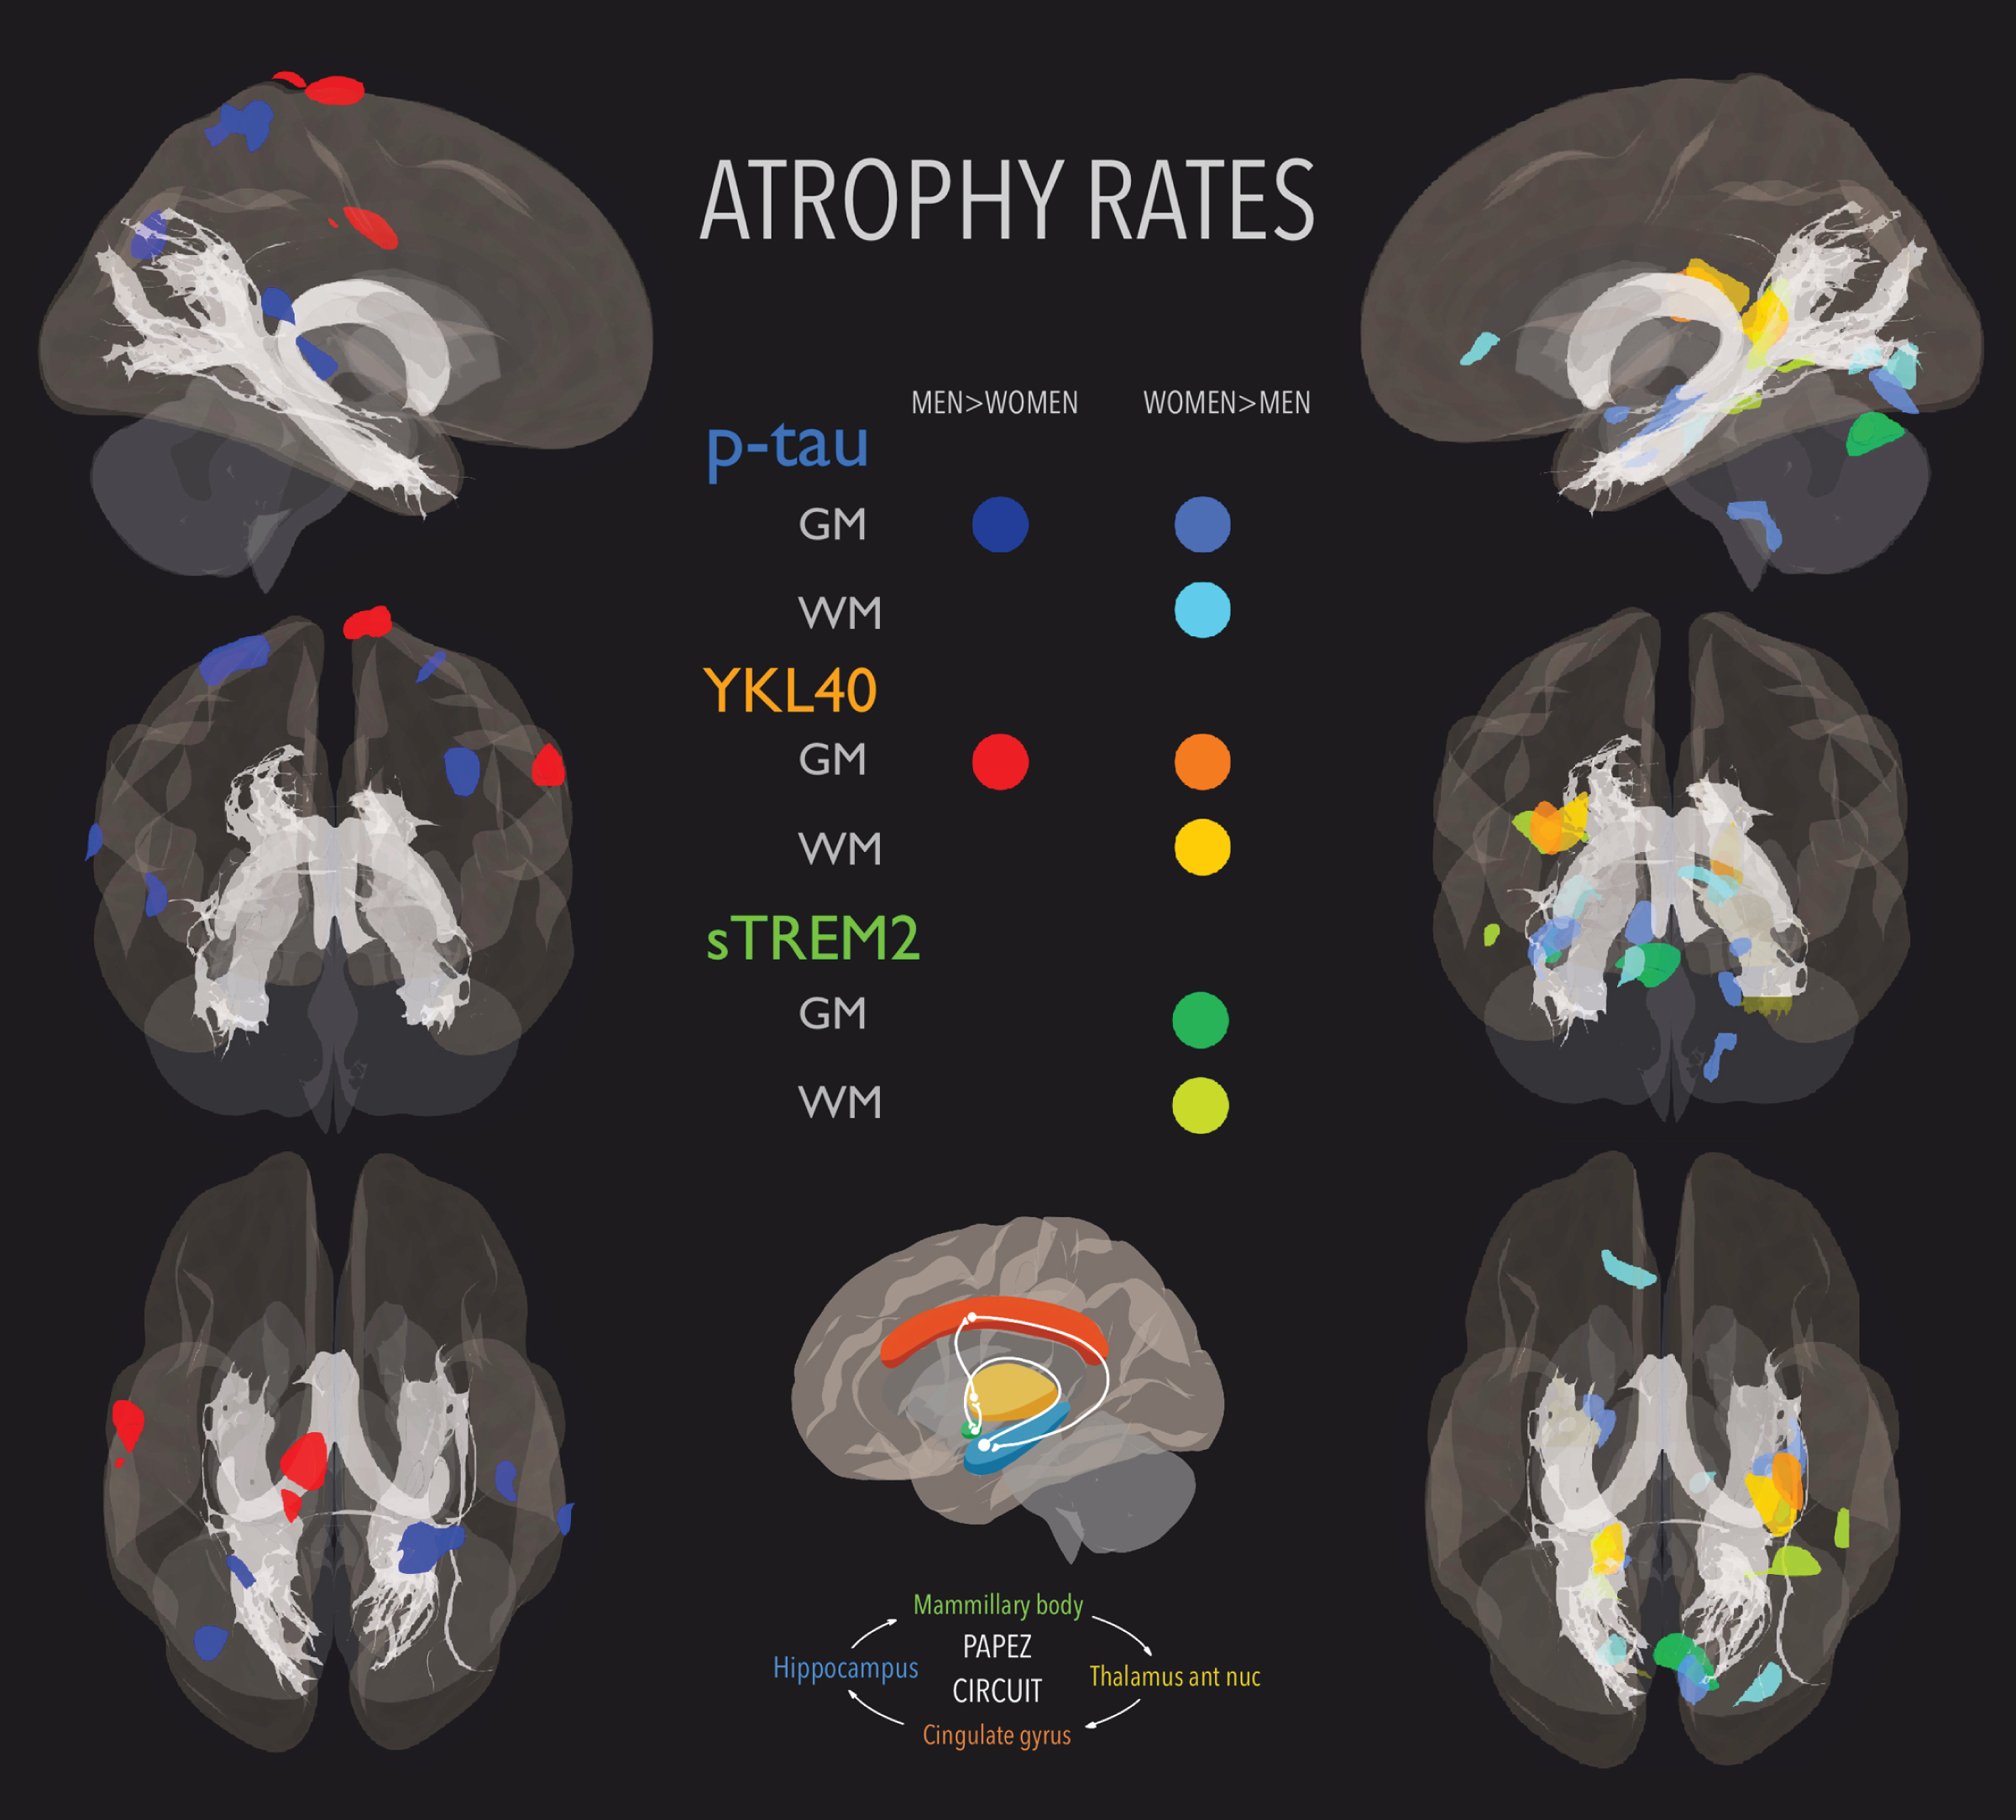
Areas whose atrophy rates were greater in men (first column) and women (second column) overlaid with fornix and hippocampi-cingulate bundles both part of Papez circuit. Color code: dark blue (p-tau-GM men > women); mid blue (p-tau-GM women > men); cyan (p-tau-WM women > men); red (YKL-40-GM men > women); orange (YKL-40-GM women > men); apricot (YKL-40-WM women > men); mint green (sTREM2-GM women > men); and lime (sTREM2-WM women > men). No sex differences were found in any association with Aβ42.
Description of significant clusters in GM analyses
**survived p value < 0.05; FWE peak level.
Description of significant clusters in WM analyses
** Survived p value < 0.05; FWE peak level.
Figure 1 shows separately the areas whose atrophy rates were greater in men (first column) and in women (second column). We included fornix and cingulum (hippocampi) bundles to show that significant areas were mainly part of the Papez circuit, related to the control of emotional expression and episodic memory [35]. The fornix ROI in MNI space displayed in the figure was obtained from [36] and the cingulum (hippocampus) one from JHU atlas [34]. Supplementary Figure 1 displays the same results in a combined multi-slice and glass-brain representations for a precise visual location of the clusters on an MNI template.
Some illustrative plots were placed in Supplementary Figures 2 and 3. In Supplementary Figure 2, we plotted the original ΔGM or ΔWM values in some significant peaks against the corresponding CSF biomarker, to see the sign of ΔGM and ΔWM. Supplementary Figure 3 displays to what extend the association of ΔGM or ΔWM with CSF biomarkers depended on correcting for the rest of biomarkers. The trend lines in Supplementary Figures 2 and 3 are displayed just for illustrative purposes. Therefore, they do not necessarily indicate a significant linear association between variables.
DISCUSSION
Our results showed that, in our sample, baseline CSF p-tau and glial biomarkers, but not CSF Aβ42, were differentially associated with brain longitudinal volume changes in CU, in women versus men. Most of the clusters showing longitudinal volume differences associated with the rest of CSF biomarkers were located in AD-related regions, such as temporal medial regions and precuneus (women showing greater atrophy rates) and parietal and premotor areas (men showing greater atrophy rates). Still, our results showed independent effects of CSF sTREM2, YKL-40, and p-tau on brain longitudinal volume changes. Regarding the CSF levels of the studied biomarkers, sTREM2 and YKL-40 were significantly associated with p-tau but not with Aβ42, in agreement with previous studies [15, 21]. Longitudinal WM changes (Supplementary Figure 2) were negative for almost all plotted voxels, as expected, whereas longitudinal GM ones showed positive and negative values in YKL-40 and p-tau associations. The existence of positive and negative GM longitudinal changes might indicate an overlap between atrophy and inflammatory/compensatory changes, depending on each subject’s status. Moreover, the trend lines in Supplementary Figure 3 show the same slope whether correcting or not for the rest of CSF biomarkers in p-tau and YKL-40 associations with longitudinal GM changes. The most varying slope after correcting for the remaining biomarkers was the one associated with sTREM2, showing some degree of interaction between sTREM2 and other CSF biomarkers.
To the best of our knowledge, this work is the first one showing that sex differences in longitudinal structural changes are associated with baseline levels of CSF biomarkers at very early stages of AD. The greater atrophy rates found in medial temporal regions in women blends with the lower hippocampal volume previously described in CU and early stages of AD in women [11, 38]. Other papers did not report sex differences in brain volumes in preclinical AD [10] or find an opposite trend, showing men a greater reduction of hippocampal volume in cognitively unimpaired individuals [39]. One possible explanation of such discordance could be that TIV was used to normalize hippocampal volumes in those studies, which could result in an overcorrection for head size in subjects with bigger brains (male), according to the conclusions presented in [40]. Moreover, Hua et al. [11] reported no significant sex differences in the control group (control male versus control female), whereas Skup et al. [12] described differences in right precuneus, amygdala, and left thalamus. Nevertheless, neither the post-processing, the use of non-diffeomorphic registration methods, nor the methods are directly comparable between those papers and our work, which could explain the disagreement of the results. The interaction of sTREM2 and YKL-40 with sex in medial temporal areas suggest a differential neuroinflammatory response to p-tau accumulation between men and women [11]. It is more difficult, in our opinion, to interpret why men showed greater atrophy rates than women in lateral parietal areas associated to p-tau and in premotor areas associated with YKL-40. Due to the lenient statistical threshold employed, it could be just a spurious difference. With respect to our previous works, some of the areas reported here, such as premotor, calcarine, paracentral lobe, or right medial temporal regions among others, were not identified then. This could show that apart from those common regions there are also sex-specific, brain volume changes associated with baseline abnormal levels of CSF AD and glial biomarkers.
The women’s greater loss of GM in Papez circuit associated with baseline CSF p-tau might be supporting evidence of a lower resilience to AD neurodegeneration markers, which would explain, at least partially, the greater prevalence of AD beyond their longer lifespan. However, it could also reflect that the thresholds for pathology differed between sexes, so differences were due to the fact we compared CU subjects at different stages of AD. Moreover, uncontrolled demographic variables could be responsible for the differences. Participants recruited in the study belong to a generation of clear sex-related differences in social roles and lifestyles, so results might be partially reflecting environmental factors [3, 42]. Regardless of these open questions, we did not find significant longitudinal differences between men and women in cognitive test performance, even at the third time point, which is in agreement with the hypothesis that structural changes precede functional ones in very early stages of the AD pathology [43, 44].
The main limitation of this pilot study was the sample size. Therefore, our conclusions might be sample-depending. With the collected data, it is not possible to elucidate whether the differences described in this paper correspond to biological and/or environmental factors. Therefore, further research is necessary to evaluate the generalizability of the results and to clarify the mechanisms responsible for the observed differences.
In this pilot study we found sex differences in brain longitudinal changes predicted by baseline CSF p-tau and glial biomarkers YKL-40 and sTREM2, none associated to Aβ42. Women showed greater atrophy in medial temporal areas (Papez circuit) associated to p-tau and to CSF glial biomarkers. Men showed greater atrophy in paracentral and parietal areas associated with CSF p-tau and YKL-40. Further research is needed to elucidate to what extent our results could be generalized and whether they revealed biological and/or environmental differences between sexes. Overall, our results support further research into sex differences in AD, starting from its preclinical stages.
Footnotes
ACKNOWLEDGMENTS
The research leading to these results has received support from the Innovative Medicines Initiative Joint Undertaking under grant agreement n° 115568, resources of which are composed of financial contribution from the European Union’s Seventh Framework Programme (FP7/2007-2013) and EFPIA companies’ in-kind contribution. The present communication reflects the authors’ view and neither IMI nor the European Union, EFPIA, or any Associated Partners are responsible for any use that may be made of the information contained herein. OG-R is supported by the Spanish Ministry of Science and Innovation - State Research Agency (FJCI-2017-33437). MS-C is supported by the Spanish Ministry of Science and Innovation - State Research Agency (IJC2018-037478-I) and received funding from the European Union’s Horizon 2020 Research and Innovation Program under the Marie Sklodowska-Curie action grant agreement No 752310. EMA-U is supported by the Spanish Ministry of Science and Innovation - State Research Agency (RYC2018-026053-I), co-funded by the European Social Fund (ESF). JDG is supported by the Spanish Ministry of Science and Innovation, “Ramón y Cajal” program (RYC-2013-13054). LR was part of the ‘Programa de Investigadores del Sistema Nacional Miguel Servet II’ [CPII14/00023].
We are indebted to colleagues at the Barcelonaβeta Brain Research Center and the Institutd’InvestigacionsBiomèdiques August Pi I Sunyer (IDIBAPS) for fruitful discussions.
