
Abstract
INTRODUCTION
Alzheimer’s disease (AD), the major cause of dementia, is a current and growing public health crisis due to the cognitive impairment and lack of effective treatments [1]. This progressive neurodegenerative disorder has characteristic pathological hallmarks including the amyloid cascade, synaptic dysfunction, senile plaques, neuroinflammation, and neurofibrillary tangles [2].
The deposition of insoluble extracellular amyloid-β (Aβ) plaques in the brain is a key risk factor for the development and the progression of AD. This excessive accumulation of toxic Aβ has been hypothesized to result from a production and clearance imbalance [3]. The vast majority of Aβ is primarily generated from the amyloid-β protein precursor (AβPP) in the brain by neurons, and cleaved by β-secretase andγ-secretase into certain isoforms, mainly Aβ42, Aβ40, and Aβ38 [4]. After production in the brain, soluble Aβ can be degraded by enzymes and phagocytes in the extracellular fluid. It is directly transported to the cerebrospinal fluid (CSF) or across the blood-brain barrier into the venous blood stream through transporters like low density lipoprotein receptor related protein 1 (LRP1) [5, 6]. The soluble LRP1 in plasma (sLRP1) acts as an additional peripheral aid for Aβ sequestration [7]. At the same time, the soluble receptor of advanced glycation end products (sRAGE) binds Aβ particles and thus reduces binding to membranous RAGE, which plays a key role in cerebral Aβ efflux [8, 9]. After drainage into the peripheral circulatory system, significant amounts of the brain-derived Aβ are removed through the capillary beds of the peripheral tissues and organs as proved by a time-matched change of venous/arterial ratio of Aβ levels [5]. Researchers also found that augmentation of peripheral Aβ clearance can independently attenuate the cerebral Aβ burden in rodent models, indicating the close relationship between peripheral Aβ clearance and Aβ deposition in the brain [10].
Sleep is an important physiological process and prior studies have proved its benefits through removal of multiple potentially toxic waste products, including Aβ [11], that accumulate during wakefulness and neural activity [12]. So far, many potential risk factors for AD have been identified. Bidirectional links have been found between poor sleep pattern and the risk of AD [13]. Epidemiological studies have identified that up to 25–40% of AD patients suffer from sleep disorders [14]. In patients with very mild cognitive impairment, abnormalities in the sleep pattern were found [14]. Even long before the clinical onset of AD, the AD-related pathophysiological Aβ deposition in the brain might disrupt sleep and circadian rhythms [15, 16]. Meanwhile, there is evidence of an increased risk of developing dementia (+33%) and AD (+51%) in men with self-reported sleep disturbances [17]. Total sleep duration of less than 5 h [18] or more than 11 h [19] per night was shown to increase the risk of cognitive impairment in the elderly, which may accelerate and exacerbate the onset of AD pathology. Amyloid deposition plays key role in the process and thus supports the hypothesis that Aβ may aggregate in the brain regions essential for sleep-wake balance.
Investigations of plasma Aβ have so far yielded conflicting results. An overnight decline of Aβ40/Aβ42 by 5.5% was found after sleep deprivation in a recent publication [20]. However, there are currently no studies in humans that directly assess the dynamic change of plasma Aβ in cognitively normal individuals during physiological sleep as opposed to sleep deprivation. Likewise, as the peripheral circulatory system plays a vital role in the clearance of Aβ, more data regarding this topic in relation to sleep deprivation may facilitate a better understanding of underlying pathomechanisms.
MATERIAL AND METHODS
Participants
We recruited 20 cognitively normal young individuals from the local population. Volunteers with a balanced sleep-wake rhythm (about 8 h per day, waking between 7:00-8:00, and sleep onset between 22:30-23:30) were included while exclusion criteria consisted of history of smoking, current medication, and night shift work. Experimental procedures were registered with the Chinese Clinical Trail Registry (No: ChiCTR-OIC-16007975) and approved by an institutional review board. Written consent was obtained from all participants.
Study design and procedure
All participants consented to one night of TSD (altogether 24 h of wakefulness, starting at 08:00 through 08:00 the next day). During the course of the experiment, they were provided with standardized and well-balanced meals at 08:30, 12:30, and 17:00, and snacks at 22:00. Throughout the night, a selection of card games, books, and electronic entertainment was accessible for the participants. Pure water was provided optionally, but no additional food intake and intensive workout was allowed. Participants were under the supervision of the researchers throughout the experiment. After TSD, short-term and full sleep recovery was allowed during daytime (09:00–11:00, 13:00–15:00) and night (22:00-08:00), respectively.
Blood sample collection and analysis
Participants were asked to provide 6 ml cubital vein blood samples (3 ml for dry red-top tube without anticoagulant and 3 ml for EDTA-anticoagulant lavender-top tube) every 4 h, except for the sleep recovery period (16:00-8:00 the day after TSD), to avoid sleep disruption. We performed 12 blood withdrawals per subject in total throughout the research period (see Fig. 1). The samples collected at 8:00 in the three research days were overnight fasting blood samples. Within 2 h after collection, samples were centrifuged at 2000G for 15 min. Following its separation, the plasma and serum was aliquoted into 100-μl polypropylene tubes and stored at –80°C until analysis to avoid repeated freeze-thaw cycles [21]. All samples were hemolysis free on visualinspection.

Sketch of experimental design. Time line of the study was indicated with dashes. Arrows shows the time point of blood draws from cubital vein. White zones indicate the wake period; grey zones indicate short-term sleep recovery and black zones indicated full nocturnal sleep recovery.
Laboratory assessments
Serum levels of SOD and MDA were measured using the WST-1 SOD (required serum volume: 20 μl) and TBA MDA (required serum volume: 50 μl) reagent kits (Jiancheng Co. Nanjing, China), respectively. Plasma Aβ42, Aβ40, sRAGE, and sLRP1 were determined using an enzyme-linked immunosorbent assay (ELISA, Yuanye Co. Shanghai, China). The detection limit for these assays was 1.0 pg/ml for Aβ40 and 1.0 pg/ml for Aβ42, 1.0 ng/mL for sLRP1, and 10 pg/ml for sRAGE. The measurements were performed on a Rayto RT-6000 analyzer (Rayto Co. Shenzhen, China) at 450 nm and concentrations were determined using standard curves. All samples were analyzed in duplicate.
Statistical analysis
SPSS version 17.0 (SPSS Inc., IBM) was used for all statistical analyses. All variables are presented as mean±SD. Statistical significance was set at p < 0.05. Graphs were plotted in GraphPad Prism version 5.01 for Windows (GraphPad Software, Inc.)
As primary analysis, we displayed the concentration of plasma Aβ40, Aβ42, and the ratio of Aβ42/Aβ40 over time and analyzed the data using paired student t-test comparing the three blood samples at 8:00 in the morning after fasting: before TSD, after TSD, after full sleep recovery (SR). The changes over time are expressed by change rate (difference between two points divided by the originalpoints).
The secondary analysis focused on the relationship between time spent awake and plasma levels of Aβ40, Aβ42, and the ratio of Aβ42/Aβ40 using linear regression in 24 h of TSD. Because there were substantial inter-individual differences in Aβ concentrations, we first z-scored each subject’s data for each awake period. The z-score of plasma Aβ concentration calculates as (μ= the mean value of the 24-h wakefulness period; σ= standard deviation of the concentration).
Furthermore, sLRP1, sRAGE, SOD, and MDA were separately analyzed using paired student t-test to compare the three morning blood samples after fasting. The changes over time were expressed by change rate in the same manner as mentioned above. Linear regression was utilized to analyze the relationship between Aβ and sLRP1, sRAGE, SOD, and MDA plasma concentrations.
RESULTS
Demographics of the study participants
All 20 participants were in their early adulthood (age 27.3±3.4 years) with normal cognition, good physical condition (body mass index: 20.9±2.4), and normal sleeping habits (Pittsburgh Sleep Quality Index: 6.0±3.3). The study population consisted of 45% women and 55% men. There was no statistical difference in plasma and serum indices between both genders.
Sleep deprivation increased plasma Aβ40 but not Aβ42 level
Figure 2 shows the plasma Aβ values of all participants in each blood sample. The lowest Aβ concentrations were observed at 8:00 before TSD. An increased amount was found throughout the first day and furthermore during TSD. A peak was reached in the morning after TSD and a slight decrease within the second day of overnight sleep recovery and another increase throughout the third day. Table 1 shows the results of Aβ40 and Aβ42 levels of 8:00 samples: before TSD, after TSD, after full SR (sleep recovery). Despite the expected relatively large inter-individual variation (Fig. 1A, left panel), the Aβ40 levels (45.75 pg/ml, 95% CI [37.47, 54.03]) were 32.6% above baseline (34.51 pg/ml, 95% CI [26.70, 42.33], p < 0.001) after 24-h TSD. This increase gradually reverses after sleep recovery and nearly reaches the baseline after total sleep recovery (35.41 pg/ml, 95% CI [27.25, 43.59]). Similar variation is detected in the ratio of Aβ42/Aβ40, which is 0.84 (95% CI [0.73, 0.95]) at baseline, decreases by 19.3% to 0.67 (95% CI [0.58, 0.75]) after TSD (p < 0.001), and returns to 0.93 (95% CI [0.60, 1.27]) after SR. As for Aβ42 (Fig. 1B, right panel), even though an overnight increase during TSD and slight decrease after sleep recovery can be observed, no significant effect of sleep was found.
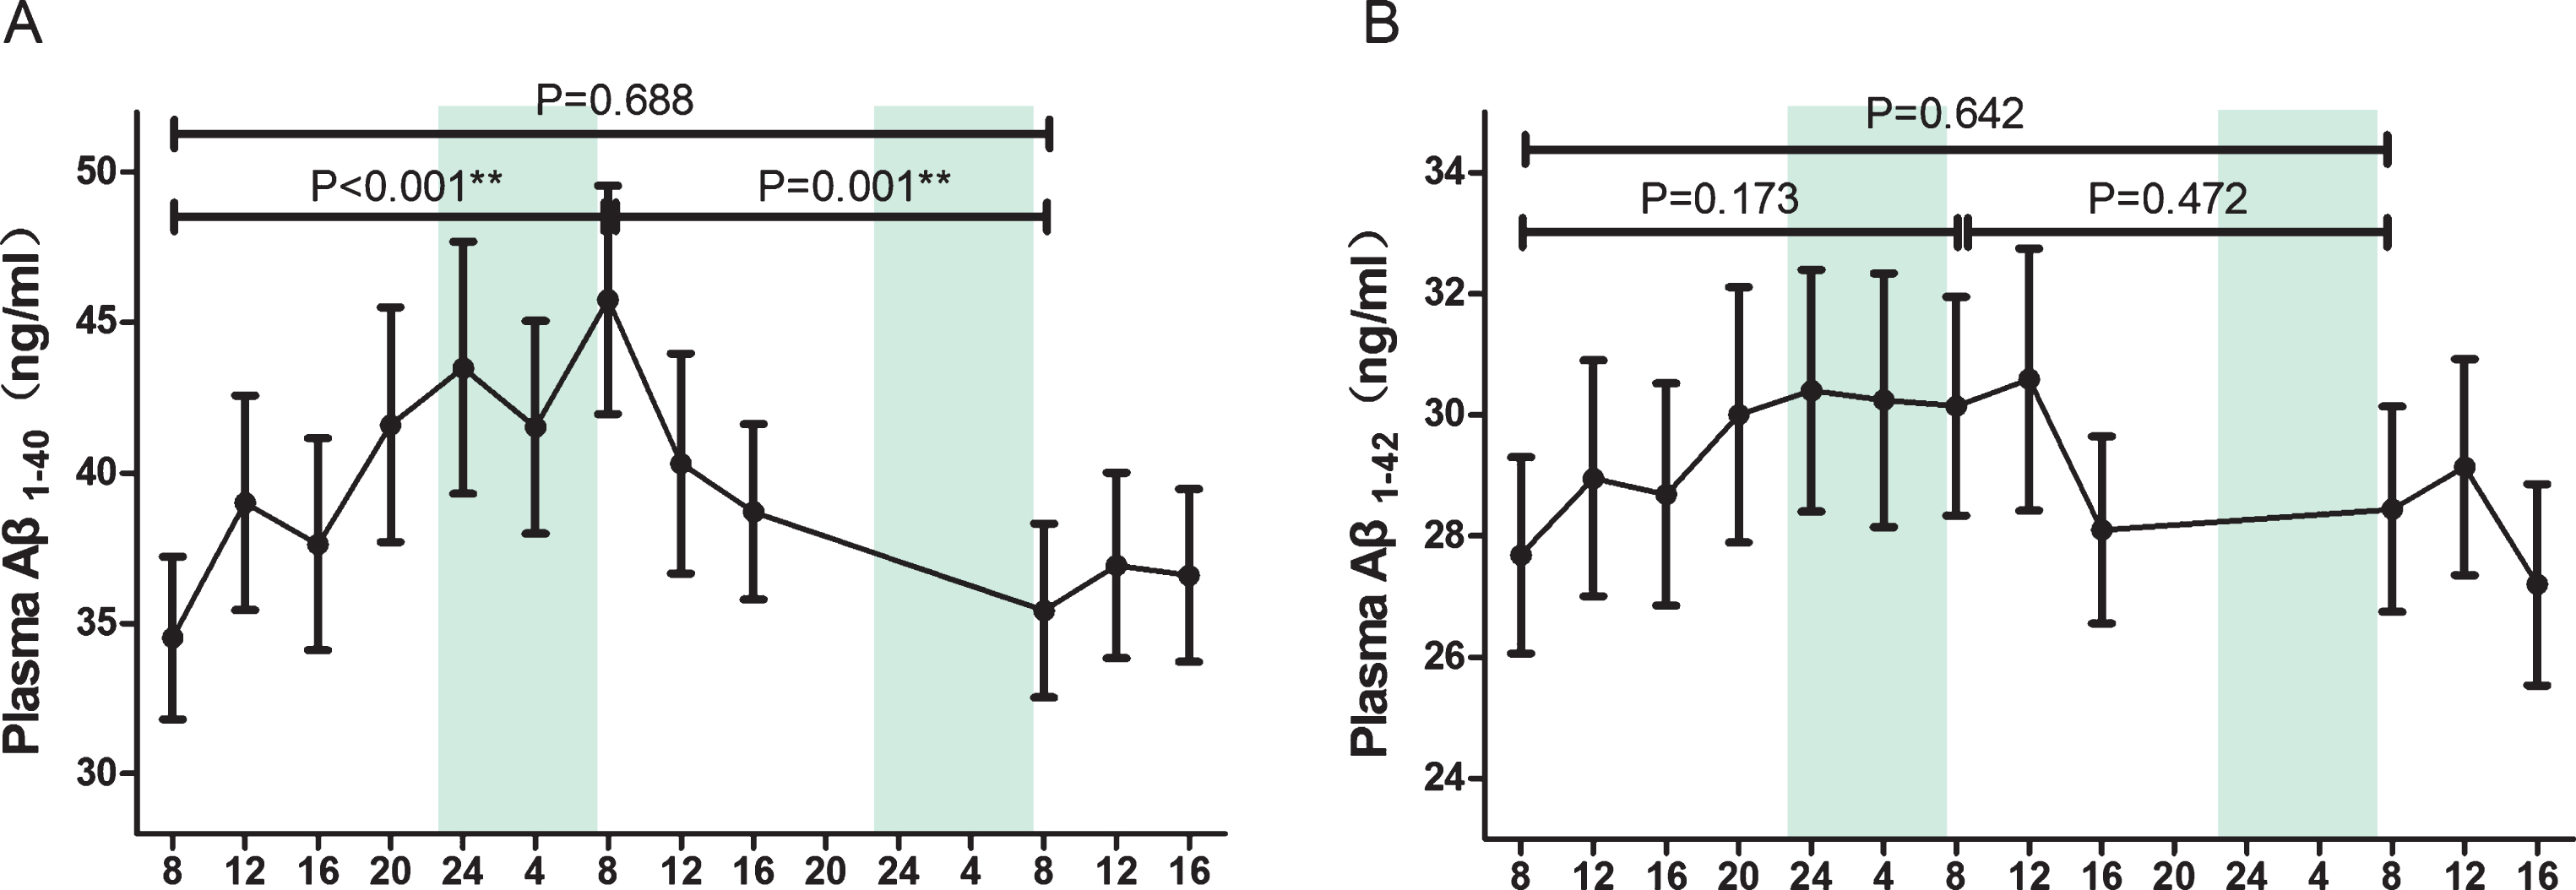
Mean plasma concentrations of Aβ1 - 40 and Aβ1 - 42 over time during TSD and sleep recovery. Mean and standard deviation are indicated by dots and vertical lines. Vertical shaded bars indicate the usual hours of sleep. The segments indicate the comparison between three fasting blood samples at 08:00. *p < 0.05 and **p < 0.01. Aβ, amyloid-β; TSD, total sleep deprivation.
Overview of plasma Aβ in the three research mornings
Overview of the plasma Aβ and the ratio of fasting blood at 8:00 in the three research mornings. Data given as Mean (SD). TSD, Total sleep deprivation; SR, sleep recovery; Aβ, amyloid-β.
Linear increase of plasma Aβ with the time of wakefulness
A positive relationship was found between thetime of wakefulness and plasma Aβ40 (r = 0.50, p < 0.001) as well as Aβ42 (r = 0.25, p = 0.003) (Fig. 3). The increase of plasma Aβ exhibited a significant correlation with the prolonged wakefulness of 24 h. However, the Aβ42/Aβ40 ratio failed to display the similar time-dependent change.

Scatter plots of plasma Aβ1 - 40 and Aβ1 - 42 with respect to the wake time during TSD. Filled circles and data show z-scored Aβ1 - 40 and Aβ1 - 42 concentration values for timely samples for each participant at each time point, and the traces indicate the best-fit regression line. Vertical shaded bars indicate the usual hours of sleep. Aβ, amyloid-β; TSD, total sleep deprivation.
Sleep deprivation decreased plasma sLRP1 and sRAGE
Plasma concentrations of sLRP1 (p = 0.018) and sRAGE (p = 0.001) decreased significantly after TSD. After sleep recovery sLRP1 continued to decrease (p = 0.009) while sRAGE remained constant (Fig. 4A, B).
In the linear regression, we found that the concentration of plasma Aβ is positively correlated with plasma level of sLRP1 and sRAGE before and after the TSD (Fig. 4C-J).

Plasma concentrations of sLRP1, sRAGE, and the relationship with Aβ1 - 40. Blood was sampled at 8:00 in the three experimental mornings. In panels A and B, data are shown as means±SD, indicated by dots and connecting lines. The segments indicate the comparison between three fasting blood samples at 08:00. *p < 0.05 and **p < 0.01. In panels C-F, filled circles and data show Aβ1 - 40, sLRP1, and sRAGE concentration values for each participant before and after TSD in mornings, and the traces indicate the best-fit regression line. In panels G-J, data shows the correlation between Aβ1 - 42, sLRP1, and sRAGE concentration values. TSD, total sleep deprivation; Aβ, amyloid-β; sLRP1, low-density lipoprotein receptor-related protein; sRAGE, soluble receptors for advanced glycation end products.
Sleep deprivation decreased serum levels of SOD and increased MDA
Serum SOD decreased after TSD as compared to the baseline (p = 0.005) and returned to the baseline after SR (p = 0.610). In contrast, serum MDA exhibited an increment after SD (p = 0.001) and returned to the baseline after SR (p = 0.145) (Fig. 5A, B).

Serum concentrations of SOD and MDA. Blood was sampled at 8:00 in the three experimental mornings. Data are shown as means, indicated by dots and connecting lines. The segments indicate the comparison between three fasting blood samples at 08:00. *p < 0.05 and **p < 0.01. TSD, total sleep deprivation; SR, sleep recovery; Aβ, amyloid-β; MDA, malonaldehyde; SOD, superoxide dismutase.
DISCUSSION
Here we showed that plasma Aβ40 levels increased by about 30% after a night of sleep deprivation in healthy young adults. The plasma Aβ40 level was linearly correlated with the time of wakefulness, and the changes were reversed after sleep recovery. However, these sleep-related effects were not observed for plasma Aβ42. Moreover, one night of TSD could decrease plasma level of sLRP1 (about 10%) and sRAGE (about 20%) and serum SOD (about 20%) and increase the MDA levels (about 15%). Furthermore, the concentration of plasma Aβ40 was linearly correlated with plasma level of sLRP1 and sRAGE.
It is well known that Aβ is the key marker of AD pathophysiology and cleaved from AβPP. In physiological conditions, Aβ40 was mainly removed through interstitial fluid (ISF) into the peripheral blood [22]. Through the relocation to the interstitial space and convection of ISF to the CSF, sleep contributes to the removal of multiple potentially toxic waste products, including Aβ [11]. In the present study, the lowest plasma Aβ was observed in the morning after a normal sleep pattern. As the wake time was extended, the plasma Aβ40 level increased gradually and reached the highest level after 24 h of sleep deprivation, depicting a possible sleep-related change. Further proof was the return of plasma Aβ40 to the baseline levels after compensating sleep. These findings indicate that brain activity during wakefulness can cause an increase of plasma Aβ40 and sleep can reverse these changes.
Recently, a close relationship between peripheral Aβ clearance and Aβ deposition in the brain has been found. Using a parabiosis model, Yang et al. found that Aβ burden in the brain could be attenuated with the enhancement of peripheral Aβ clearing capacity and this process had little relevance with the Aβ production or degradation [10]. With this in mind, the increase of plasma Aβ after TSD may also be an indicator of an increased Aβ burden in the brain.
Previous studies in fruit flies [11] and rodents [23] have indicated that sleep loss and sleep deprivation leads to an increase in Aβ burden in the brain. In AD model and wild type rodents, ISF Aβ accumulation could decrease by 20–25% after prolonged wakefulness manipulated by behavior or medicine. In human CSF, Aβ42 was also observed the decrease during overnight sleep and TSD abolished this change [24]. Time-matched change of venous/arterial ratio proved the removal of brain-derived Aβ through the capillary beds in periphery [5]. The dynamic interchange of Aβ peptides between brain and periphery indicate that circulating Aβ peptides play a critical role in AD pathology. Thus, monitoring of Aβ plasma levels in our study could give an insight into the change of cerebral Aβ burden. Despite the seeming frustration to validate plasma Aβ as a potential biomarker for AD, plasma levels of Aβ42 and Aβ40 as well as Aβ42 / Aβ40 ratio showed modest value as dynamic markers of short-term brain Aβ load.
Studies have found that sLRP1 may contribute to binding peripheral Aβ, preventing Aβ peptide influx into the brain. However, the oxidized sLRP1 in plasma fails to execute this Aβ ‘peripheral sink’ activity because of its inability to bind Aβ [7, 25].In plasma, sRAGE acts as a decoy and forms sRAGE-Aβ interactions, inhibiting Aβ aggregation and oxidative stress induced by RAGE-Aβ interactions [8]. To further investigate whether the change of plasma Aβ levels was related to the transport disturbance in periphery, we measured circulating sRAGE and sLRP1. We found that plasma sLRP1 and sRAGE significantly decreased after TSD. Furthermore, the concentration of plasma Aβ40 and Aβ42 is positively correlated with plasma levels of sLRP1 and sRAGE in morning blood measurements. Taken together, to some extent, our findings might indicate that sleep deprivation induced plasma Aβ40 increase may be caused by the dysfunction of peripheral clearance.
Studies showed that oxidative stress could disrupt binding of Aβ to both sLRP1 and sRAGE, while both RAGE-Aβ and LRP1-Aβ compounds could induce oxidative stress [8, 25]. Here we investigated theconcentration of oxidants and antioxidants, and found that serum SOD decreased significantly while serum MDA increased after TSD. It has to be kept in mind that SOD is an antioxidant while MDA represents a component of lipid peroxidation. These findings suggest that TSD might induce oxidative stress. It raises the possibility that oxidative stress induced by TSD could contribute to the decrease of both sRAGE and sLRP1, resulting in a disrupted peripheral clearance of Aβ.
However, unlike the results of a previous study [24], no major sleep effects were found toward plasma Aβ42. In fact, plasma may be a less sensitive biomarker compartment than CSF due to the variation in peripheral blood Aβ clearance rates and effects of dilution, which partially disguises Aβ formation in the brain and only yields a small difference in peripheral concentration. The presence of erythrocyte membrane proteins such as albumin and multiple other circulating Aβ-binding molecules may alter the measurable plasma levels of Aβ in the periphery [26]. Compared with Aβ40, Aβ42 is the more cytotoxic yet less prevalent Aβ species. Only 24 h of TSD may not be long enough to induce a significant change of Aβ42 peptide. These facts may be interpreted as possible reasons that masked the effect of sleep loss on the concentration of Aβ42.
In summary, our study demonstrated that sleep deprivation can lead to an increased level of plasma Aβ40 and decreased Aβ42/Aβ40 ratio. These changes appeared to be temporary as the concentration returned to baseline after sleep recovery. The underlying mechanisms may be relevant to the overproduction of Aβ in the brain and to the clearance of circulating Aβ (Fig. 6). Further studies are in progress in our laboratory to confirm this hypothesis.
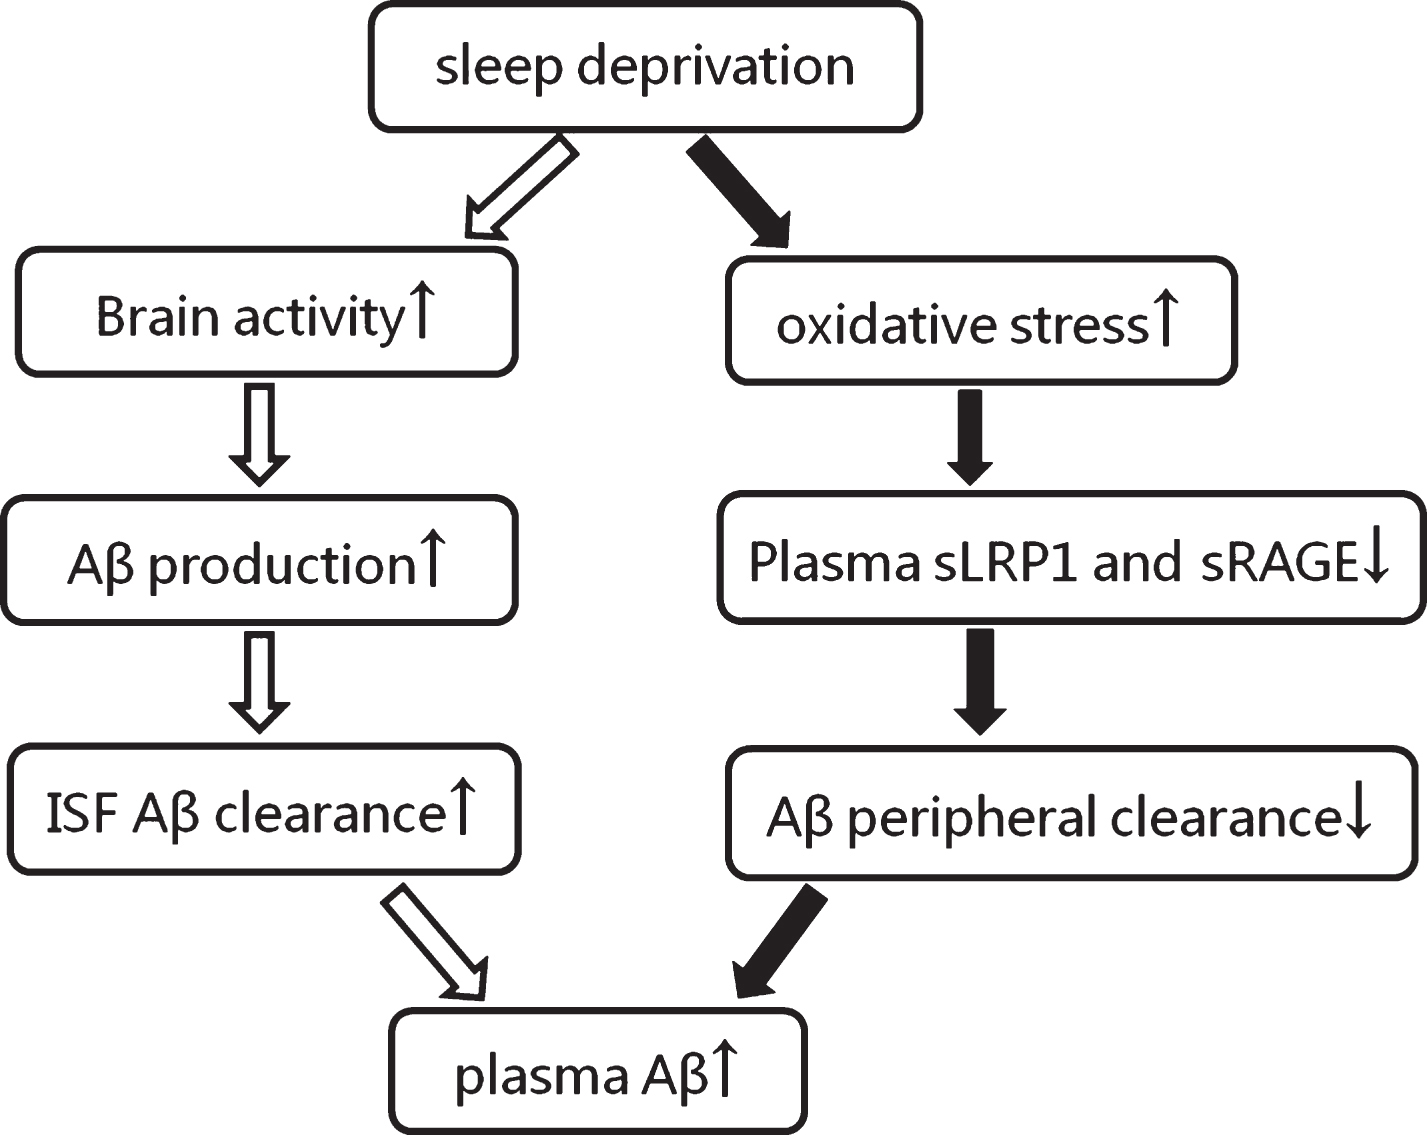
The speculative mechanism of plasma Aβ increment induced by sleep deprivation. The black arrows indicate our results and the white arrows indicate the presumed process. Aβ, amyloid-β; sLRP1, low-density lipoprotein receptor-related protein; sRAGE, soluble receptors for advanced glycation end products; ↑, increase; ↓, decrease.
There are limitations of this study. Firstly, AD is an age-dependent neurodegenerative disease with a most common onset age of over 65 years. In the current study, we investigated the effects of sleep deprivation on plasma Aβ in young adults, in order to eliminate the influence of underlying disease and chronic sleep disorders from which elderly persons may suffer. The study on young adults can veritably reflect a realistic correlation between sleep and plasma Aβ, but may yield different results in seniors. Secondly, the duration of TSD was set at 24 h because the subjects had difficulties upholding a longer TSD time in our preliminary study which led to variable results. Thirdly, we did not measure CSF Aβ and did not apply amyloid imaging like PiB-PET scan synchronously. Therefore, it may be difficult to determine whether the increase of plasma Aβ after TSD resulted from the ISF clearance and brain overproduction of Aβ.
Footnotes
ACKNOWLEDGMENTS
The authors thank all study participants for their cooperation. This work was supported by the Natural Science Foundation of China to Yong-Ning Deng (No. 81301097) and by National Key Technology Research and Development Program of the Ministry of Science and Technology of China (Grant No. 2015BAI13B01).